0991
Amide proton transfer-weighted MRI with multiple models DWI facilitates preoperative risk stratification of early stage endometrial carcinoma
Nan Meng1,2, Ting Fang1,2, Pengyang Feng3, Zhun Huang3, Jing Sun4, Xuejia Wang5, Jie Shang6, Kaiyu Wang7, Dongming Han5, and Meiyun Wang1,2
1Department of Medical Imaging, Zhengzhou University People’s Hospital & Henan Provincial People’s Hospital, Zhengzhou, China, 2Academy of Medical Sciences, Zhengzhou University, Zhengzhou, China, 3Department of Medical Imaging, Henan University People’s Hospital & Henan Provincial People’s Hospital, Zhengzhou, China, 4Department of Pediatrics, Zhengzhou Central Hospital, Zhengzhou University, Zhengzhou, China, 5Department of MR, the First Affiliated Hospital, Xinxiang Medical University, Weihui, China, 6Department of Pathology, the First Affiliated Hospital, Xinxiang Medical University, Weihui, China, 7MR Research China, GE Healthcare, Beijing, China
1Department of Medical Imaging, Zhengzhou University People’s Hospital & Henan Provincial People’s Hospital, Zhengzhou, China, 2Academy of Medical Sciences, Zhengzhou University, Zhengzhou, China, 3Department of Medical Imaging, Henan University People’s Hospital & Henan Provincial People’s Hospital, Zhengzhou, China, 4Department of Pediatrics, Zhengzhou Central Hospital, Zhengzhou University, Zhengzhou, China, 5Department of MR, the First Affiliated Hospital, Xinxiang Medical University, Weihui, China, 6Department of Pathology, the First Affiliated Hospital, Xinxiang Medical University, Weihui, China, 7MR Research China, GE Healthcare, Beijing, China
Synopsis
Intravoxel incoherent motion (IVIM) and diffusion kurtosis imaging (DKI) can fully reflect the information of water molecular diffusion, microcirculation perfusion, and tissue heterogeneity. Amide proton transfer-weighted imaging (APTWI) has unique advantages in displaying mobile proteins and polypeptides. Our results showed that IVIM, DKI, and APTWI can estimate the risk stratification of early-stage (FIGO ≤ I) endometrial carcinoma (EC), and the combination of D, MK, and MTRasym (3.5 ppm) may be an effective imaging marker for identifying low-risk and non-low-risk early-stage EC.
Introduction
Endometrial cancer (EC) is one the most common gynecologic malignancy worldwide, and approximately 80% of patients are diagnosed with EC at an early stage (FIGO ≤ I) [1]. Conventional MRI sequences reflect only the morphological characteristics of lesions, making it challenging to pre-evaluate the risk stratification of early-stage EC [2]. Multiple models diffusion-weighted imaging (DWI), including intravoxel incoherent motion (IVIM) and diffusion kurtosis imaging (DKI), is sensitive to the water molecular diffusion, microcirculation perfusion, and heterogeneity in biological tissue [3, 4]. Amide transfer-weighted imaging (APTWI) is a molecular imaging technology that can achieve noninvasive quantitative assessment of mobile proteins and polypeptides concentrations in tissues without the use of contrast agents [5]. This study aimed to investigate the application of APTWI, monoexponential, biexponential, stretched exponential IVIM, and DKI for the evaluation of risk stratification in early-stage EC.Methods
A total of 80 enrolled subjects were classified into low-risk and non-low-risk (medium- and high-risk) groups. A 3.0-T MR scanner (Discovery MR750, GE Healthcare) with a 16-channel phased-array body coil was performed. First, axial T1-weighted imaging (T1WI) and T2-weighted imaging (T2WI) were performed. Next, regarding the above images, the slices where a tumor appeared to be present were selected as the scan sections for multimodel DWI and APTWI. The monoexponential model was performed by using two b values (0, 1000 s/mm2). The biexponential and stretched models were performed by using ten b values (0, 25, 50, 100, 150, 200, 400, 600, 800, and 1000 s/mm2). The DKI was performed by using five b values (0, 500, 1000, 1500, and 2000 s/mm2). APTWI was conducted by using a saturation pulse (Tsat) with a duration of 0.5 s and a saturation power level of 2.0 μT. A total of 52 frequencies, including 49 offsets ranging from -600 to +600 Hz with an interval of 25 Hz and a frequency of 5000 Hz (3 times) far from the resonant frequency, were used for the APTWI and z-spectrum scans for signal normalization. The water saturation shift reference (WASSR) was applied for B0 correction. The ROIs, excluding areas with large vessels, hemorrhagic, calcified, cystic, and necrotic, were drawn along the edge at the maximum cross-section of the tumor.MedCalc 15.0 and SPSS 23.0 were employed for statistical analyses. The independent-sample t-test and Mann-Whitney U test were applied for between-group comparison. The receiver operating characteristic (ROC) curve and Delong test were performed to evaluate and compare the diagnostic performance of each parameter. The logistic regression analyses were used to derive a prediction model. Results with P < 0.05 were considered to be significant.
Results
The α [(0.86 ± 0.06) vs (0.81 ± 0.06)], ADC [(0.91 ± 0.09) vs (0.84 ± 0.06) ×10−3mm2/s], D [(0.84 ± 0.08) vs (0.73 ± 0.07) ×10−3mm2/s], DDC [(1.15 ± 0.11) vs (1.05 ± 0.09) ×10−3mm2/s], and MD [(1.18 ± 0.09) vs (1.08 ± 0.11) ×10−3mm2/s] were higher and the f [(2.55 ± 0.79) vs (3.09 ± 0.66) %], MK [(0.82 ± 0.04) vs (0.88 ± 0.04)], and MTRasym (3.5 ppm) [(3.19 ± 0.34) vs (3.59 ± 0.35) %] were lower in the low-risk group than in the non-low-risk group. The difference in D* between the two groups was not significant (P = 0.289) (Figure.1, 2).Among age, tumor size, and related parameters, only D, MK, and MTRasym (3.5 ppm) were independent predictors. The AUCs of the combination of independent predictors, MK, D, MD, MTRasym(3.5ppm), DDC, α, ADC, and f were 0.958, 0.864, 0.836, 0.770,0.768, 0.760, 0.746, 0.726, and 0.678, respectively, and the differences between AUC (MK + D + MTRasym (3.5 ppm)) and AUC (MK), AUC (D), AUC (MD), AUC (MTRasym (3.5 ppm)), AUC (DDC), AUC (α), AUC (ADC), and AUC (f) were significant (Z = 2.850, 3.157, 3.446, 3.943, 3.632, 3.687, 4.086, and 4.515; P all < 0.05). However, when individual parameters were assessed, only the differences between AUC (MK) and AUC (ADC), AUC (f), AUC (DDC), and AUC (α) and between AUC (D) and AUC (f) were significant.(Z = 1.961, 2.818, 2.019, 1.997, and 2.157, P all < 0.05) (Figure.3, 4, and 5).
Discussion
Compared with low-risk early-stage EC, non-low-risk early-stage EC has an increase in cellular density, nuclear atypia, microvessel density (MVD), and microscopic necrosis [6, 7, 8], which not only can limit the diffusion velocity of water molecules, also can increase the contents of mobile proteins and polypeptides, capillary microcirculation perfusion, and intravoxel diffusion heterogeneity, leading to changes in signal intensity (SI) of APTWI and multimodel DWI. The reasons for no difference in D* value between low-risk and non-low-risk early-stage EC may be as follows: the opposite influence of the capillary segment length and average blood velocity, poor measurement reproducibility, low signal-to-noise ratio (SNR), and tumor heterogeneity [9, 10].Conclusion
IVIM, DKI, and APTWI parameters were associated with the risk classification of early-stage EC. The combination of D, MK, and MTRasym (3.5 ppm) may have potential as imaging markers for risk stratification in early-stage EC.Acknowledgements
No acknowledgement found.References
- Siegel RL, Miller KD, Jemal A. Cancer statistics, 2019. CA Cancer J Clin. 2019; 69(1):7-34.
- Sala E, Rockall AG, Freeman SJ, Mitchell DG, Reinhold C. The added role of MR imaging in treatment stratification of patients with gynecologic malignancies: what the radiologist needs to know. Radiology. 2013;266(3):717-740.
- Le Bihan D, Breton E, Lallemand D, Aubin ML, Vignaud J, Laval-Jeantet M. Separation of diffusion and perfusion in intravoxel incoherent motion MR imaging. Radiology. 1988;168(2): 497-505.
- Bennett KM, Schmainda KM, Bennett RT, Rowe DB, Lu H, Hyde JS. Characterization of continuously distributed cortical water diffusion rates with a stretched-exponential model. Magn Reson Med. 2003;50(4):727-734.
- Zhou J, Payen JF, Wilson DA, Traystman RJ, van Zijl PC. Using the amide proton signals of intracellular proteins and peptides to detect pH effects in MRI. Nat Med. 2003;9(8):1085-1090.
- Takayama Y, Nishie A, Togao O, et al. Amide Proton Transfer MR Imaging of Endometrioid Endometrial Adenocarcinoma: Association with Histologic Grade. Radiology. 2018; 286(3): 90-917.
- Dobrzycka B, Mackowiak-Matejczyk B, Kinalski M, et al. Pretreatment serum levels of bFGF and VEGF and its clinical significance in endometrial carcinoma. Gynecol Oncol. 2013;128(3): 454-460.
- Fukunaga T, Fujii S, Inoue C, et al. Accuracy of semiquantitative dynamic contrast-enhanced MRI for differentiating type II from type I endometrial carcinoma. J Magn Reson Imaging. 2015; 41(6):1662-1668.
- Liu C, Wang K, Chan Q, et al. Intravoxel incoherent motion MR imaging for breast lesions: comparison and correlation with pharmacokinetic evaluation from dynamic contrast-enhanced MR imaging. Eur Radiol. 2016;26(11):3888-3898.
- Zhang J, Chen X, Chen D, Wang Z, Li S, Zhu W. Grading and proliferation assessment of diffuse astrocytic tumors with monoexponential, biexponential, and stretched-exponential diffusion-weighted imaging and diffusion kurtosis imaging. Eur J Radiol. 2018;109:188-195.
Figures
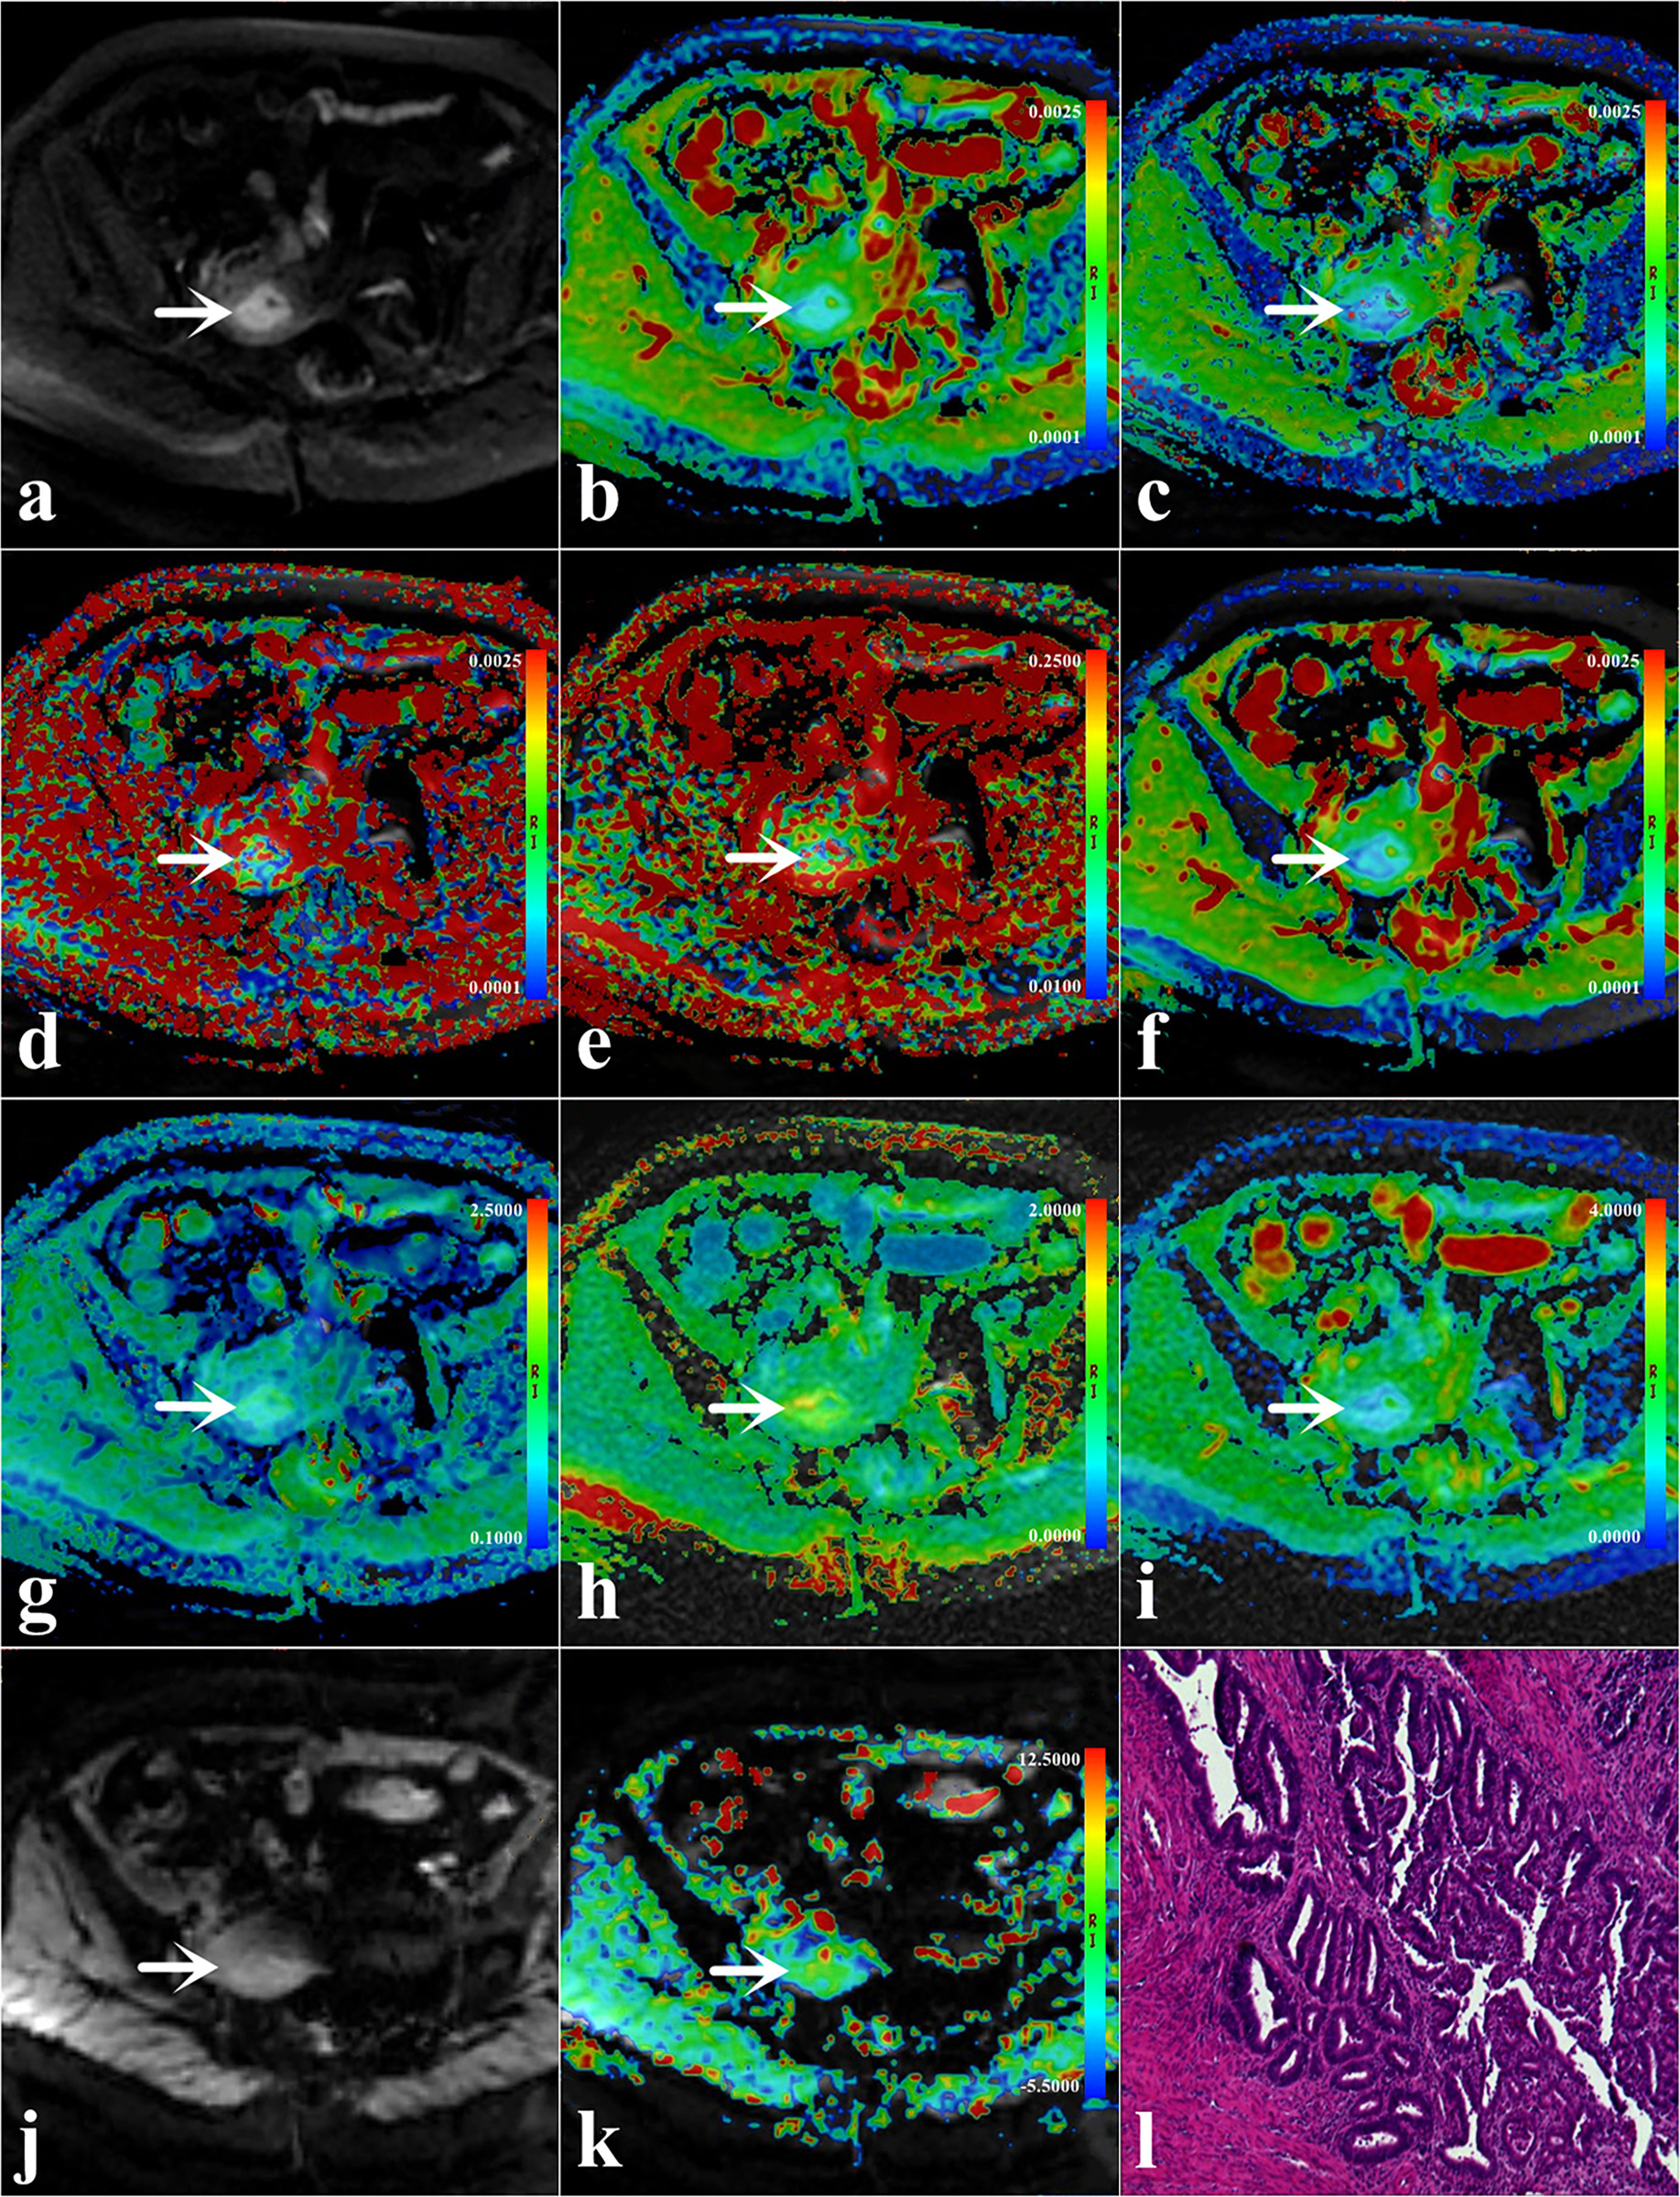
Figure.1. A 46-year-old woman with low-risk early-stage
EC (arrowheads,
endometrioid type; grade 1 with stage IA, the depth of myometrium infiltration
is less than 1/2). (a) DWI original map (b = 1000 s/mm2);
Pseudo colored maps of ADC (b), D (c), D* (d), f (e), DDC (f), α (g), MK (h), MD
(i), and MTRasym (3.5ppm) (k); (j) APTWI original map, and (l) Pathological
images (magnification = 100).
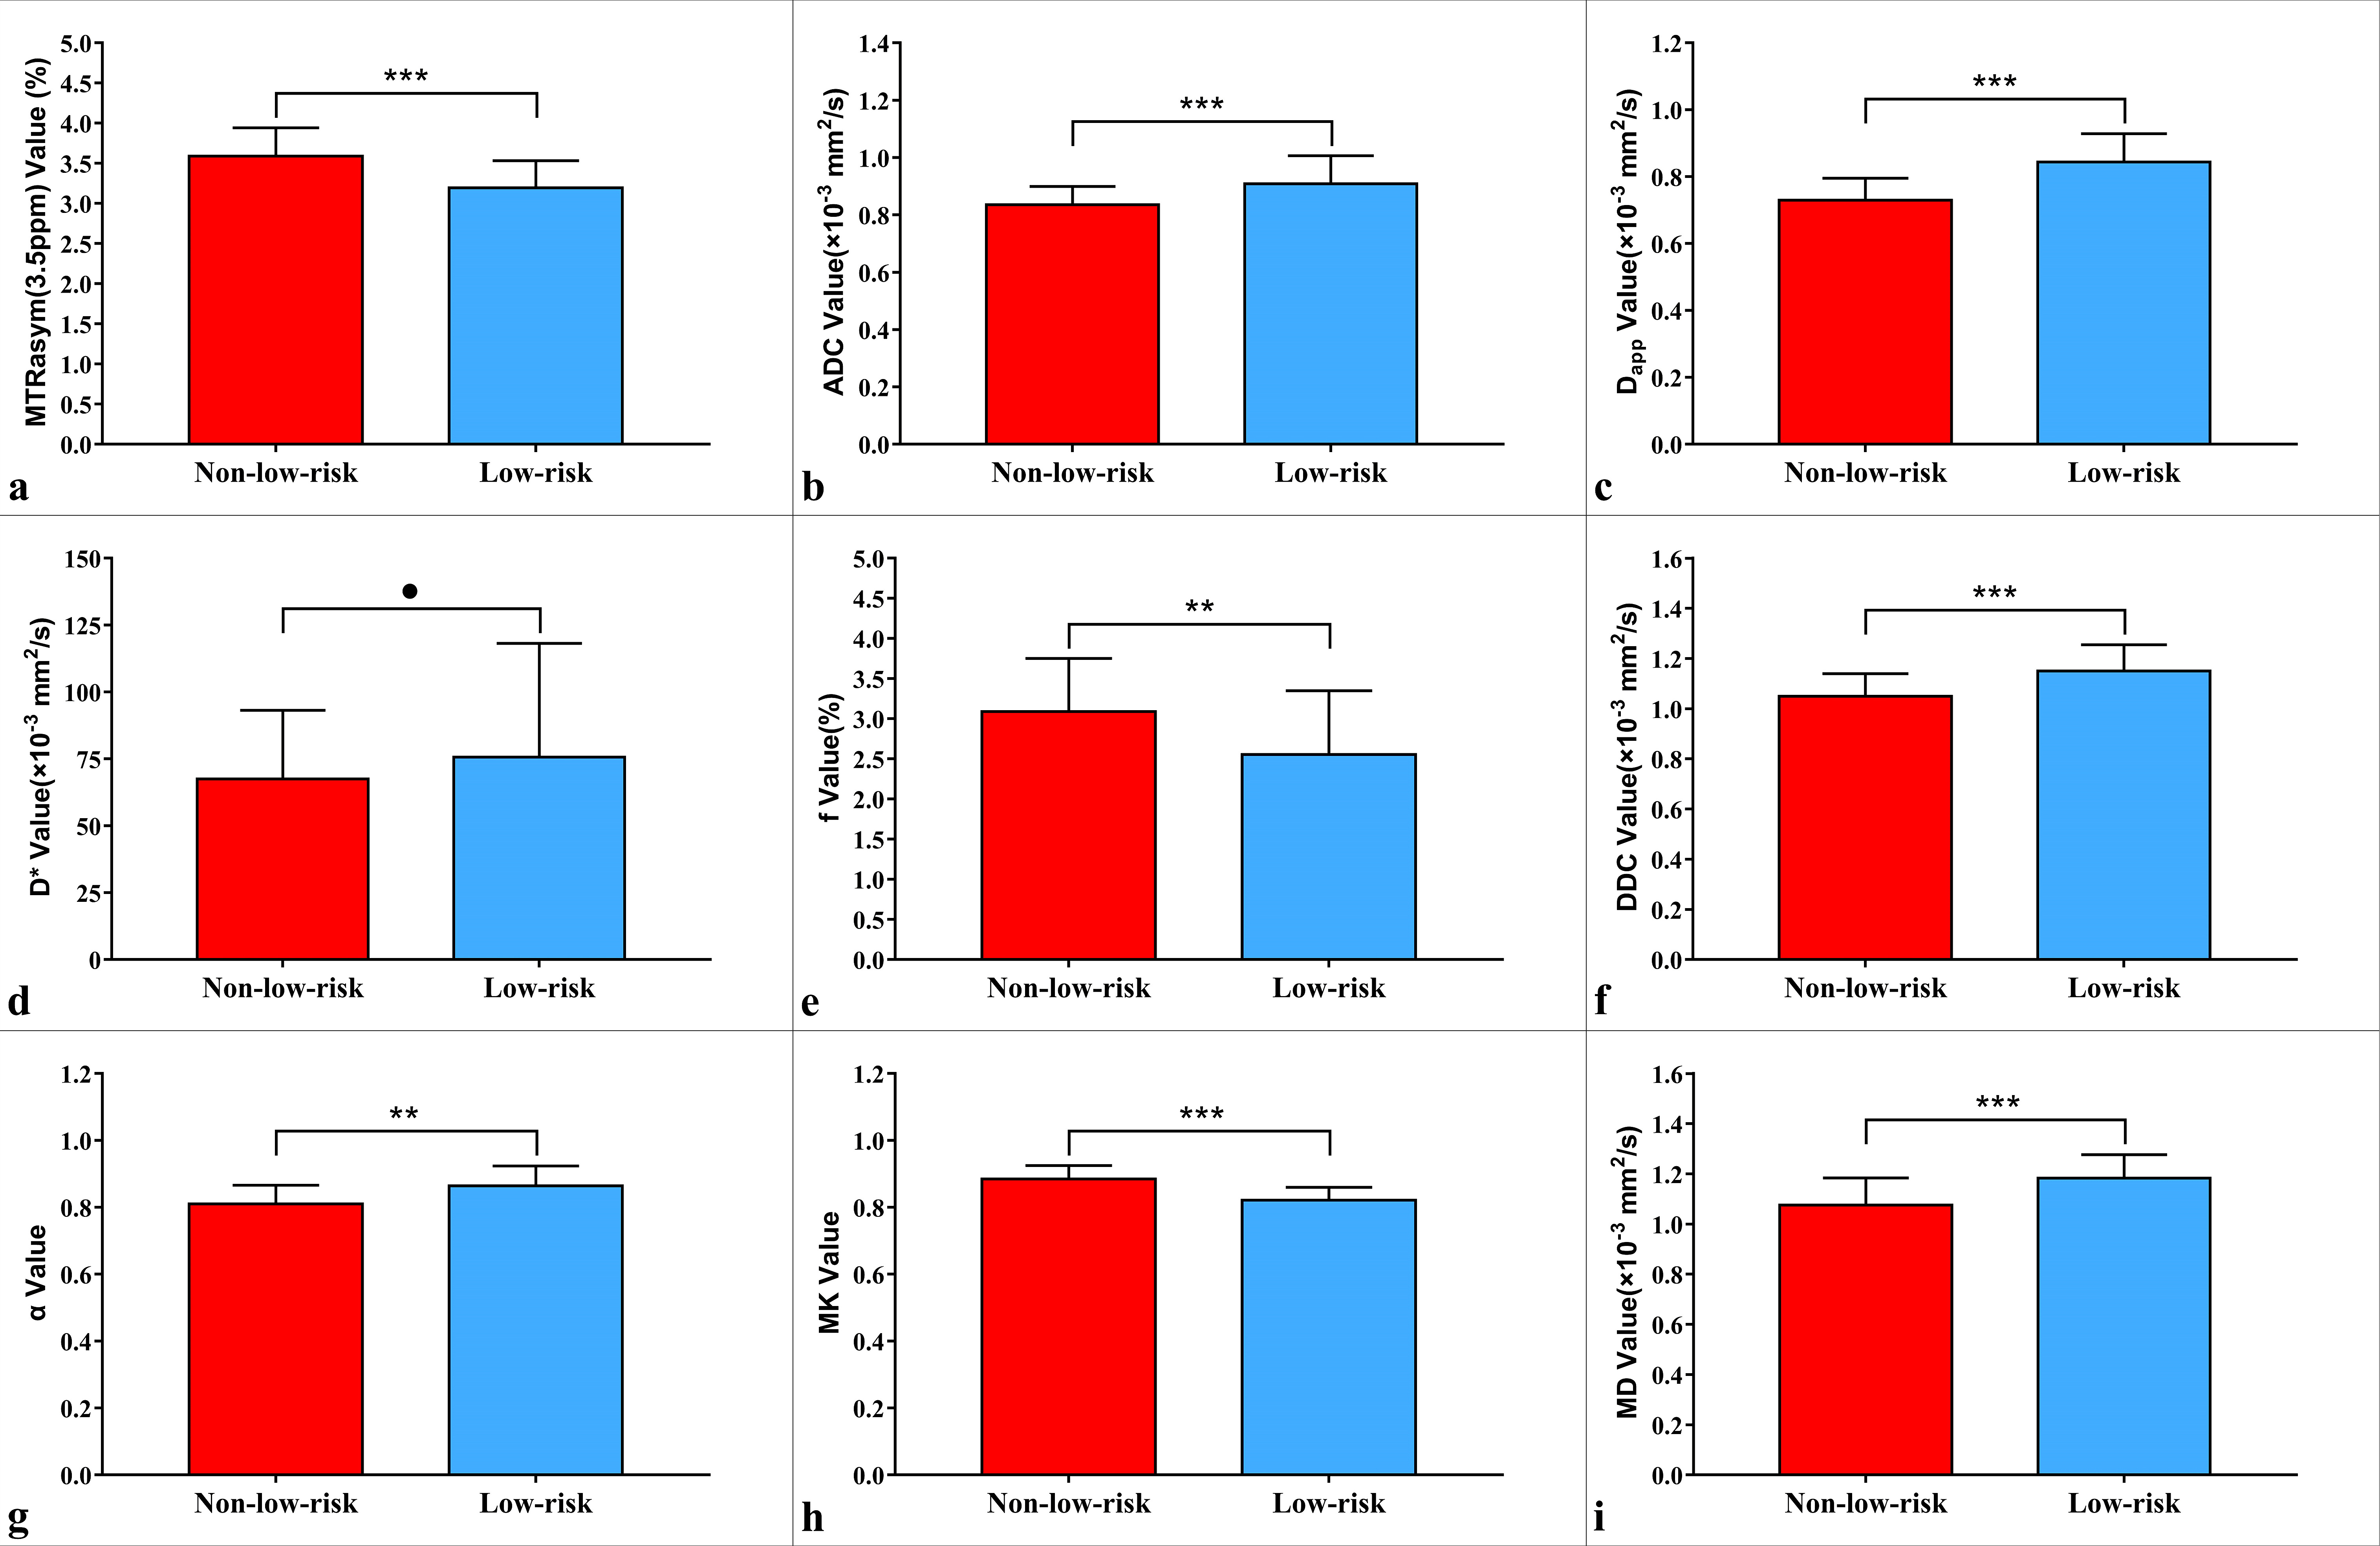
Figure.2. Plots show individual data points, averages, and
standard deviations of different parameters. Individual points are averages of
values calculated by 2 readers. *P < 0.05, **P < 0.01, ***P < 0.001,
and ●P > 0.05.
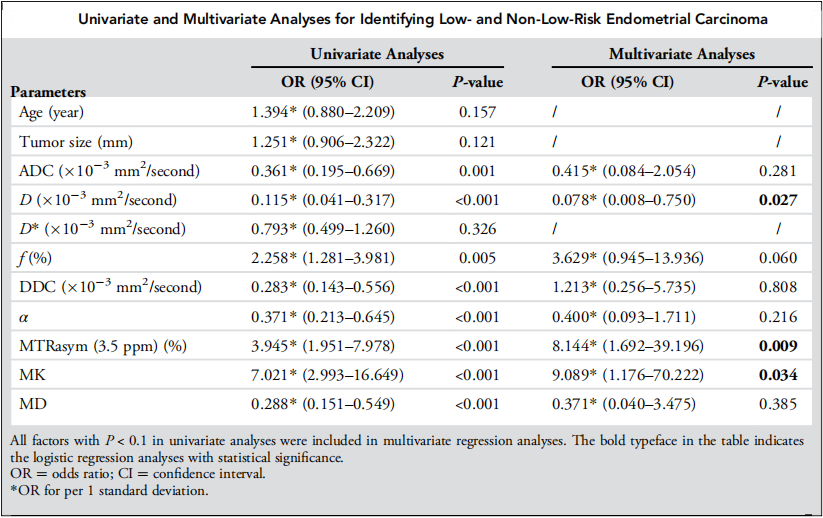
Figure.3. Univariate and
multivariate analyses for identifying low- and non-low-risk EC.
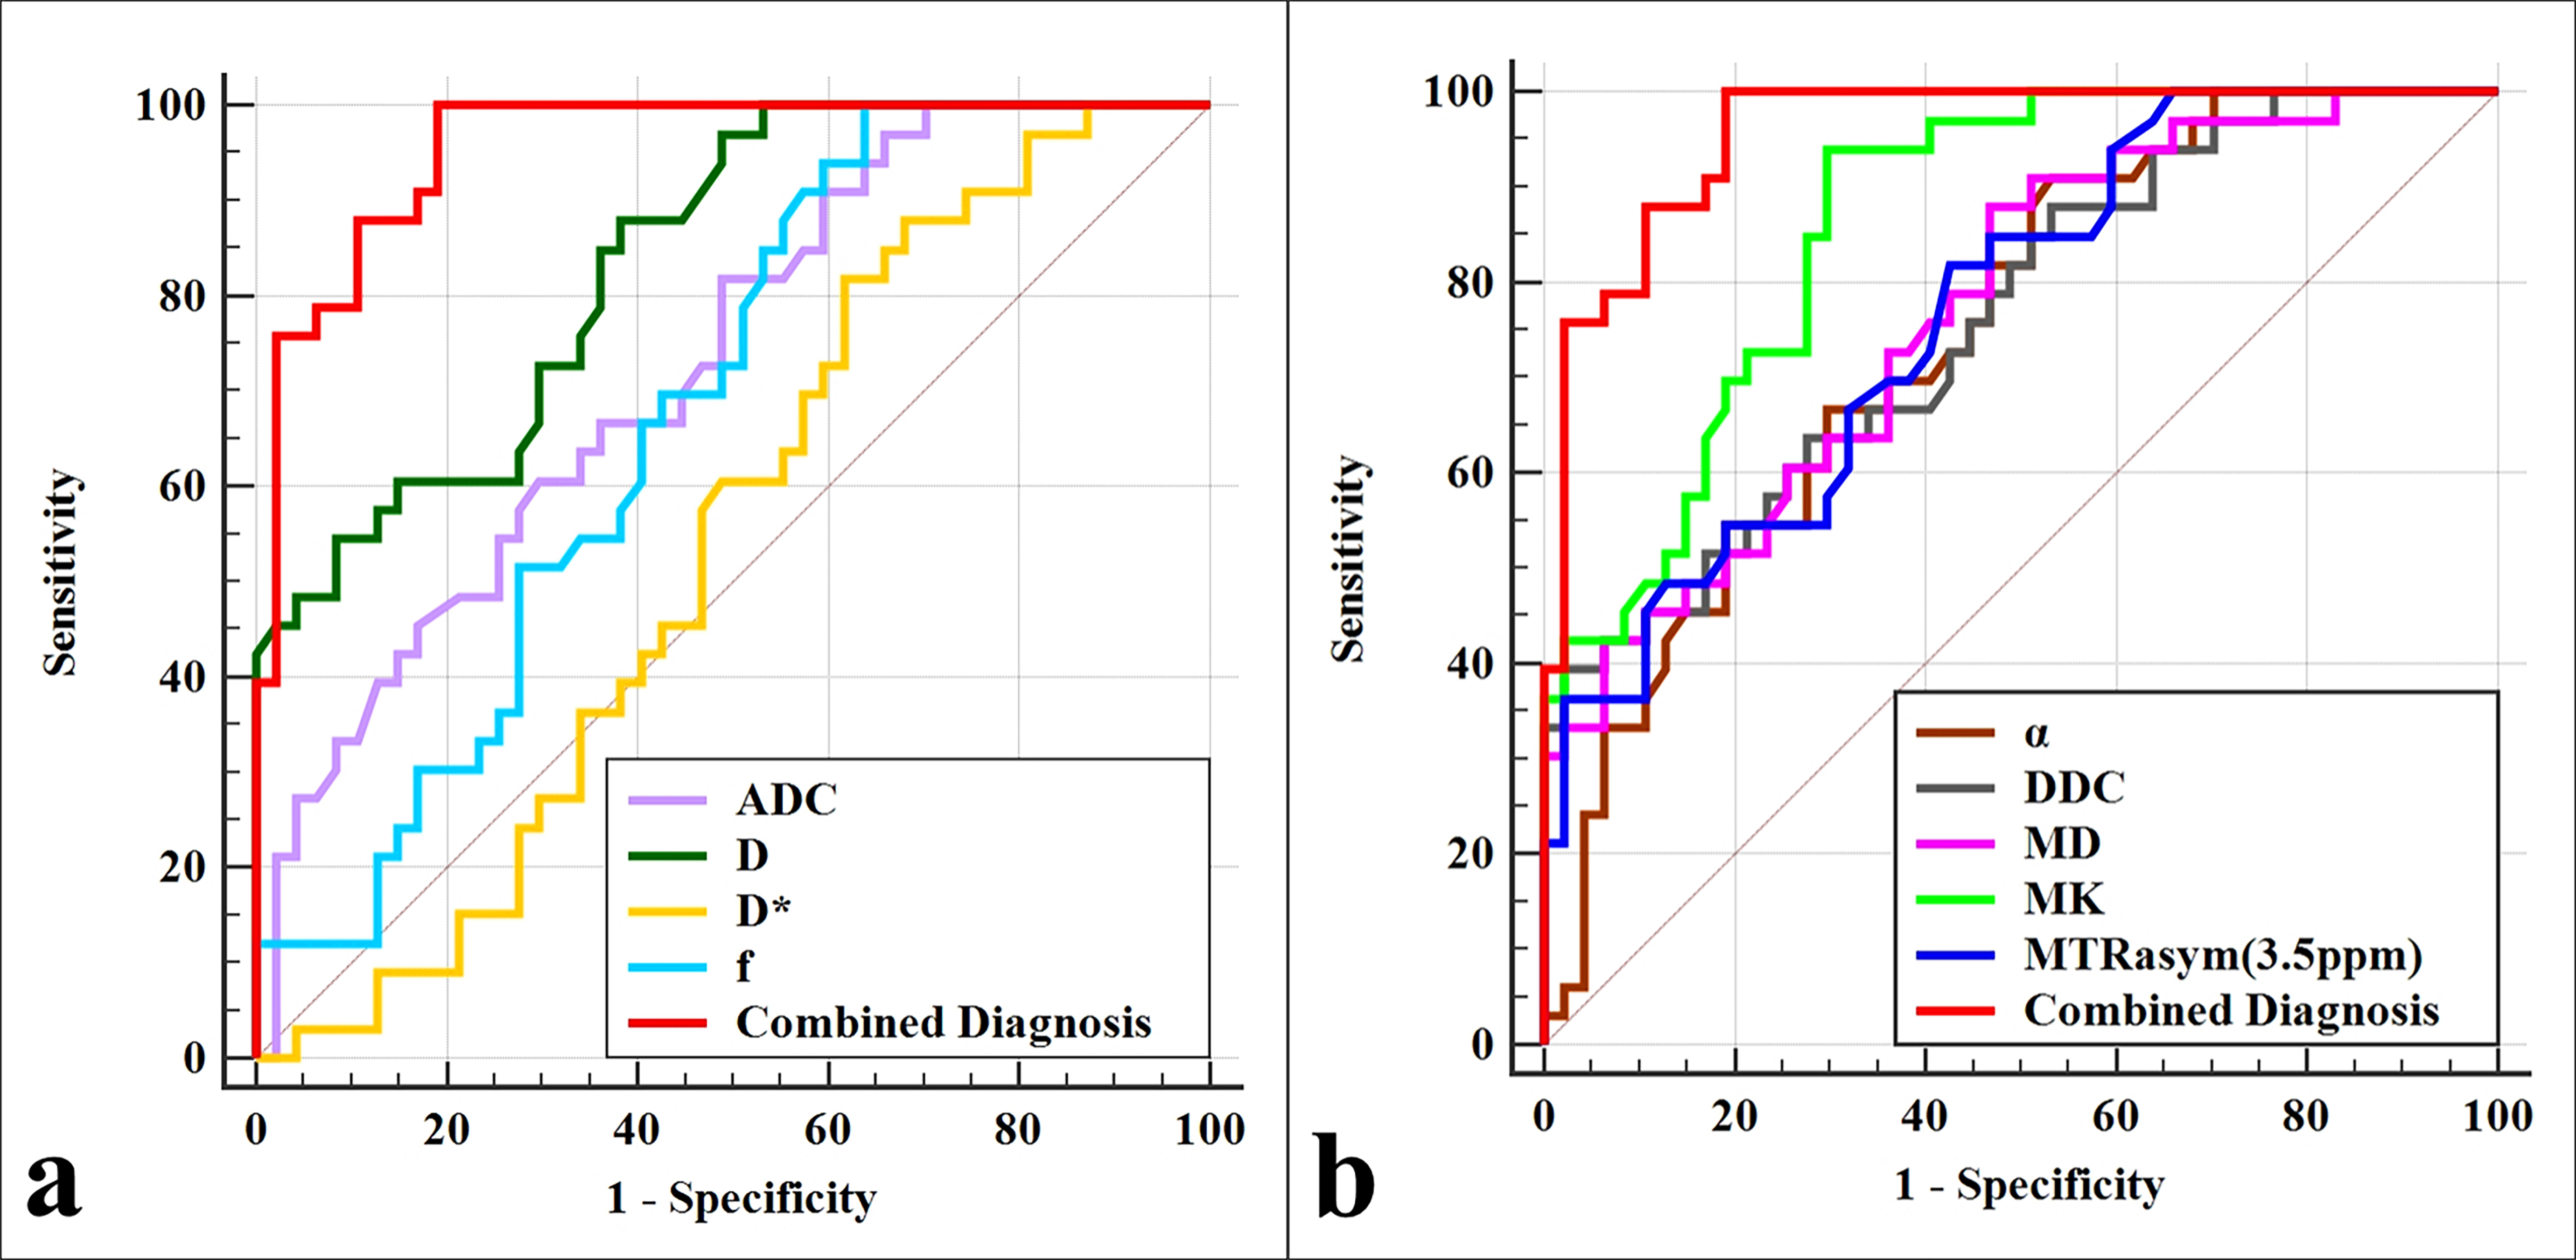
Figure.4. Curves show each individual parameter and the
combination of MTRasym (3.5 ppm), D, and MK by using ROC analysis for
differentiation of low- and non-low-risk early-stage EC.
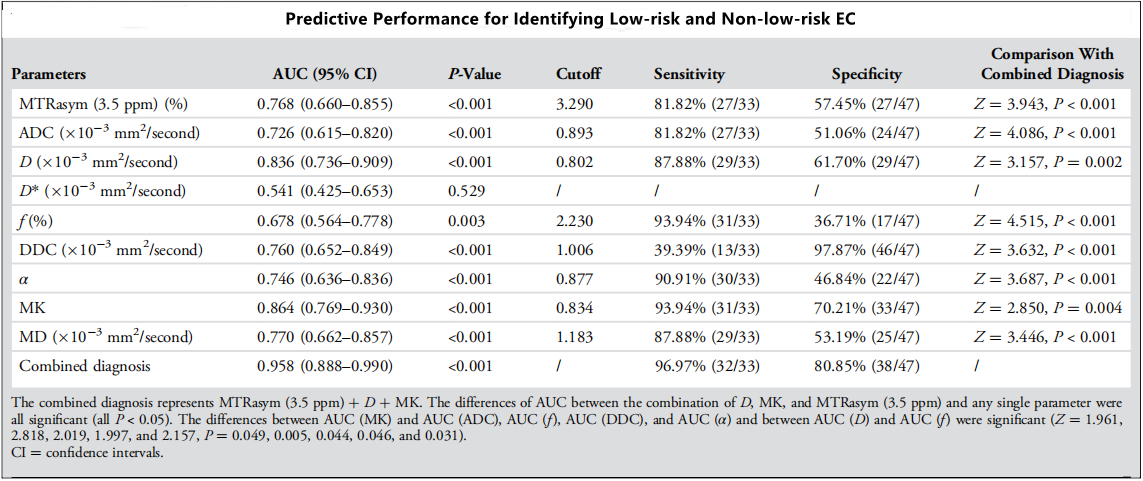
Figure.5. Predictive performance for identifying low-risk
and non-low-risk EC.
DOI: https://doi.org/10.58530/2022/0004