S4
Investigation of new assessment method for the liver magnetic resonance imaging
Yasuo Takatsu1,2, Masafumi Nakamura3, Satoshi Kobayashi4, and Tosiaki Miyati4
1Department of Radiological Technology, Faculty of Health and Welfare, Tokushima Bunri University, Sanuki-city, Japan, 2Department of System Control Engineering, Graduate School of Engineering, Tokushima Bunri University, Sanuki-city, Japan, 3Department of Radiology, Otsu City Hospital, Otsu, Japan, 4Division of Health Sciences, Graduate School of Medical Sciences, Kanazawa University, Kanazawa, Japan
1Department of Radiological Technology, Faculty of Health and Welfare, Tokushima Bunri University, Sanuki-city, Japan, 2Department of System Control Engineering, Graduate School of Engineering, Tokushima Bunri University, Sanuki-city, Japan, 3Department of Radiology, Otsu City Hospital, Otsu, Japan, 4Division of Health Sciences, Graduate School of Medical Sciences, Kanazawa University, Kanazawa, Japan
Synopsis
The hepatobiliary phase image using Gd–EOB–DTPA in the liver MRI is assessed by the quantitative liver–spleen contrast ratio (Q-LSC) , the cutoff value at which tumors can be easily determined is 1.5. However, Q-LSC is found unsuitable for cases of splenectomy and when there is splenic deposition of Gamna–Gandy bodies. Therefore, the quantitative liver-portal vein contrast ratio (Q-LPC) is useful instead of Q-LSC. The cutoff value of Q-LPC was at 1.462, the sensitivity and the specificity were higher than Q-LSC at the cutoff value. Q-LPC cutoff value can be used for hepatobiliary phase MR image evaluation.
Background
Gadolinium–ethoxybenzyl–diethylenetriamine penta-acetic acid (Gd–EOB–DTPA) has been widely used in diagnosing liver tumors in magnetic resonance imaging (MRI). Gd–EOB–DTPA is found to accumulate in the liver cells over time [1]; therefore, the contrast between the liver parenchyma and tumor is enhanced in the hepatobiliary phase (HBP). The quantitative liver–spleen contrast ratio (Q-LSC) has been well-reported as an evaluation method [2], and the cutoff value at which tumors can be easily determined is 1.5 [3]. However, Q-LSC is found unsuitable for cases of splenectomy and when there is splenic deposition of Gamna–Gandy bodies. Therefore, instead of the spleen, the contrast between the portal vein and the liver parenchyma can be measured. Referred to as the quantitative liver-portal vein contrast ratio (Q-LPC) [4], it is reported to have a high correlation with Q-LSC. [4] However, the cutoff value for Q-LPC has yet to be determined, and therefore, there is no way to assess it in HBP images.Purpose
The aim of the present study was to calculate the quantitative liver-portal vein contrast ratio (Q-LPC) cutoff value based on tumor detectability by using receiver operating characteristic curves (ROC).Methods
This study enrolled 74 patients with tumor (46 males and 28 females; age, 71.0 ± 8.1 years) who underwent liver MRI using Gd–EOB–DTPA. Some patients were found to have multiple tumors. In total, 102 tumor images were evaluated for Q-LSC and Q-LPC 10 minutes after administration of Gd–EOB–DTPA. MRI was performed using a 3-T MRI unit (Ingenia, anterior coil; Philips Medical Systems, Best, the Netherlands) with fat-saturated three-dimensional gradient echo sequences. the contrast between normal liver parenchyma and spleen [5] and normal liver parenchyma and portal vein were calculated as follows: Q-LSC = SIL/SIS, Q-LPC = SIL/SIPV, where SIL is the mean signal intensity (SI) value of the ROI for the normal liver parenchyma, SIS is the mean SI value of a homogeneous area of the spleen, and SIPV is the mean SI value of the portal vein.We compared Q-LPC with Q-LSC in order to assess its cutoff value and usefulness. ROC evaluation was performed using the 50-point continuous confidence method, with a free scale of 50 mm. A score of 30 or more out of 50 points was considered good. Cutoff values of Q-LPC and Q-LSC were then calculated. The areas under the curve (AUCs) were also examined and compared.Results
The AUC–ROC for Q-LPC was 0.858, 95% confidence interval (CI), 0.783–0.933. The cutoff value was determined to be at 1.462. Sensitivity was 0.747, and specificity was 0.852 at the cutoff value. The AUC–ROC for Q-LSC was 0.710, 95% CI, 0.597–0.822). The cutoff value was at 1.543, the sensitivity was 0.560, and the specificity was 0.778 at the cutoff value. A significant difference was noted between the AUCs (P = 0.0016). (Fig. 1)Conclusions
We conclude that Q-LPC cutoff value can be used for hepatobiliary phase magnetic resonance image evaluation.Acknowledgements
No acknowledgement found.References
[1] van Beers BE, et al. Gd-EOB-DTPA enhancement pattern of hepatocellular carcinomas in rats: comparison with Tc-99m-IDA uptake. J Magn Reson Imaging. 1994;4:351–354. [2] Motosugi U, et al. Liver parenchymal enhancement of hepatocyte-phase images in Gd-EOB-DTPA-enhanced MRImaging: which biological markers of the liverfunction affect the enhancement. J Magn Reson Imaging 2009;30:1042–1046. [3] Motosugi U, et al. Delay before the hepatocyte phase of Gd-EOB-DTPA-enhanced MR imaging: Is it possible to shorten the examination time? Eur Radiol 2009;19:2623e9. [4] Takatsu Y, et al. A novel method for evaluating enhancement using gadolinium-ethoxybenzyl-diethylenetriamine penta-acetic acid in the hepatobiliary phase of magnetic resonance imaging. Clin Imaging 2016;40:1112–1117.Figures
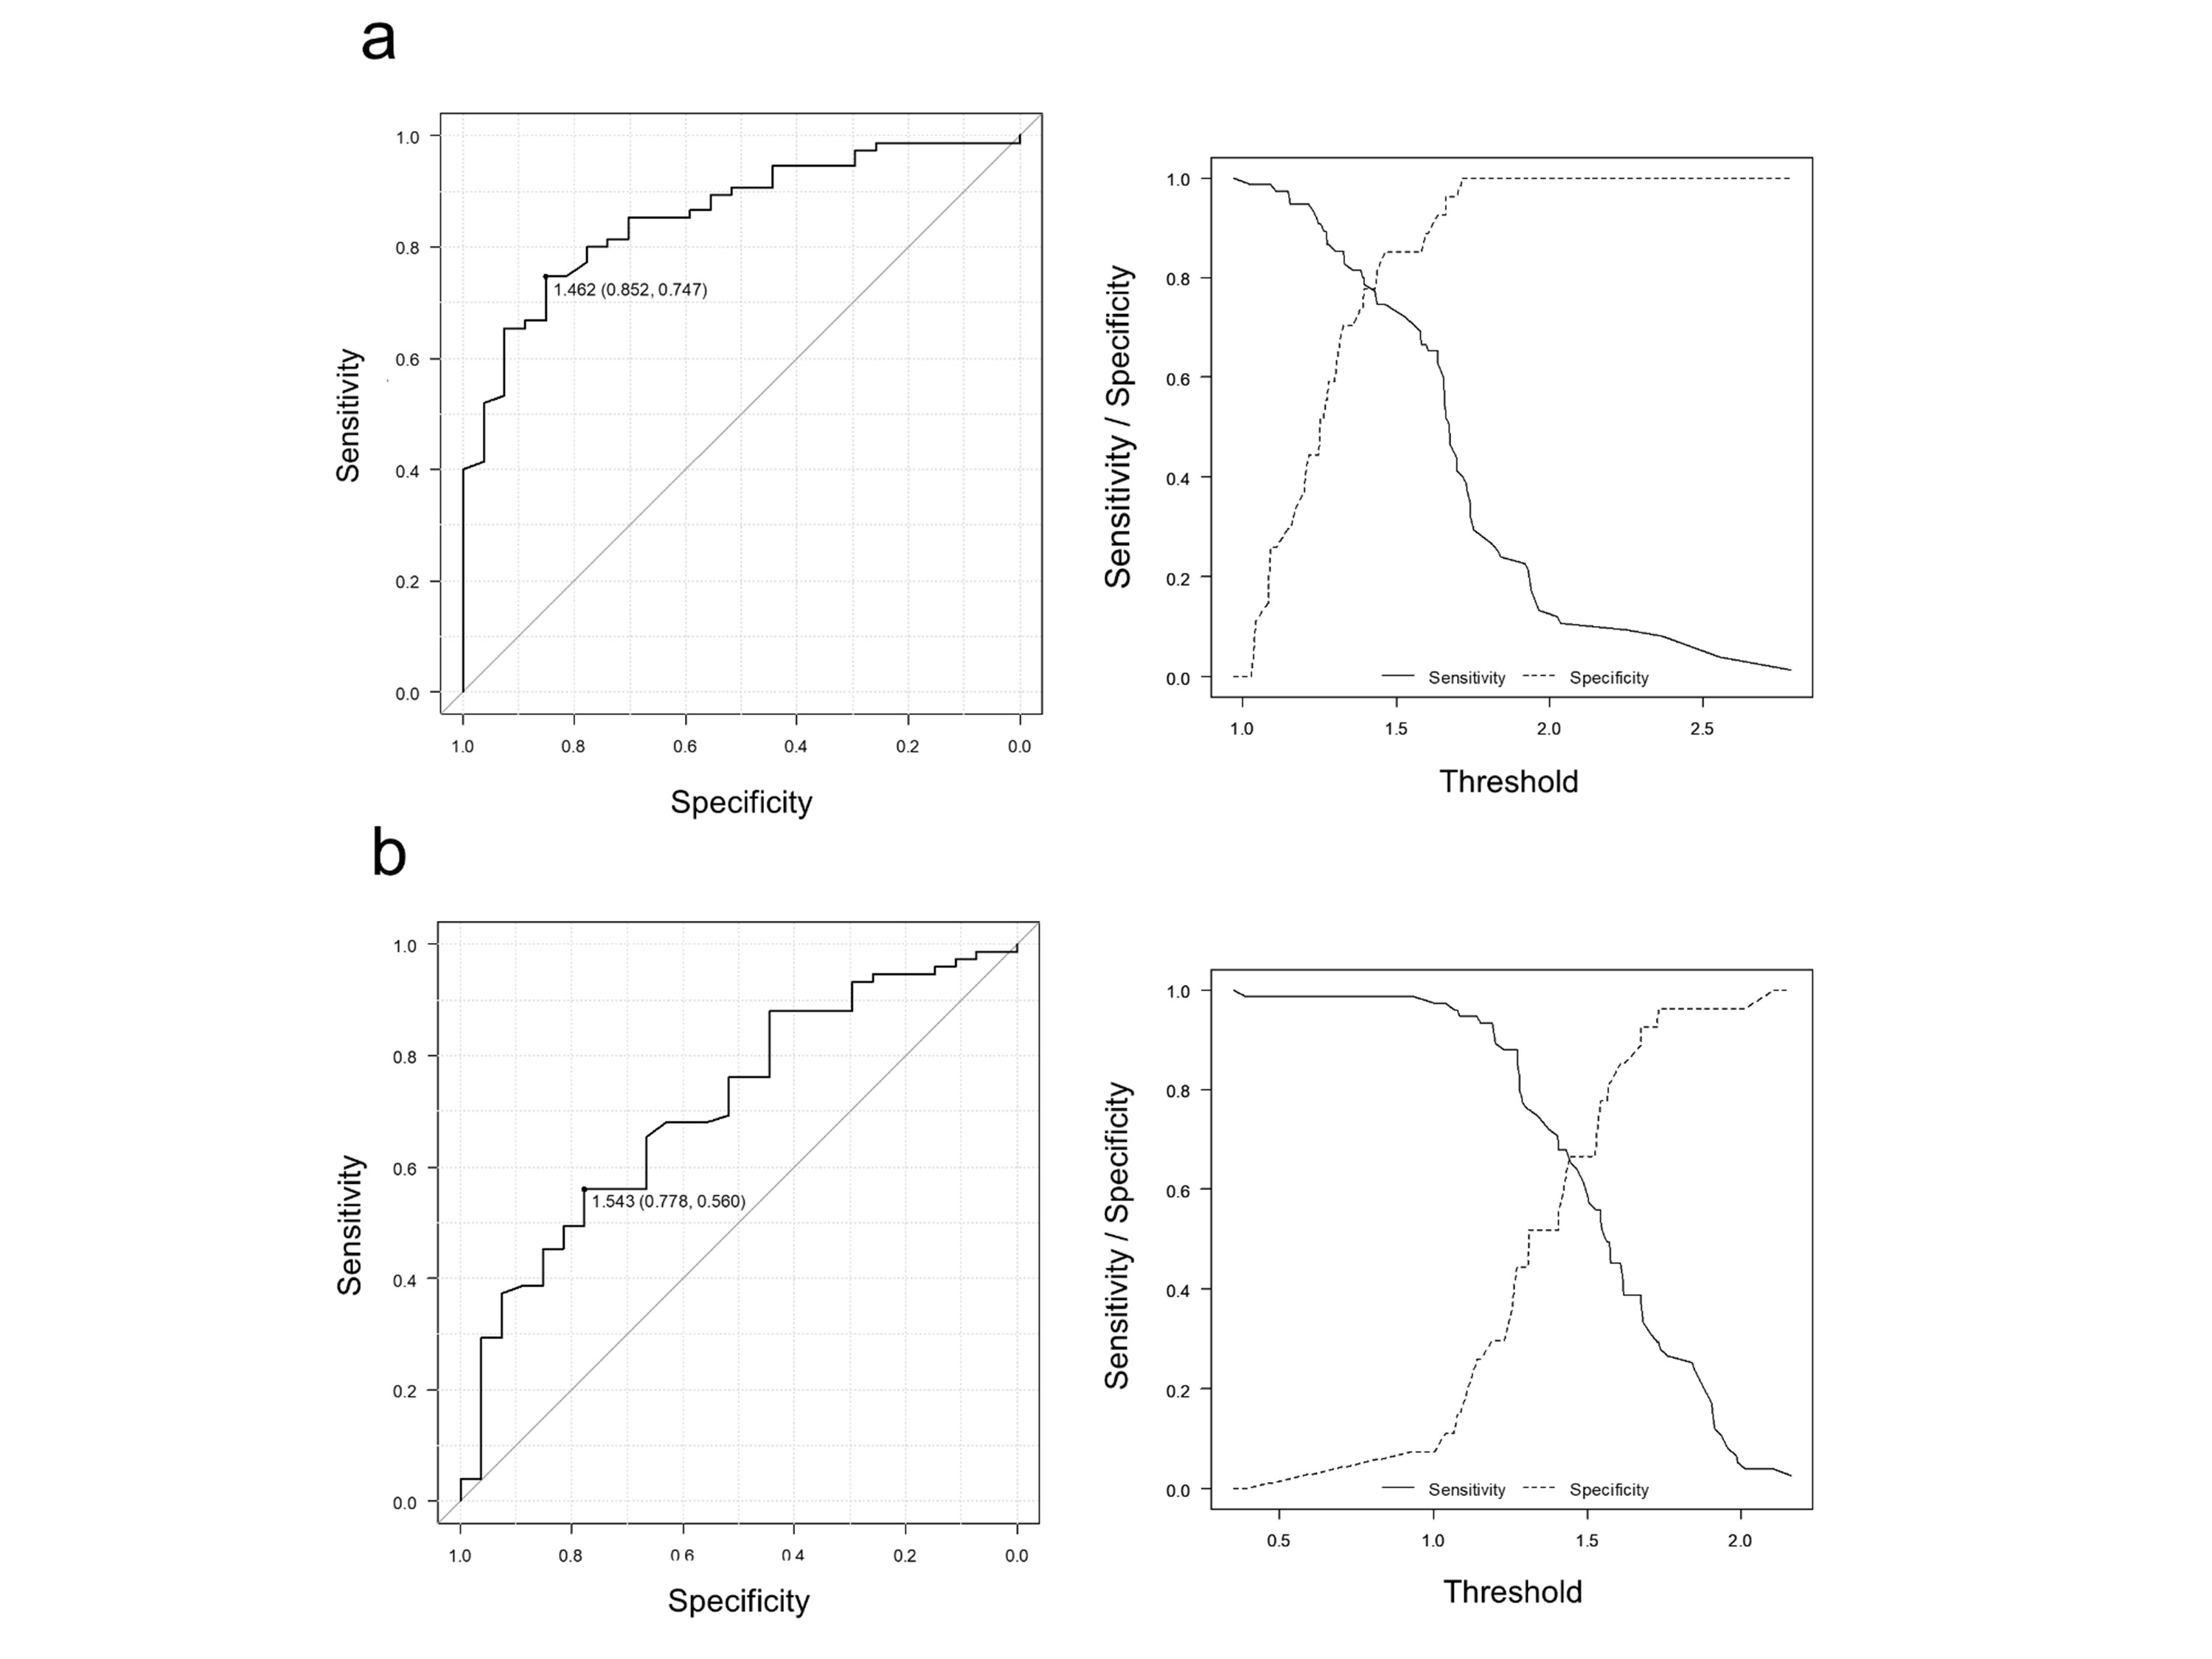
Fig. 1;
Result of ROC evaluation
(a) Q-LPC (b) Q-LSC