S39
A Single Breath-Hold Acquisition of Three-Dimensional T1 Mapping Using Look Locker sequence for Assessing Crohn Disease: A Phantom Study
Daisuke Morimoto-Ishikawa1,2, Tomoko Hyodo3, Shigeyoshi Saito2, Yu Ueda4, Masato Ohmi2, and Kazunari Ishii3
1Radiology Center, Kindai University Hospital, Osaka-Sayama, Japan, 2Department of Medical Physics and Engineering, Osaka University Graduate School of Medicine, Suita, Japan, 3Department of Radiology, Kindai University, Osaka-Sayama, Japan, 4Philips Japan, Tokyo, Japan
1Radiology Center, Kindai University Hospital, Osaka-Sayama, Japan, 2Department of Medical Physics and Engineering, Osaka University Graduate School of Medicine, Suita, Japan, 3Department of Radiology, Kindai University, Osaka-Sayama, Japan, 4Philips Japan, Tokyo, Japan
Synopsis
We investigated the single breath-hold three-dimensional (3D) Look-Locker (LL) sequence in nine different concentrations phantoms, which can be used to evaluate Crohn's disease (CD). Percentage errors between T1 relaxation time obtained by varying inversion recovery pulse interval and recovery period in the LL sequence and T1 relaxation time obtained by the Inversion Recovery sequence were calculated. With the combination of inversion recovery pulse interval of 7000ms and recovery period of 4000ms, the LL sequence can calculate T1 relaxation time within 10% percentage errors in the fastest imaging time of 21 seconds.
Introduction
Crohn disease (CD) is a chronic, relapsing inflammatory bowel disease that is characterized by transmural inflammation. Complications of chronic inflammation includes fistulae, abscesses, and intestinal strictures causing obstruction. A stricture develops due to mucosal swelling by acute inflammation or scarring by fibrosis. The distinction of the two etiologies is of critical importance for the management of CD patients. Measurement of T1 relaxation times has been applied to cardiac and liver imaging, and enables detection and quantification of fibrosis, without contrast enhancement 1-3. The wall of small bowel and colon have longer T1 relaxation times than the other abdominal organs 4. For good accuracy over long or wide range of T1 relaxation times, optimal sampling points by constant application of the radiofrequency (RF) pulses and a long enough time to free relaxation are needed after inversion pulse 5. However, it is difficult to set up a single breath-hold data acquisition. The purpose of this study was to explore the optimal imaging parameter for the 3D LL sequence, which can measure T1 relaxation times within a single breath-hold for the evaluation of intestinal fibrosis.Methods
All examinations were performed on a 1.5T unit (Achieva dStream, Philips Healthcare, Best, The Netherlands). The phantom consisted of nine cylindrical sample bottles filled with water and varying concentrations of agar (0-2%) and meglumine gadoterate (0.005-0.09 mM) solutions. The 3D LL sequence was acquired twice by varying two parameters; inversion recovery pulse interval (3000-10000 msec) and recovery period (i.e., time to free relaxation after constant application of the RF pulses, 1000-9000 msec) . To validate the T1 relaxation times resulting from the 3D LL sequence, we applied standard inversion recovery method to the phantom. To examine the accuracy of the T1 relaxation times obtained by using the 3D LL sequence, we obtained the T1 relaxation times from the inversion recovery method measurements as the reference value and calculated the percentage errors.Results
T1 relaxation times measured using the inversion recovery method were summarized in Figure 1. The percentage errors of the 3D LL sequence were less than ±10 % in the following combinations: (inversion recovery pulse interval,recovery period)=(7000, 4000), (8000, 4000), (9000, 4000), (9000, 5000), (10000, 5000), and (10000, 6000), whose acquisition times were 21, 24, 27, 27, 30, and 30msec, respectively. Figure 2 shows the percentage errors at each recovery period with fixed inversion recovery pulse interval of 7000ms, in which the combination (7000, 4000 [acquisition time, 21 sec]) demonstrates error rate less than 10%. The 3D LL sequence tended to overestimate (maximum error rate, 55.5%) when the recovery period was short and underestimate (minimum error rate, -116.3%) when the recovery period was long.Conclusion
Measurement of the T1 relaxation times using the 3D LL sequence can be performed with an error rate of ±10% with the shortest imaging time of 21sec using a combination of the inversion recovery pulse interval of 7000ms and the recovery period of 4000msec.Acknowledgements
No acknowledgement found.References
- Bulluck H, Maestrini V, Rosmini S, et al. Myocardial T1 mapping. Circ J 2015;79(3):487-494.
- Li Z, Sun J, Hu X, et al. Assessment of liver fibrosis by variable flip angle T1 mapping at 3.0T. Journal of magnetic resonance imaging : JMRI 2016;43(3):698-703.
- Banerjee R, Pavlides M, Tunnicliffe EM, et al. Multiparametric magnetic resonance for the non-invasive diagnosis of liver disease. J Hepatol 2014;60(1):69-77.
- Verena Carola Obmann, Nicole Seyfried, Wei-Ching Lo, et al. Utility of simultaneous T1 and T2 mapping with MR Fingerprinting (MRF) for bowel wall imaging in Crohn’s Disease. Proceedings of the 29th Annual Meeting of ISMRM 2020 #0709.
- Maehara M, Monma M, Nitanai T, Matsumoto T, Fukuma Y. Optimization of Look-Locker Turbo-Field Echo-Planar Imaging and Evaluation of Its Accuracy in Head and Neck 3D T1 Mapping. Magn Reson Med Sci 2016;15(3):288-298.
Figures
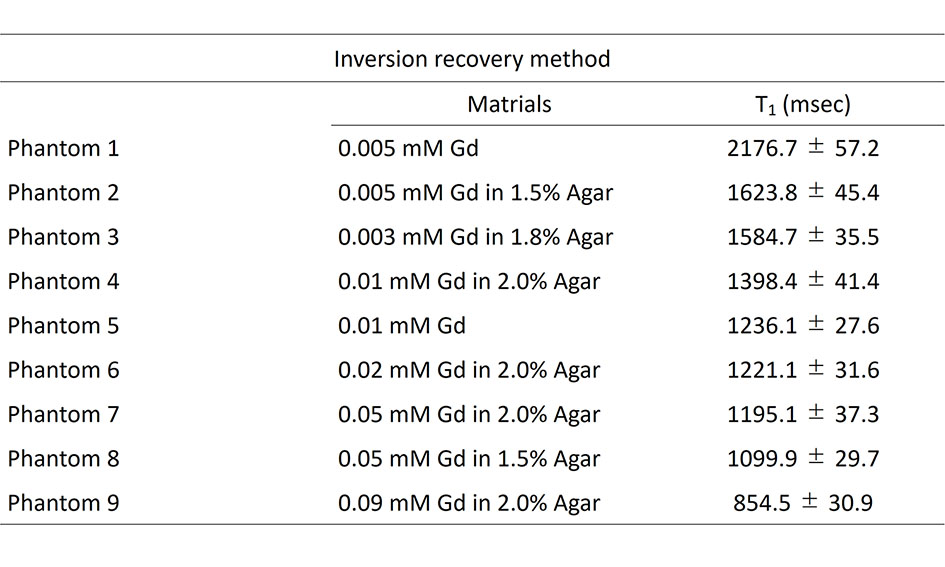
Table 1: Material composition of the phantoms and the respective reference T1 relaxation times obtained by inversion recovery method. Values are means ± standard deviations of T1 relaxation times.
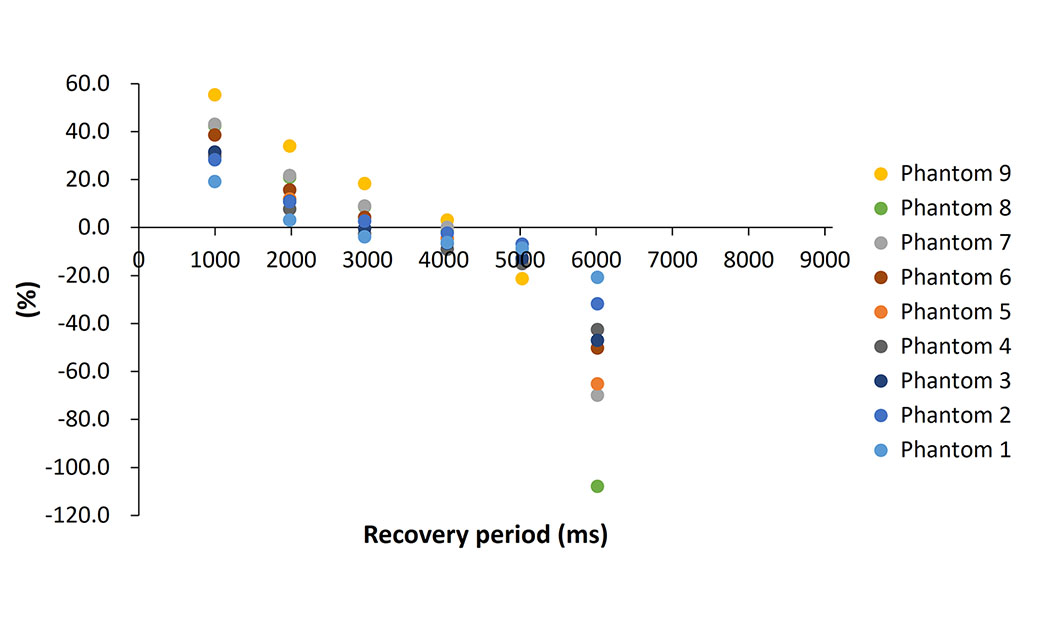
Figure 2: The percentage errors at each recovery period with fixed inversion recovery pulse interval of 7000ms