S34
Effects of image quality deterioration and data shortage on automatic white matter bundle segmentation by diffusion magnetic resonance imaging1Department of Radiology, THe University of Tokyo Hospital, Tokyo, Japan
Synopsis
We investigated the effect of image quality deterioration and data shortage of DWI on automatic white matter bundle segmentation. We set the gold standard (GS) data without SMS and MPG = 64 axes. Two kinds of comparisons were made in comparison with GS data. The one was with/without the SMS, and the other eliminated some acquired data from GS. We analyze the data only from the first 8, 16, 32 and 48 axes of MPG in the GS. There was almost no difference between SMS of 2 and 3. For MPG, 16 axes provided results comparable to the GS.
Purpose
In recent years, the number of research and clinical reports that combine magnetic resonance imaging (MRI) and artificial intelligence has been increasing. One approach involves automatic white matter bundle segmentation software (Tractseg) that uses data from the human connectome project. We investigated the effects of Simultaneous Multi Slice (SMS) technique, which is used as a time-saving tool in clinical practice, on image quality deterioration and data shortage (examination interruption) in white matter bundle depiction.Subjects and Methods
The subjects were 7 healthy men (average age; 29.57 years old). We used a Siemens 3.0 Tesla MRI MAGNETOM Skyra VE11 system and a 32-channel head coil. The parameters for the gold standard (GS) condition were as follows: SMS factor = 1 (no SMS), GRAPPA factor = 2, b-value = 3000 s/mm2, motion probing gradient (MPG) = 64 axes and b0 image = 1, phase encoding direction= anterior-posterior, field of view = 240×240 mm, 60 sections, slice gap = 0, slice thickness = 2.5 mm, matrix = 96×96 (2.5 mm isotropic voxel size), repetition time (TR)/echo time (TE) = 8900/103 ms, NEX = 1, and scan time = 625 s. Data were obtained with other SMS factors as well (SMS factors of 2, 3, and 4), using a TR of 5300 ms and scan time of 372 s. For distortion correction, we added a b0 image whose phase encoding direction was posterior-anterior for each condition. As part of preprocessing, denoise and Gibbs artifact removal were performed using MRtrix3 and distortion correction was performed using FSL ver.5.0.9 (top up and eddy). Bias correction with MRtrix3 was applied to the correction data. The target fibers were the 21 bundles (arcuate fasciculus, corpus callosum, corticospinal tract, inferior frontal occipital fasciculus, optic radiation, superior longitudinal fasciculus I-Ⅲ, cingulum, uncinated fasciculus, and left and right fiber bundles, except corpus callosum), used in preoperative neurosurgery planning at our hospital. Two kinds of comparisons were made in comparison with GS data. The one was with/without the SMS, and the other eliminated some acquired data from GS data. We extract and analyze the data only from the first 8, 16, 32 and 48 axes of MPG in the GS data. The evaluation method involved volume comparison and the DICE coefficient of each fiber bundle drawn from the GS and each condition.Results
In the SMS comparison, the average ratios of depicted voxels for SMS groups was almost the same (Fig.1), with a minimum of 96.5% (SMS factor = 2, left optic radiation) and a maximum of 104.0% (SMS factor = 4, left pyramidal tract) in comparison with the GS data. The average DICE coefficients were 0.869, 0.874, and 0.854 for SMS factors of 2, 3, and 4, respectively. The DICE coefficient was not significantly different after Bonferroni correction in all nerve fiber bundles between SMS factors of 2–3 and 2–4, but there were significant differences in 4 bundles (left arcuate fasciculus, left inferior frontal and occipital fasciculus, left cingulum, and left uncinated fasciculus) between SMS factors of 3–4. In the MPG number comparison, the average number of depicted voxels tended to increase as the number of MPG increased (Fig.2), and the average ratios of depicted voxelsnumbers were as follows: 48 axes, 100.1%; 32 axes, 99.7%; 16 axes, 96.9%; and 8 axes, 95.4%, in comparison with the GS. The average DICE coefficient decreased as follows: 48 axes, 0.965; 32 axes, 0.958; 16 axes, 0.938; and 8 axes, 0.894. As a result of multiple comparisons of the average DICE coefficient under each MPG condition, there was a significant difference among all the conditions. Fiber bundles different from anatomical topology were not visually observed under any conditions (Fig.3, Fig.4).Discussion
Regarding the combined use of SMS, it was considered that there was almost no effect between SMS factors of 2 and 3. There was almost no difference in the depicted volume, and the DICE coefficient showed a high degree of overlap, but it was suggested that it might affect the depicting result when an SMS factor of 4 is used according to the results of the statistical test. There was a significant difference in the DICE coefficient in the MPG condition comparison. It showed that it is better to have a large amount of imaging data for the fiber bundle segmentation and calculation of the fibre orientation distribution. However, with 16 axes or more, the average depiction volume difference with respect to GS was 3% or less, and the DICE coefficient was 0.938 or more, which was high. Therefore, it was thought that the number of MPGs would be comparable to that for the GS, even with about 16 axes. It was suggested that the imaging time could be shortened by using an SMS factor of 2 or 3, or reducing the number of MPGs. Especially for MPG, it was suggested that the data equivalent to GS could be obtained even with the data for which the examination was abandoned in about 3 minutes (MPG = 16 axes).Conclusion
There was almost no difference in bundle segmentation ability between SMS factors of 2 and 3. With regard to MPG, 16 axes provided results comparable to the GS data (64 axes).Acknowledgements
This study was supported by Grants-in-Aid for Scientific Research (20K08016).References
1) CGB Yogananda, et al. A novel fully automated MRI-based deep-learning method for classification of IDH mutation status in brain gliomas. Neuro Oncol, 2020 Mar 5;22(3):402-411.
2) T Sichtermann, et al. Deep Learning–Based Detection of Intracranial Aneurysms in 3D TOF-MRA. AJNR Am J Neuroradiol, 2019 Jan;40(1):25-32.
3) E Gong, et al. Deep learning enables reduced gadolinium dose for contrast-enhanced brain MRI. J Magn Reson Imaging, 2018 Aug;48(2):330-340.
4) M Kidoh, et al. Deep Learning Based Noise Reduction for Brain MR Imaging: Tests on Phantoms and Healthy Volunteers. Magn Reson Med Sci, 2020: 19(3):195-206.
5) J Wasserthal, et al. TractSeg - Fast and accurate white matter tract segmentation. NeuroImage, 2018: 183:239-253.
6) J Tournier, et al. MRtrix3: A fast, flexible and open software framework for medical image processing and visualisation. NeuroImage, 2019: 202:116137
7) S.M. Smith, et al. Advances in functional and structural MR image analysis and implementation as FSL. NeuroImage. 2004: 23(S1):208-219.
8) J Veraart, et al. Diffusion MRI noise mapping using random matrix theory. Magn. Res. Med, 2016: 76(5):1582–1593.
9) J Veraart, et al. Denoising of diffusion MRI using random matrix theory. NeuroImage. 2016: 142:394–406.
10) L Cordero-Grande, et al. Complex diffusion-weighted image estimation via matrix recovery under general noise models. NeuroImage. 2019: 200: 391-404.
11) E Kellner, et al. Gibbs-ringing artifact removal based on local subvoxel-shifts. Magn Reson Med. 2016: 76:1574–1581.
12) J Tournier, et al. MRtrix3: A fast, flexible and open software framework for medical image processing and visualisation. NeuroImage. 2019: 202: 116137.
13) J.L.R. Andersson, et al. How to correct susceptibility distortions in spin-echo echo-planar images: application to diffusion tensor imaging. NeuroImage. 2003: 20(2):870-888.
14) N Tustison, et al. N4ITK: Improved N3 Bias Correction. IEEE Transactions on Medical Imaging. 2010: 29:1310-1320.
15) M Dayan, et al. Tractography of the optic radiation: a repeatability and reproducibility study. NMR Biomed. 2015 Apr;28(4):423-431.
16) J.-D. Tournier, et al. Robust determination of the fibre orientation distribution in diffusion MRI: non-negativity constrained super-resolved spherical deconvolution. Neuroimage, 2007: 35:1459–72.
Figures
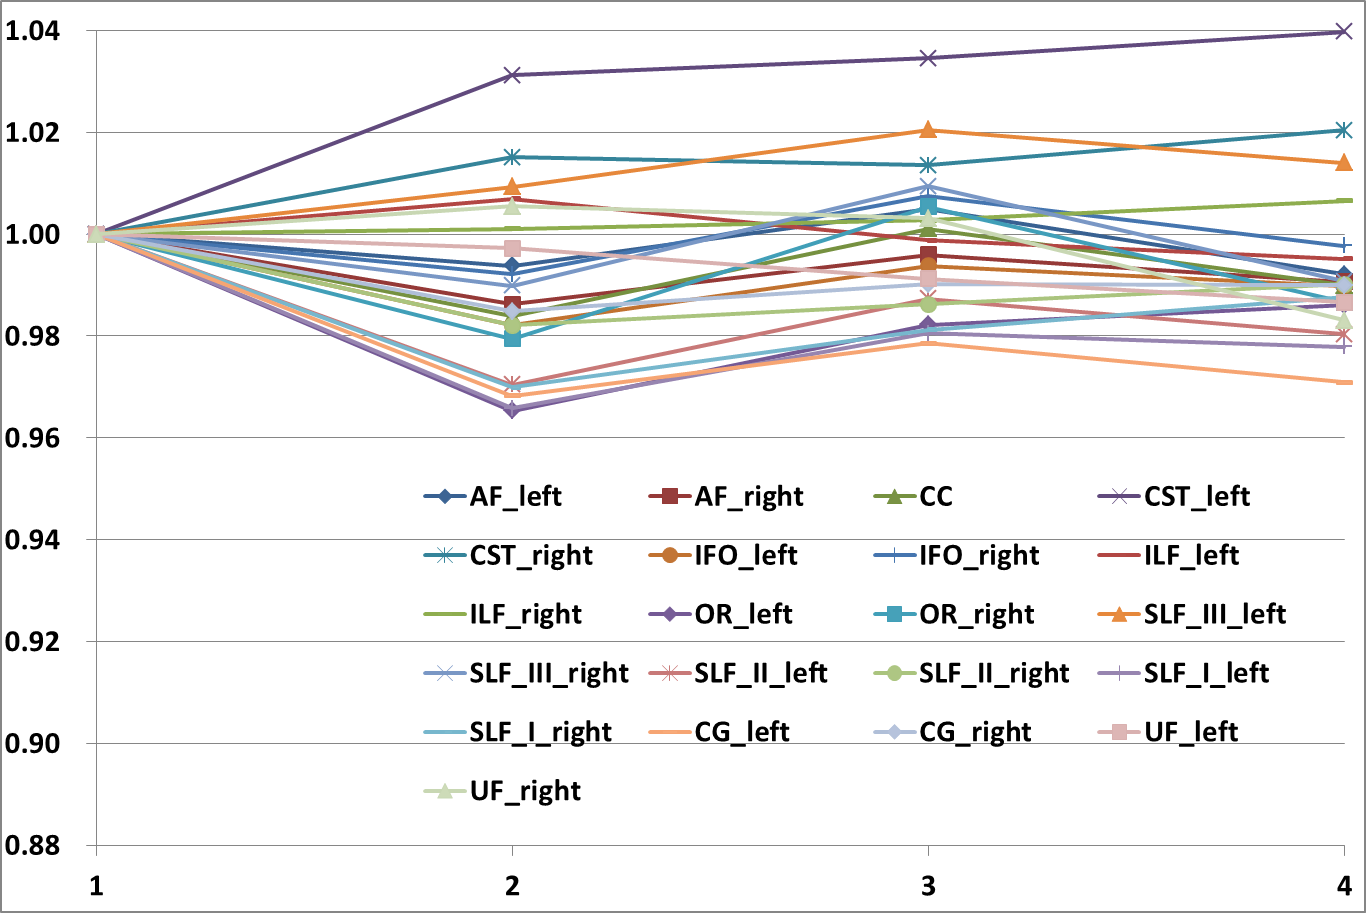
Fig.1.
The results of SMS comparison
In the MPG number comparison, the average number of depicted voxels tended to increase as the number of MPG increased. However, UF and CG was different from the trend.
X unit indicates SMS factor, Y unit indicates the ratios of depicted voxels relative to GS data.
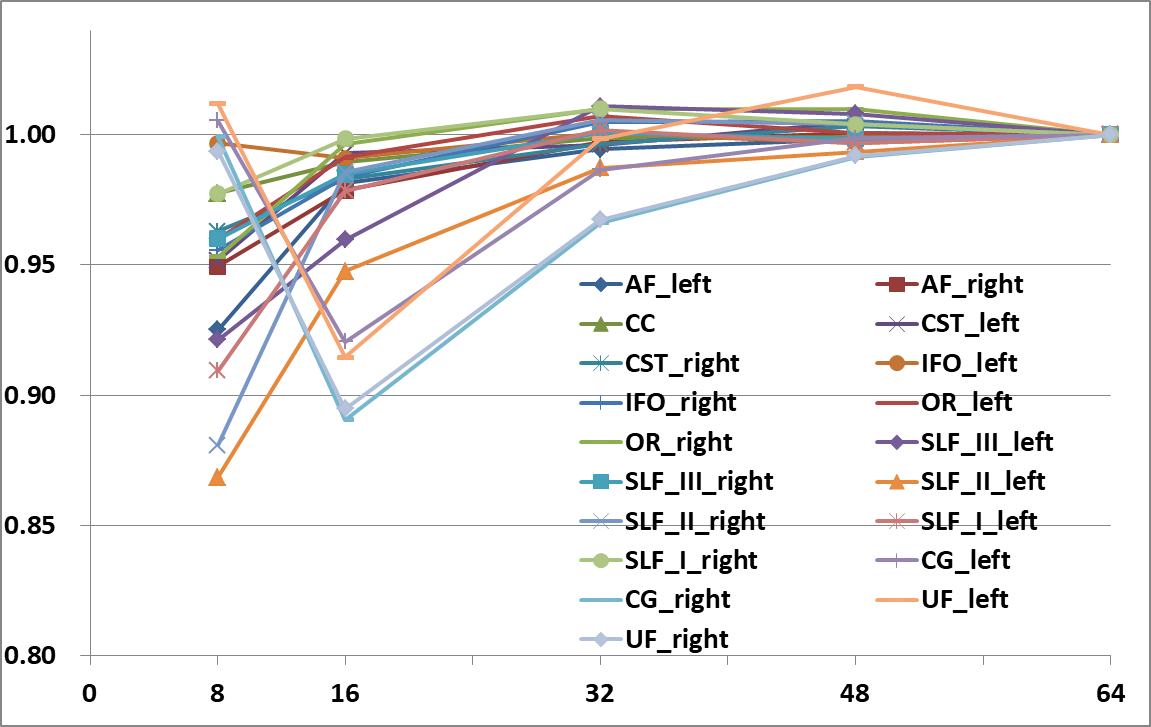
Fig.2. The results of MPG number comparison
In the MPG number comparison, the average number of depicted voxels tended to increase as the number of MPG increased. However, UF and CG was different from the trend.
X unit indicates MPG directions, Y unit indicates the ratios of depicted voxels relative to GS data.
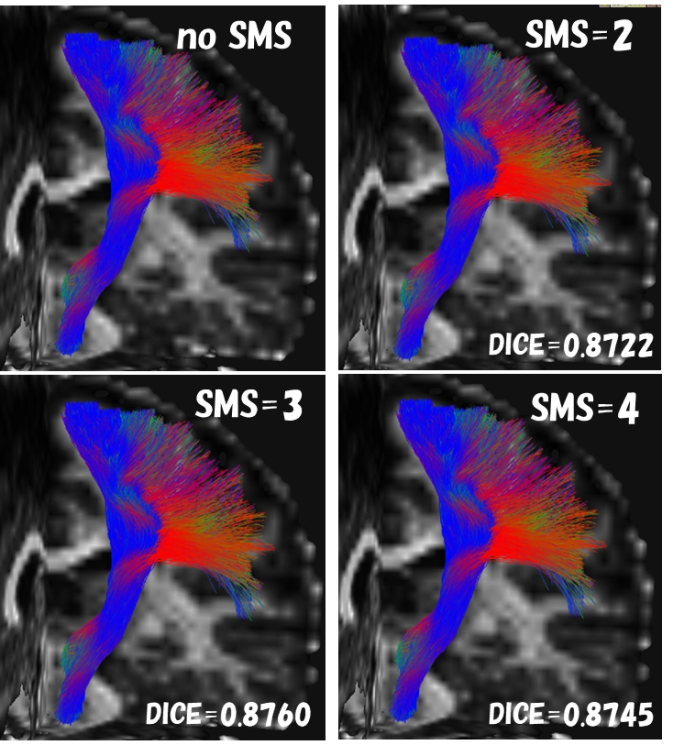
Fig.3. The left pyramidal tract (example) images of SMS comparison
Fiber bundles different from anatomical running were not visually observed under any conditions.
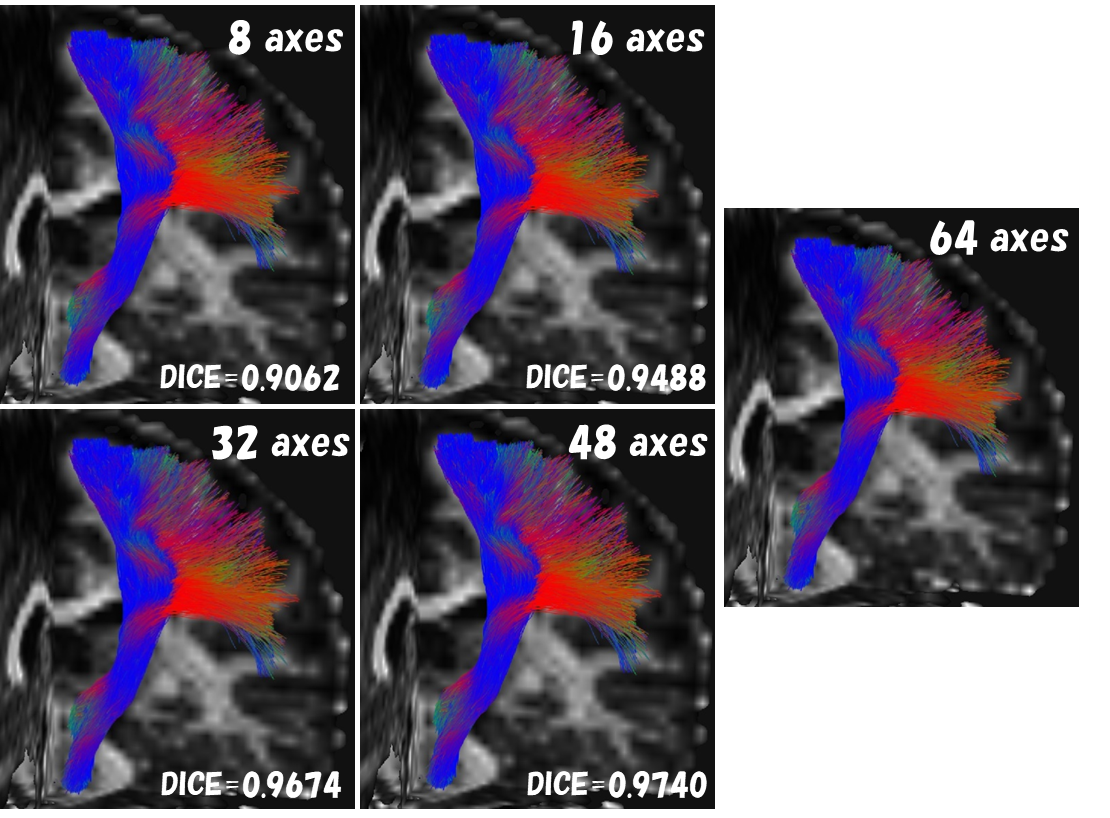
Fig.4. The left pyramidal tract (example) images of MPG comparison
Fiber bundles different from anatomical running were not visually observed under any conditions as well as SMS comparison.