S31
Comparison of cardiac T1 mapping on a high-performance 0.55T scanner and a conventional 1.5T scanner1NHLBI, National Institutes of Health, Bethesda, MD, United States
Synopsis
This abstract is a comparison of native and post contrast T1 mapping and ECV of the myocardium using a conventional 1.5T scanner and a high-performance 0.55T scanner.
Background
Myocardial T1 mapping can be used to assess multiple disease states of the heart. [1] With the administration of a gadolinium-based contrast agent, extracellular volume (ECV) is also a useful tool for evaluating diffuse or focal fibrosis, myocarditis and cardiomyopathy that may be difficult to detect with late gadolinium enhancement (LGE) alone. Native T1 mapping can vary across different magnetic field strengths of scanners. We seek to evaluate T1 mapping of the myocardium pre and post contrast, as well as ECV, on a high-performance 0.55T MRI scanner compared to a 1.5T scanner in healthy volunteers and patients with known cardiovascular diseases.Methods
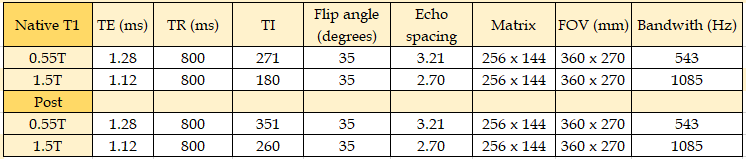
Myocardial T1 mapping was performed on a mixed group of 27 subjects (22 men, mean age = 56 +/- 16 years). In each study participant, T1 mapping was performed on a conventional 1.5T MR scanner (MAGNETOM Aera, Siemens AG, Erlangen, Germany) and a commercial 1.5T MRI system modified to operate at 0.55T (prototype MAGNETOM Aera, Siemens AG, Erlangen, Germany). The prototype 0.55T MRI system maintained high-performance hardware and advanced imaging methods capable of fast T1 mapping pulse sequences. Each subject received a0.15 mmol/kg dose of gadobutrol during each MRI exam, and both native T1 and post-contrast T1 were measured. The T1 mapping used a single breath hold MOdified Look-Locker Inversion Recovery (MOLLI) sequence on both systems.[2] A 5s(3s)3s scheme (2 inversions with acquisition of images for 5 seconds, recovery for 3 seconds and the second acquisition for 3 seconds) was used for native T1 imaging for both systems. The post contrast T1 sequence used 4s(1s)3(1s). Acquisition parameters are provided in Table 1. The imaging was performed using a 6-channel body phased-array coil and an 18-channel spine coil on the prototype 0.55T system, while the conventional system used an 18-channel body phased array coil and a 32-channel spine coil. Regions of interest (ROI) were drawn on the T1 maps in the myocardium and the blood pool of the left ventricle using similar locations and sizes pre and post contrast injection for both the 0.55T and 1.5T scanners. In patients with chronic MI, ROIs in both normal (remote) myocardium and infarct were used, to compare elevated ECV between field strengths.Results
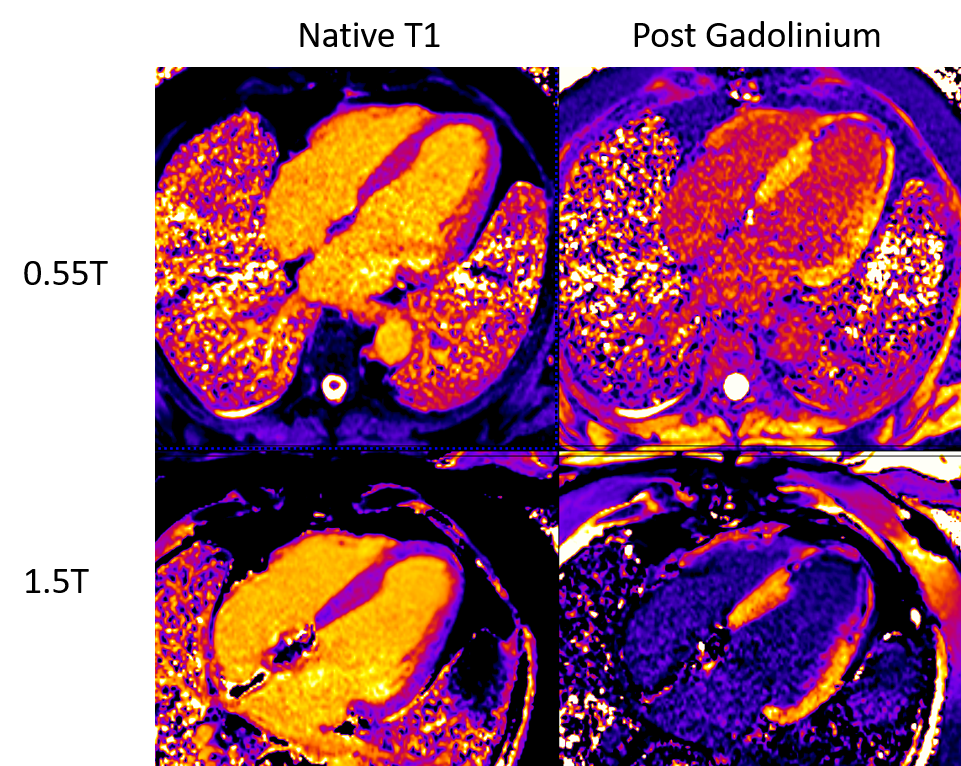
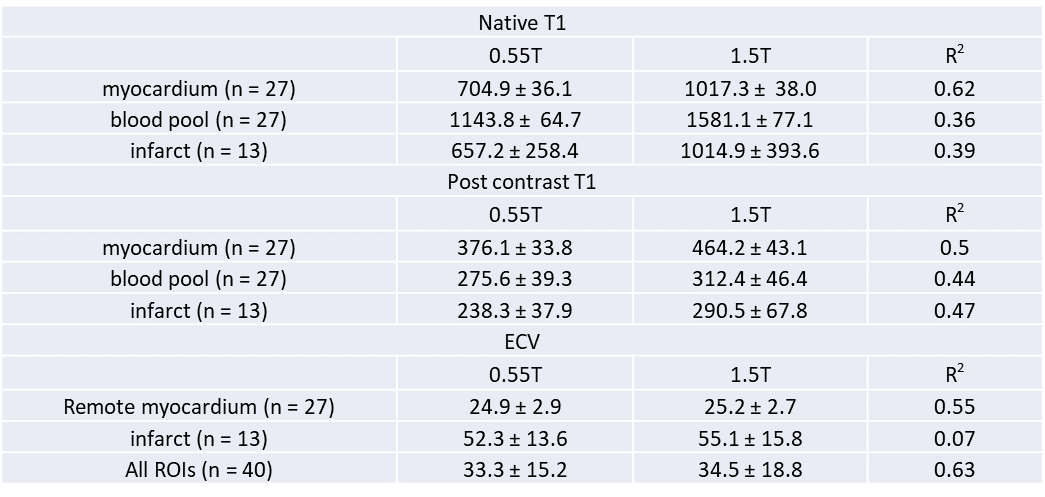
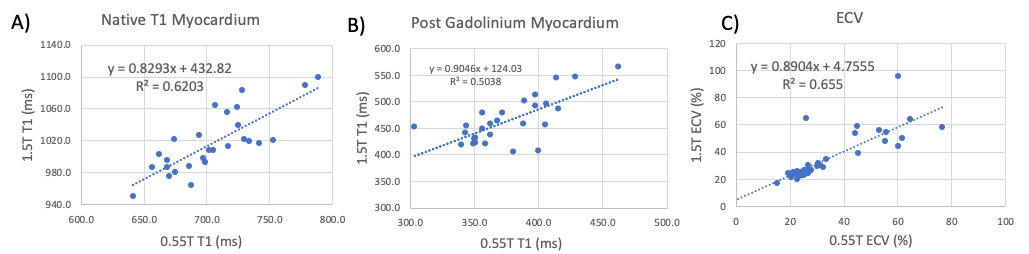
The study population was comprised of healthy volunteers (2), myocardial infarction (MI) (chronic 13, acute 1) cardiomyopathy (3), arrhythmic disease with CIEDs (2), aorta pathology (3) and recovered COVID-19 infection (3). Figure 1 provides example native T1 maps and post-contrast T1 maps from 0.55T and 1.5T, illustrating reasonable image quality at both field strengths. Table 2 provides measured T1 values, and correlation coefficients (R2) for all comparisons. Native T1 was shorter at 0.55T, as expected, but with a strong correlation between 0.55T and 1.5T (R2 = 0.62). The ECV had a strong correlation between 0.55T and 1.5T (R2 = 0.63 for all ROIs). Most subjects demonstrated ECV within the normal range, with the exception of chronic MI regions, which had elevated ECV at both 0.55T and 1.5T. Example correlation plots are provided in Figure 2.Discussion
Pre- and post-contrast T1 mapping is feasible at a 0.55T field strength with good correlation to comparable measurements performed at a 1.5T field strength. As expected, at 0.55T, native T1 values are shorter compared to T1 values at 1.5T with a 31% mean decrease in native myocardial T1 at the lower field strength.[3] Blood pool native T1 values decreased by 28% at 0.55T. ECVs also showed a strong correlation between field strengths in this small patient cohort. The presence of lipomatous metaplasia within the core of some of the infarctions may account for the lower value of the MI’s compared to normal myocardium. Due to the lower signal-to-noise ratio at 0.55T, the precision of quantitative measurements may decrease. Demonstration of reproducible T1 measurements of the myocardial at 0.55T helps lend support toward applicability of high-performance low-field scanners in evaluating the biology of myocardial diseases. Additional work examining abnormal myocardial states including MI with and without fat is needed to further validate the technique at 0.55T.Acknowledgements
The authors would like to acknowledge the assistance of Siemens Healthcare in the modification of the MRI system for operation at 0.55T under an existing cooperative research agreement (CRADA) between NHLBI and Siemens Healthcare.References
[1]Kellman P and Hansen MS, T1-mapping in the heart: accuracy and precision, Journal of Cardiovascular Magnetic Resonance 2014, 16:2 http://jcmr-online.com/content/16/1/2
[2] Kellman P, Wilson JR, Xue H, Ugander M, Arai AE. Extracellular volume mapping in the myocardium, part 1: evaluation of an automated method, Journal of Cardiovascular Magnetic Resonance, 2012, 14:63 http://www.jcmr-online.com/content/14/1/63
[3] Campbell-Washburn AE, Ramasawmy R, Restivo MC, et al. Opportunities in Interventional and Diagnostic Imaging by Using High-Performance Low-Field-Strength MRI. Radiology 2019; 293:384-393
Figures