S21
Compressed Sensing for Turbo Spin-echo Diffusion-weighted Imaging: Influence of Denoising Level on the Signal Intensity and Apparent Diffusion Coefficient Values in Cervical Cancer
Yuichiro Somiya1, Yoshiko Ueno2, Shintaro Horii1, Ryuji Shimada1, Keitaro Sofue2, Naoki Yoshida1, Wakiko Tani1, Akiko Kusaka1, and Takamichi Murakami2
1Center of Radiology and Radiation Oncology, kobe university hospital, kobe, Japan, 2Department of Radiology, Kobe University Graduate School of Medicine, kobe, Japan
1Center of Radiology and Radiation Oncology, kobe university hospital, kobe, Japan, 2Department of Radiology, Kobe University Graduate School of Medicine, kobe, Japan
Synopsis
This study evaluated the effect of denoising level on signal intensity (SI) and apparent diffusion coefficient (ADC) values of diffusion-weighted imaging using the single-shot turbo spin-echo sequence (TSE-DWI) with compressed sensing (CS) in cervical cancer. As the denoising level increased, the SI of cervical cancer tended to decrease, and the ADC values tended to increase on TSE-DWI with CS. Nevertheless, at each denoising level, the ADC values of cervical cancer were significantly lower than those of normal uterine cervix.
Introduction
Diffusion-weighted imaging (DWI) and apparent diffusion coefficient (ADC) map are now being widely used in body cancer imaging for disease detection, disease characterization and assessment of treatment response.1-3 Single shot echo planar imaging (EPI) is the most commonly used for DWI due to its relative immunity to bulk motion artifacts and its high signal-to-noise ratio (SNR). However, severe image artifacts and distortion caused by susceptibility differences and poor static field shimming can limit its application for abdominal imaging, especially in the pelvis due to the movement and gas of intestine.4 DWI using the single-shot turbo spin-echo sequence (TSE-DWI) is less sensitive to susceptibility artifacts, because it uses radio frequency (RF) refocusing pulses. However, the scan time of this sequence is usually long due to multiple RF refocusing pulses and the RF heating restrictions with an increase in the specific absorption rate.5 Compressed sensing (CS) aims to reconstruct unaliased images from fewer measurements than that are traditionally required in MRI by exploiting image compressibility or sparsity. 6 Thus, we assume that appropriate combinations of CS with TSE-DWI may demonstrate further improved performance. In the Philips implementation of CS, the denoising level can be chosen as weak, medium, or strong with a balance between data consistency and sparsity constraining, and allows the user to select a preferred image appearance. For the optimal use of CS on TSE-DWI, the influence of the denoising level on signal intensity (SI) and ADC values should be investigated. Thus, this study aimed to evaluate the SI and ADC values of TSE-DWI using CS at different denoising levels in cervical cancer and normal cervix.Methods
Six patients (mean 51.2y, range 42-86y) who were pathologically diagnosed with cervical cancer and underwent pre-treatment MRI between February and May 2019, and 6 healthy volunteers (mean 29.3y, range 23-46y) who agreed on participation in the study were evaluated. Pelvic MRI was performed by using a 3.0T system (Ingenia, Philips Medical Systems, Best, The Netherlands) with dS Torso coils. TSE-DWI with CS were performed for each subject with the following parameters: TR/TE= 4000/73 ms; matrix= 112×89; slice thickness= 5 mm; CS sensitivity encoding (SENSE) factor = 2.5; field of view (FOV)= 300 mm, echo train length= 31. Diffusion encoding gradients were applied at b values of 0 and 1000 s/mm2. DW images with different denoising levels (no, weak, medium, and strong) were created in post-processing. Regions of interest (ROIs) were manually placed to best encompass the cervical cancer and normal cervical canal on DW images with b=0 and 1000 s/mm2 at each different denoising level, and then copied and pasted to the corresponding ADC maps. Image J (National Institutes of Health: NIH) was used for image analysis. SI on DW images and ADC values in each ROI were measured and compared with different denoising levels. ADC values were compared between the normal cervix and cervical cancer at each denoising level. For the further assessment, histogram analysis of ADC maps was performed. ROIs were manually placed on the cervical cancer and normal cervix, and the kurtosis and skewness were calculated. Kurtosis and skewness from ADC maps were compared between each denoising level. Each comparison was performed with two-way ANOVA. A P-value less than 0.05 was considered as statistically significant.Results
For both cervical cancer and normal cervix, the SI on DW images with b=0 did not change at the different denoising levels. The SI on DW images with b=1000 decreased as the denoising level increased, although no significant difference was observed in any combination (Fig.1). The ADC values of cervical cancer tended to increase as the denoising levels increased, although there were no significant differences. The ADC values of cervical cancer were significantly lower than that of normal cervix at each denoising level (P<0.001) (Fig.3). In the histogram analysis for both cervical cancer and normal cervix, the skewness decreased as the denoising level increased (Fig.4). As the denoising level increased, the kurtosis decreased for cervical cancer, and increased for normal cervix. However, there was no significant difference between each denosing level. Figure5 shows an example of histogram comparison obtained from the denoising level [no] and [strong].Conclusion
As the denoising level increased on TSE-DWI with b=1000 using CS, the SI of cervical cancer tended to decrease, and the ADC values tended to increase. At each denoising level, the significant difference was observed in the ADC values between the cancer and normal cervix.Acknowledgements
I would like to thank MRI staffs in Center of Radiology and Radiation Oncology for help with data collection and useful discussions.References
- Guo Y,Cai YQ,Cai ZL,et al.Differentation of clinically benign and malignant breast lesion using diffusion-weighted imaging.J Magn Reson imaging.2002;16(2):172-178
- Jahic E,Sofic A,Selimovic AH.DWI/ADC in differentiation of Benign from Malignant Focal Liver Lesion.Acta Inform Med.2016;24(4):244-247
- Namimoto T, Awai K, Nakaura T, et al.Role of diffusion-weighted imaging in the diagnosis of gynecological diseases.Eur Radiol. 2012;19:745-760
- Rouviere O,Hartman RP,Lyonnet D.Prostate MR imaging at high-field strength:evolution or revolution? Eur Radiol.2006;16(2):276-284
- Yoshida T, Urikura A, Shirata K, et al. Image quality assessment of single-shot turbo spin echo diffusion-weighted imaging with parallel imaging technique: a phantom study. Br J Radiol.2016 Sep;89(1065):20160512.doi:10.1259/bjr.20160512
- Lustig M,Donoho D,Pauly JM.Sparse MRI:The application of compressed sensing for rapid MR imaging.Magn Reson Med.2007;58(6):1182-1195
Figures
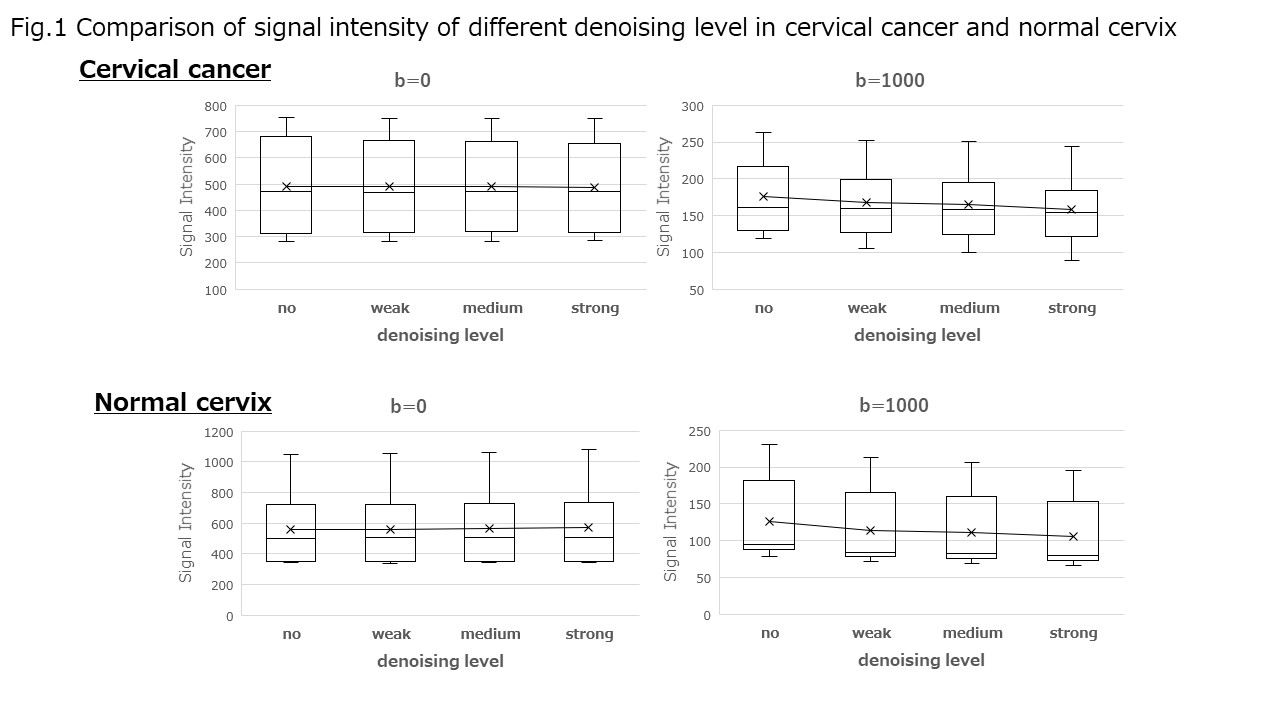
Figure1. Comparison of signal intensity of
different denoising level in cervical cancer and normal cervix. Not
significantly different in all comparison between each denoising level.
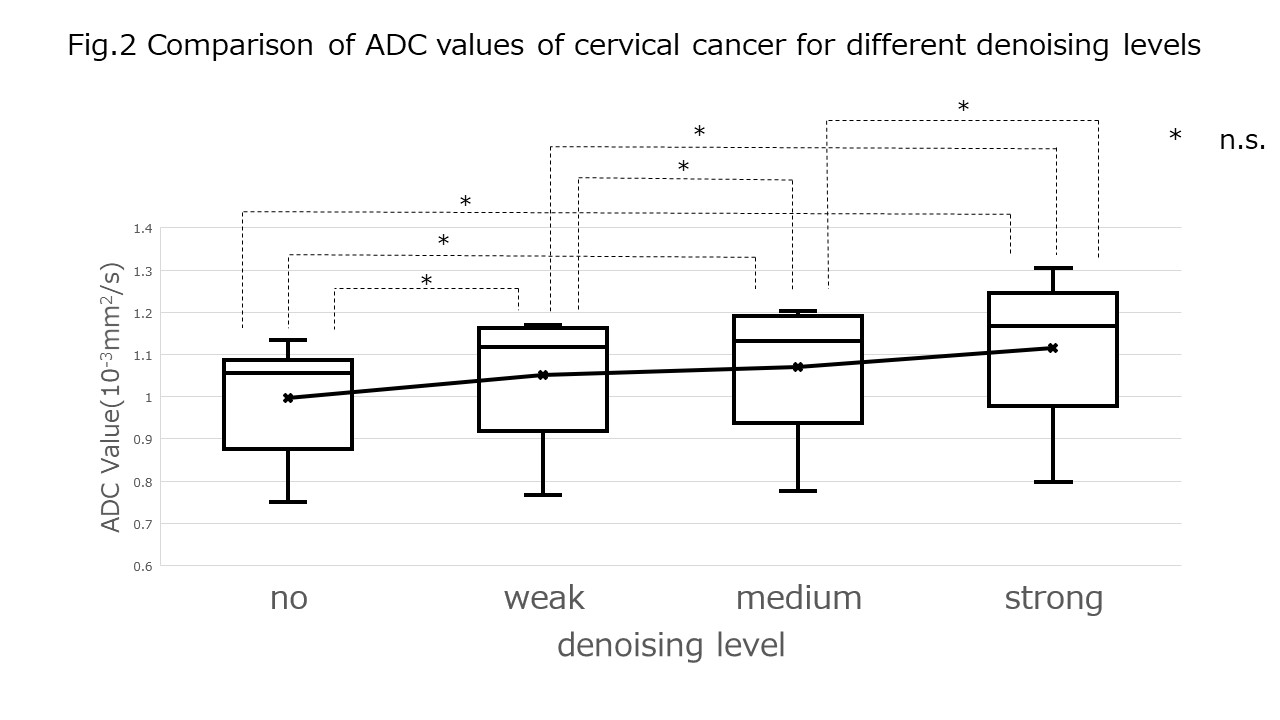
Figure2. Comparison of ADC values of
cervical cancer for different denoising levels
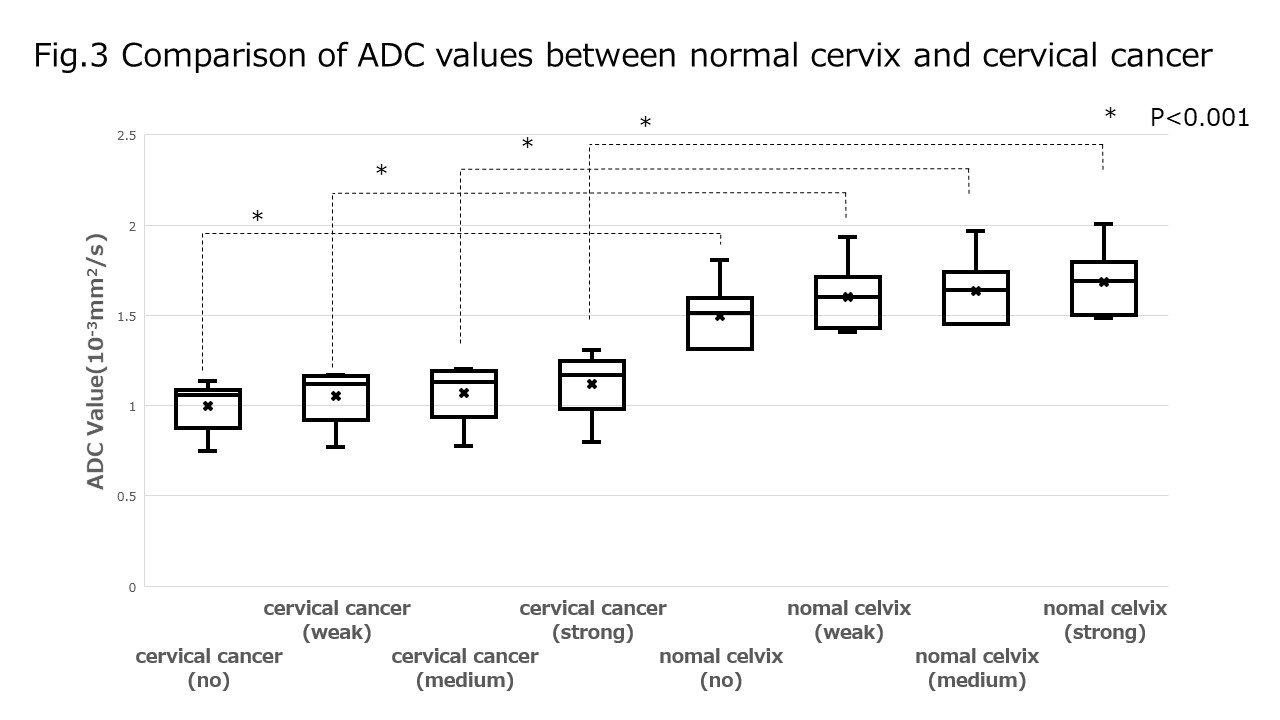
Figure3. Comparison of ADC values
between normal cervix and cervical cancer
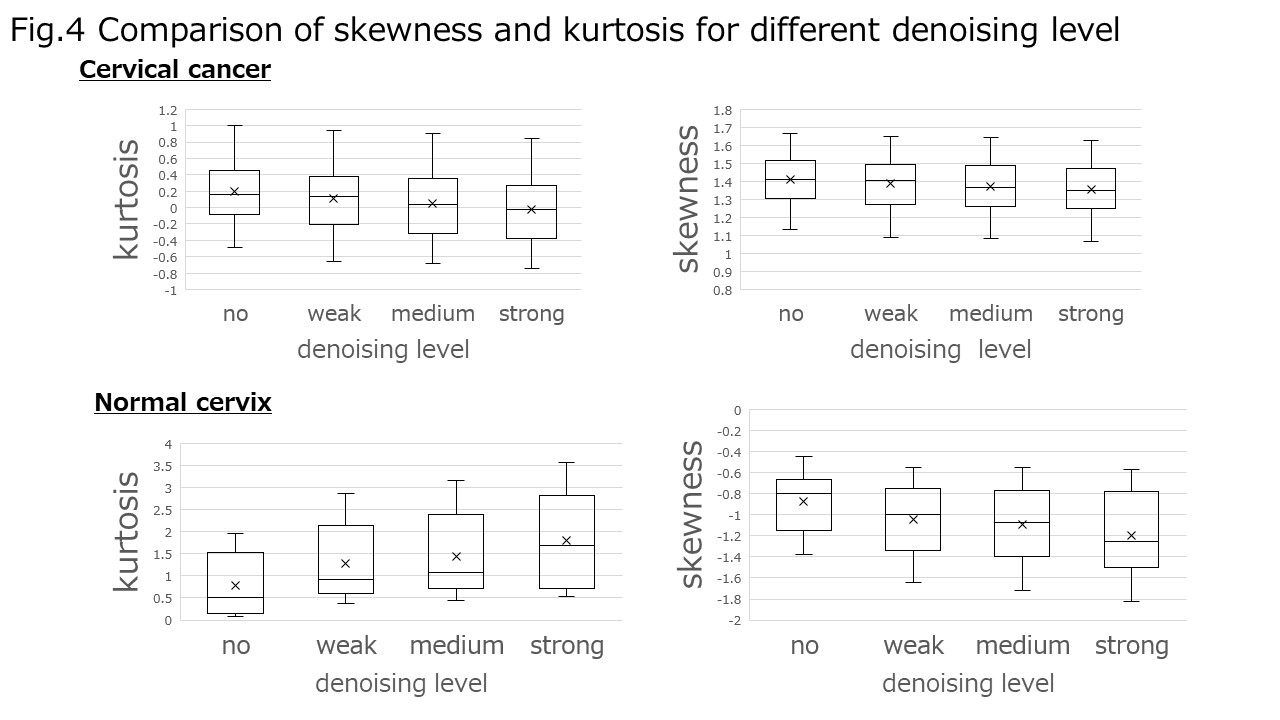
Figure4. Comparison of skewness and
kurtosis for different denoising level. Not
significantly different in all comparison between each denoising level.
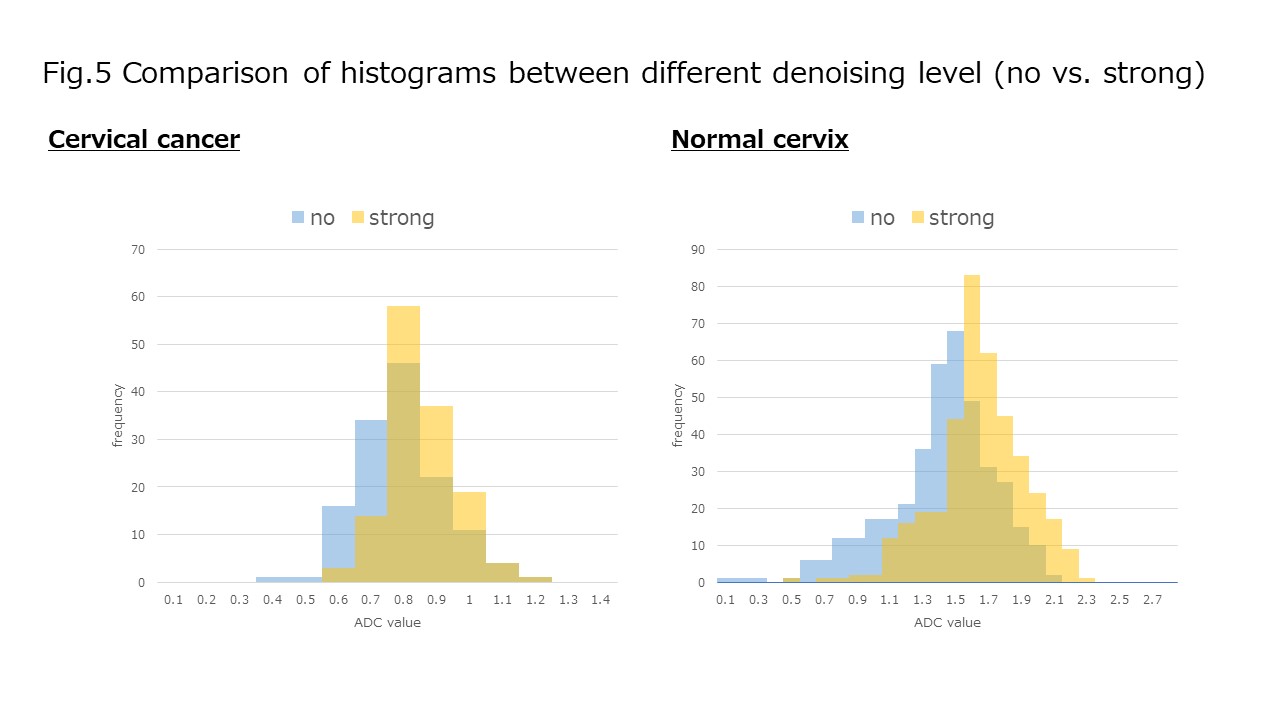
Figure5. Comparison of histograms
between different denoising
level (no vs. strong)