MRSI Readout Strategies (Echo-Planar [EPSI] & Spiral-MRSI)
1Fetal Neonatal Neuroimaging and Developmental Science Center, Boston Children's Hospital, Boston, MA, United States, 2Department of Radiology, Harvard Medical School, Boston, MA, United States
Synopsis
This talk covers the basics of MRSI readout strategies, by first introducing the conventional, phase-encoded scheme, which requires long acquisition times to encode the (kx,ky,kz,kf) space. It then introduces the idea of simultaneous spectral-spatial encoding within the same TR, made possible by the fact that the brain metabolites span only limited spectral bandwidth (e.g. ~1000Hz @3T). It continues with a description of two classical readout schemes that accelerate PE MRSI using this concept: 1. echo-planar and 2. spiral spectroscopic imaging. Lastly it shows how these two can be further accelerated using standard parallel imaging reconstruction methods like SENSE and/or GRAPPA.
What is MRSI?
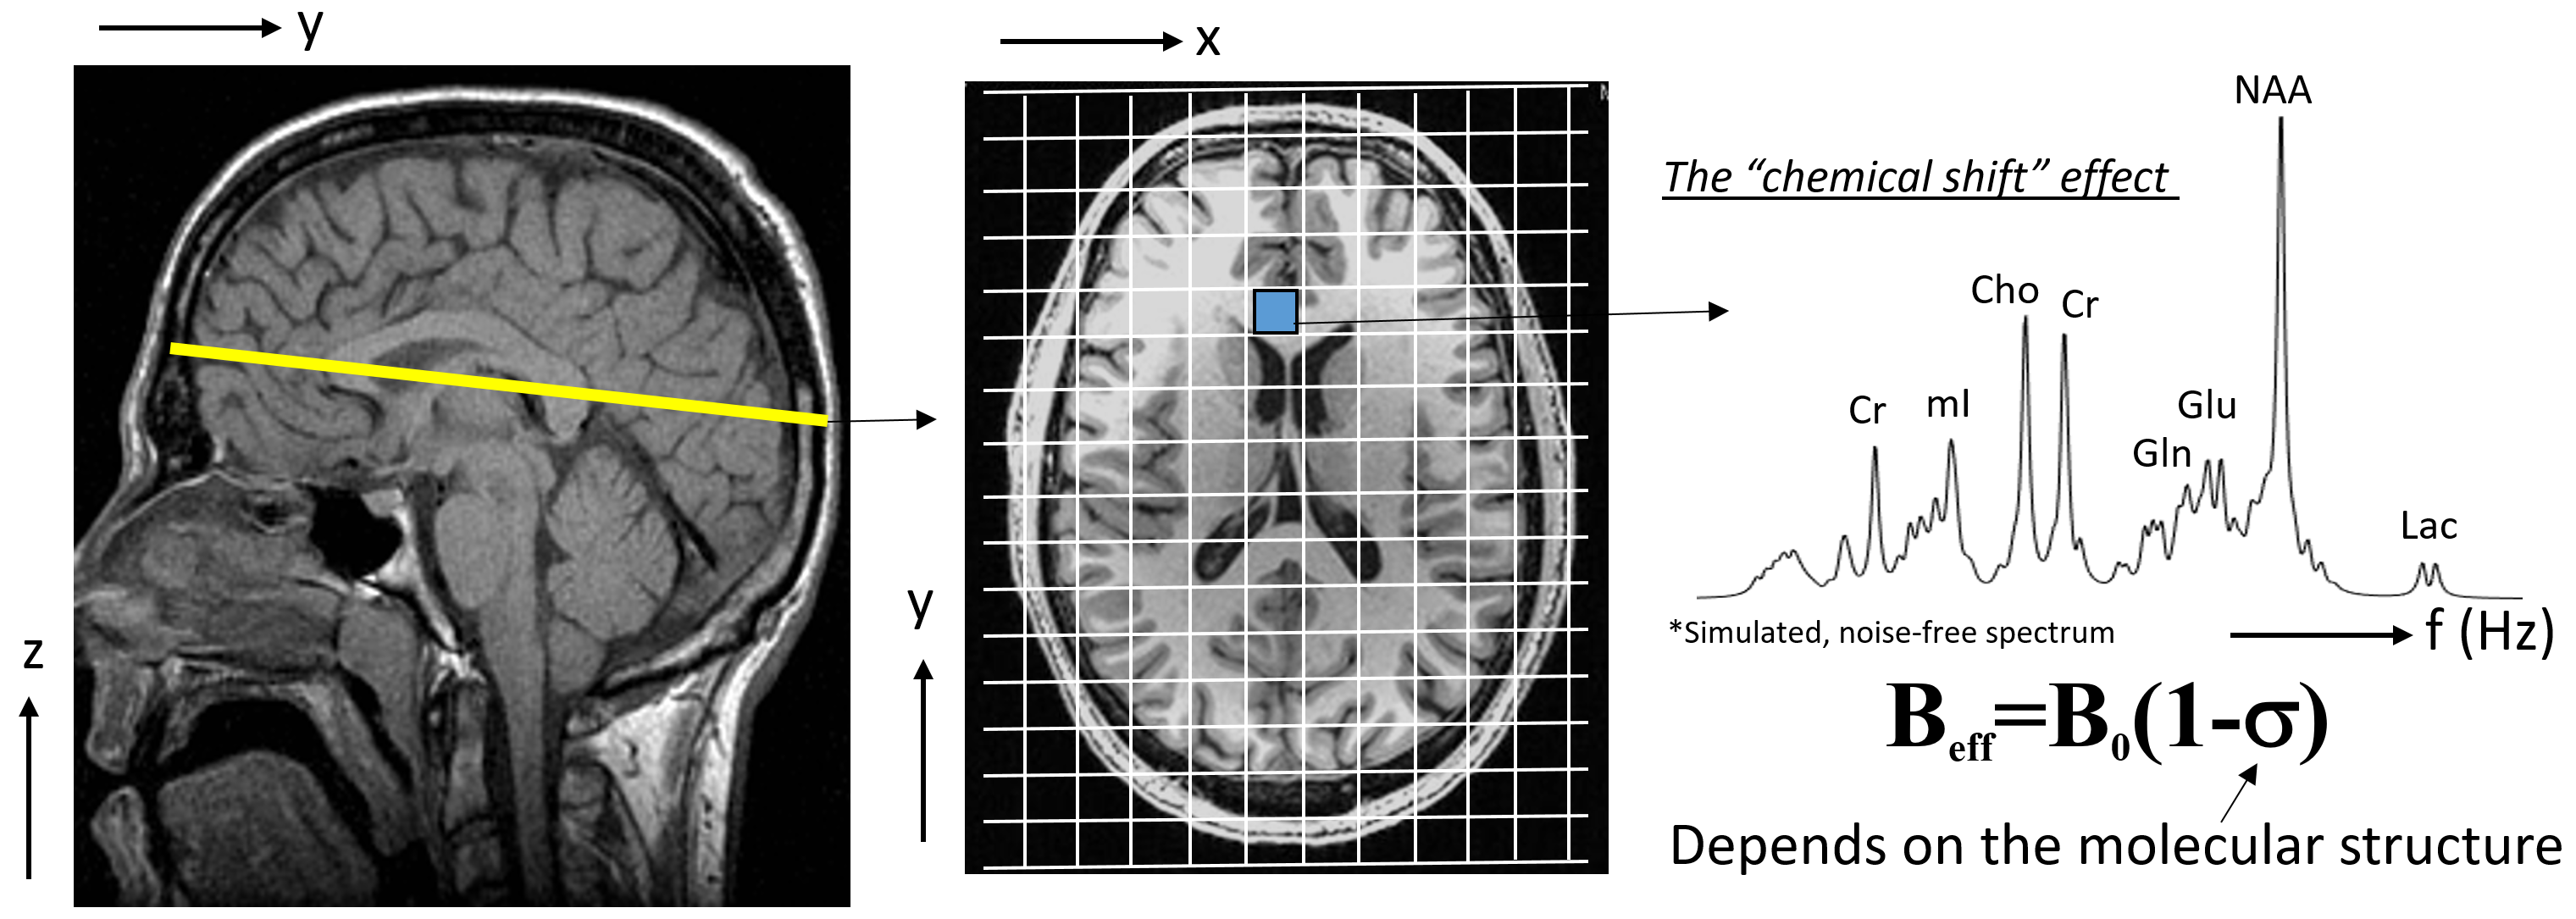
Magnetic Resonance Imaging provides information of the human tissue in the three spatial dimensions, x, y and z. Magnetic resonance spectroscopic imaging, on the other hand, obtains information along another dimension, i.e. frequency. In other words, it provides the means to obtain spectral information of the human tissue, which means that for each spatial location, as shown on the course spatial grid in Fig 1, now one is able to obtain spectral information in the region of interest. Obtaining spectral information corresponds to the ability of detecting and estimating the amounts of various chemicals that are part of the human tissue. Fig 1 also shows high quality, simulated spectrum of the human brain tissue. The main reason why we are even able to detect these chemicals, is the fact that due to their different molecular structure, the effective resonant frequency is slightly different for each of them, enabling us to tease them apart along the frequency dimension.The MRSI experiment
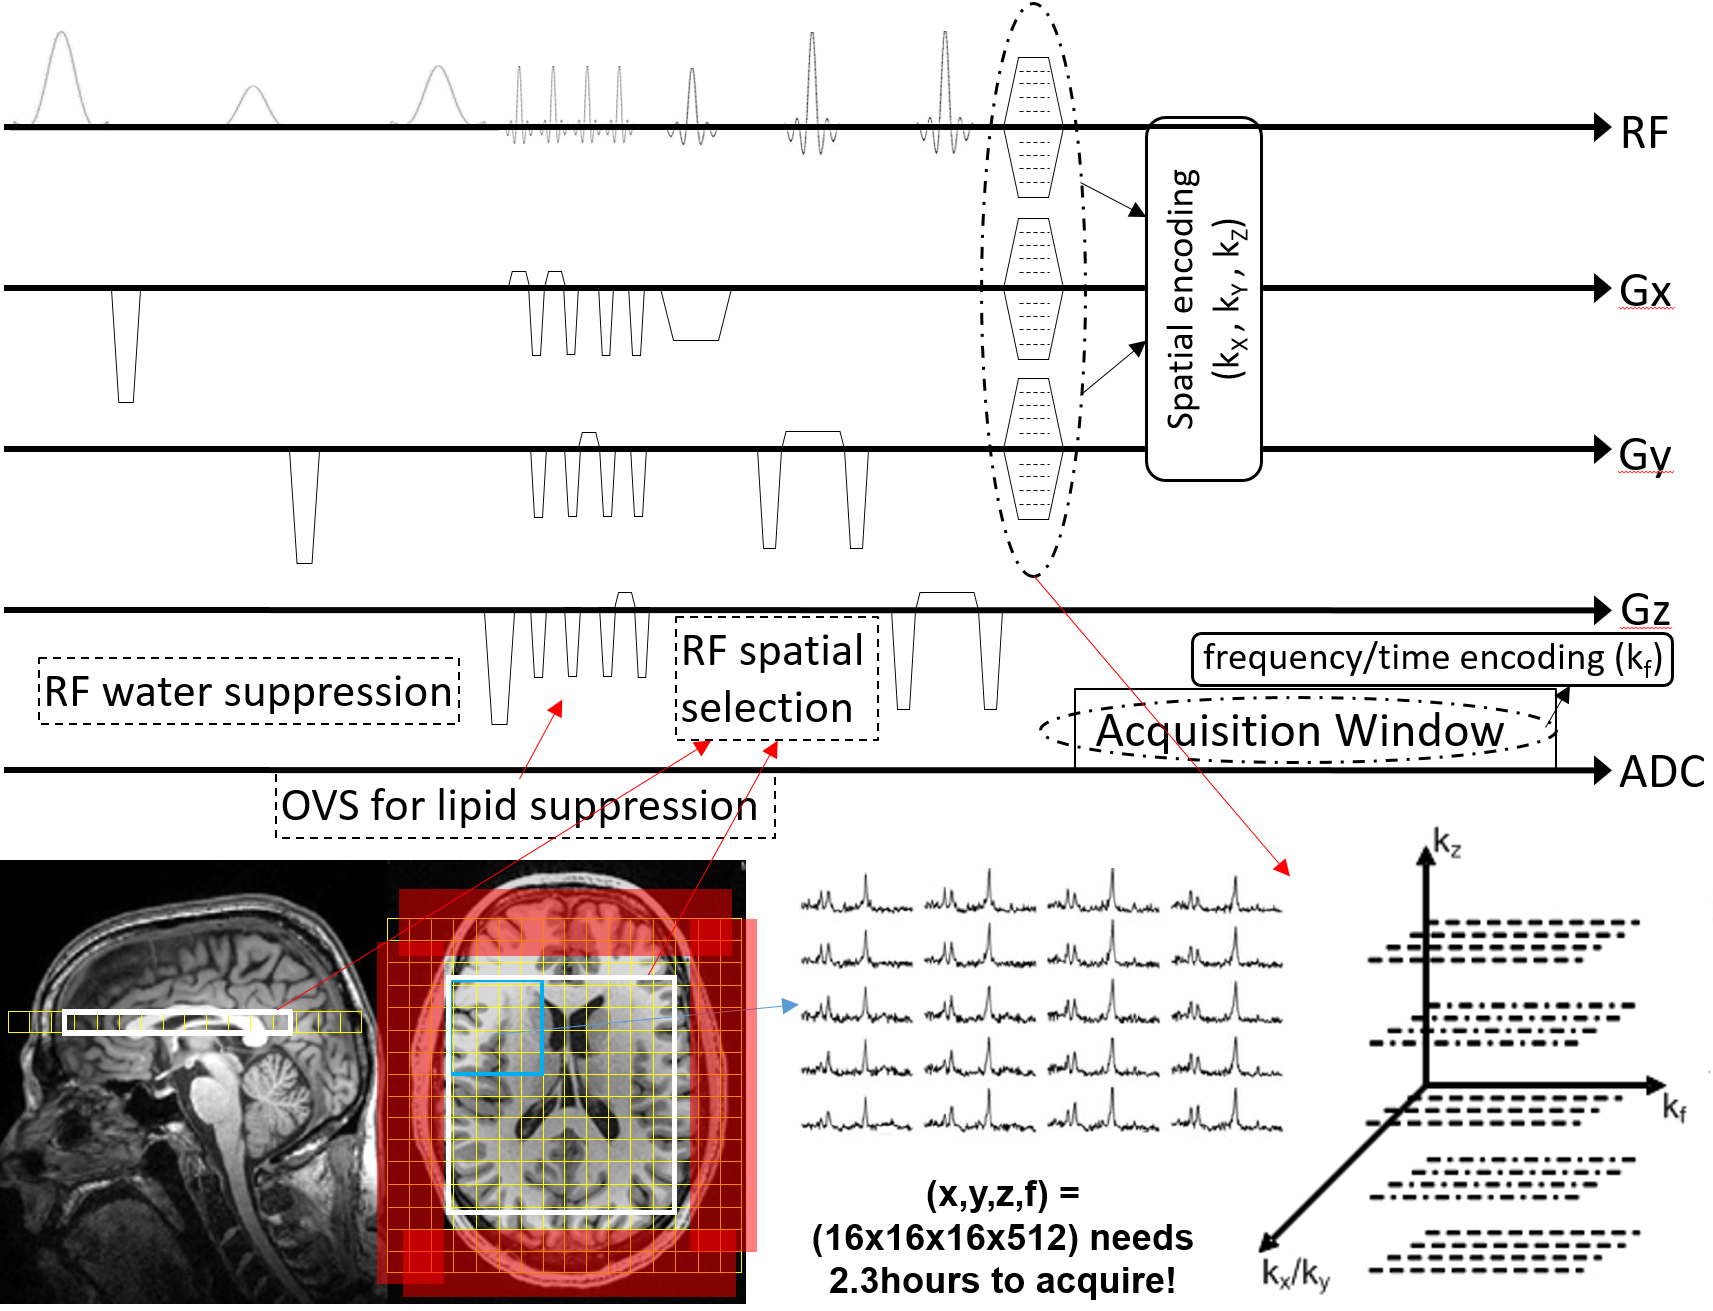
Every MRSI experiment consists of excitation and readout part, as depicted in Fig 2. In the excitation part, we play a series of RF pulses that provide spectral-spatial localization, and in the readout part we encode in both the spatial and spectral domains. A typical excitation scheme in MRSI is to play a series of RF pulses that excite a box within the brain. The strong water signal is usually suppressed by playing a series of RF pulses with different flip angles tuned to null as much of the water’s longitudinal magnetization based on its T1 value. To ensure there are no lipid signals that bleed in the excited brain region, outer volume suppression bands are often prescribed over the skull regions. On the readout end, to perform magnetic resonance spectroscopic imaging, one would need to do spatial encoding. A conventional, phase-encoded (PE) MRSI, simply plays phase-encoding gradients prior to the readout (see Fig 2), and repeats this until all desired k-space samples in the (kx,ky,kz) space are acquired. After that, spectra from the excited region are obtained by doing an inverse Fourier Transform, as it can be seen in Fig 2. However, a big drawback of this naïve encoding method is the long acquisition times, as FOV, resolution and imaging time are dependent parameters. For example, a 3D MRSI acquisition at a modest spatial matrix size of (x,y,z,f) = (16x16x16x512) would take around 2 hours and 20 minutes to acquire – an amount of time not feasible for in vivo imaging.Accelerating conventional MRSI
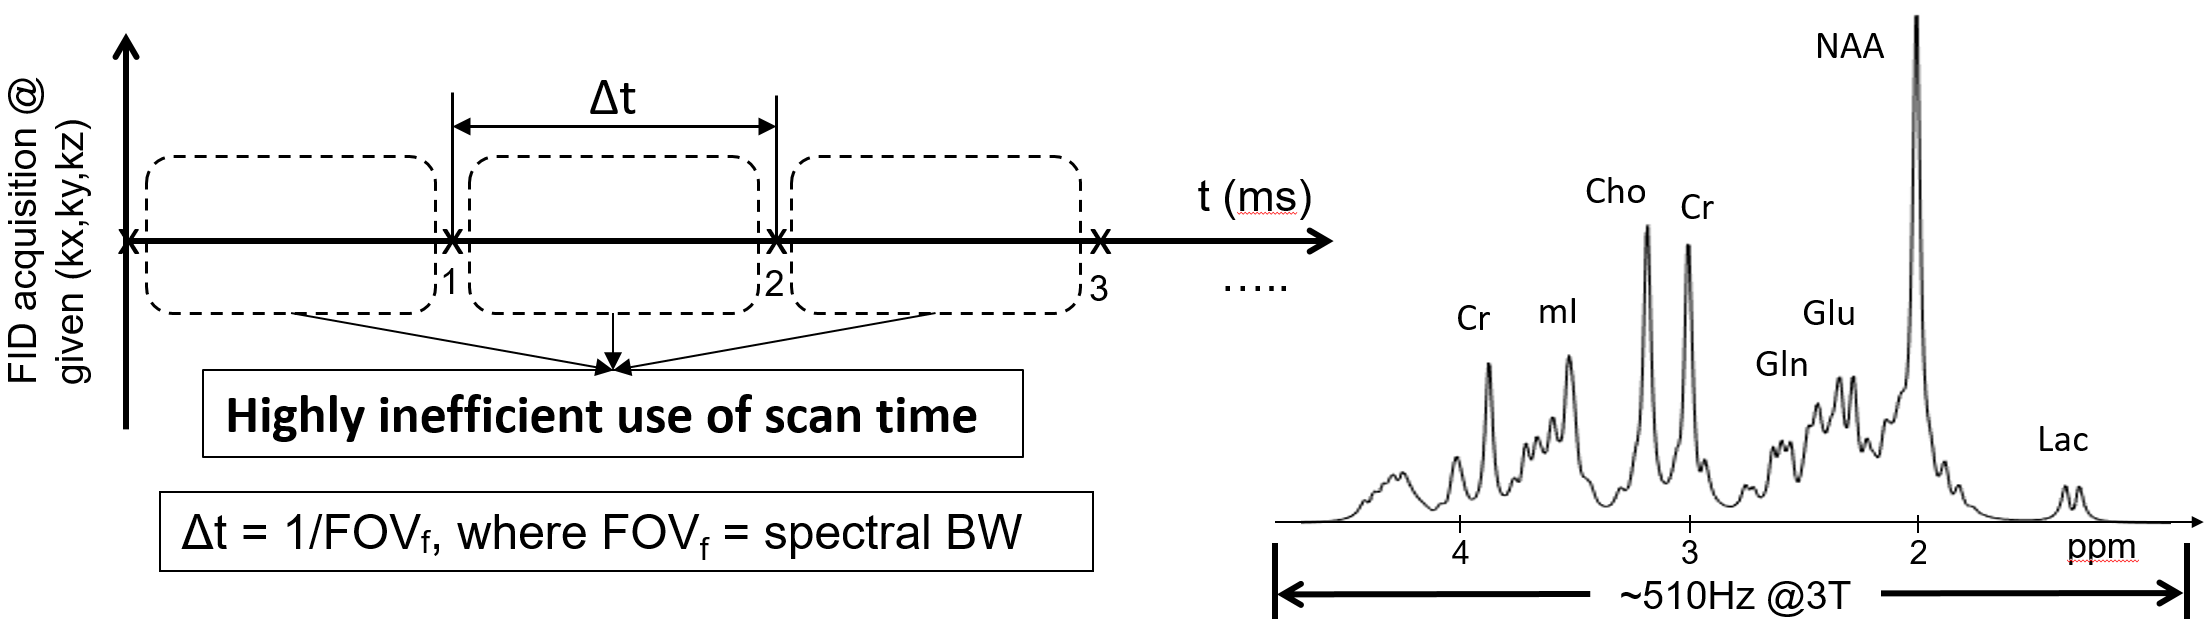
In conventional PE MRSI, there are basically no constraints on the spectral bandwidth, as during the readout period, only the FID signal is being encoded. Of note, the ADC sampling rate at today’s MRI scanners can go down to a microsecond, which would correspond to a spectral bandwidth of 1MHz. However, the brain metabolites of interest that can be detected by proton spectroscopy, span much narrower spectral bandwidth. For example, as shown in Fig 3, at 3T all the metabolites span at most 1000 Hz, including the water, lipid and macromolecule signals (which are not shown on the displayed spectrum). To achieve this spectral bandwidth without aliasing, one would need to sample the FID signal at a sampling rate of at least 1ms, and not faster. In the plot of Fig 3, the horizontal axis is time, and Δt represents the sampling rate, which in this case is 1ms. Looking at the “dead”/unused time between two consecutively acquired samples, one can immediately notice that this is a highly inefficient use of scan time. In other words, one can imagine that during this “dead” time some samples of the (kx,ky,kz) space can also be sampled. In this talk, the focus will be on two of the oldest, and well established MRSI readout techniques that exploit this idea. The first one is echo-planar spectroscopic Imaging, or EPSI, which simultaneously encodes the time axis and one spatial axis, and thus provides an order of magnitude acceleration over the conventional PE MRSI. The second is spiral spectroscopic imaging (spiral-MRSI), which simultaneously encodes the time axis and two spatial axes, and thus provides two orders of magnitude acceleration over conventional PE MRSI.Echo-planar Spectroscopic Imaging (EPSI)
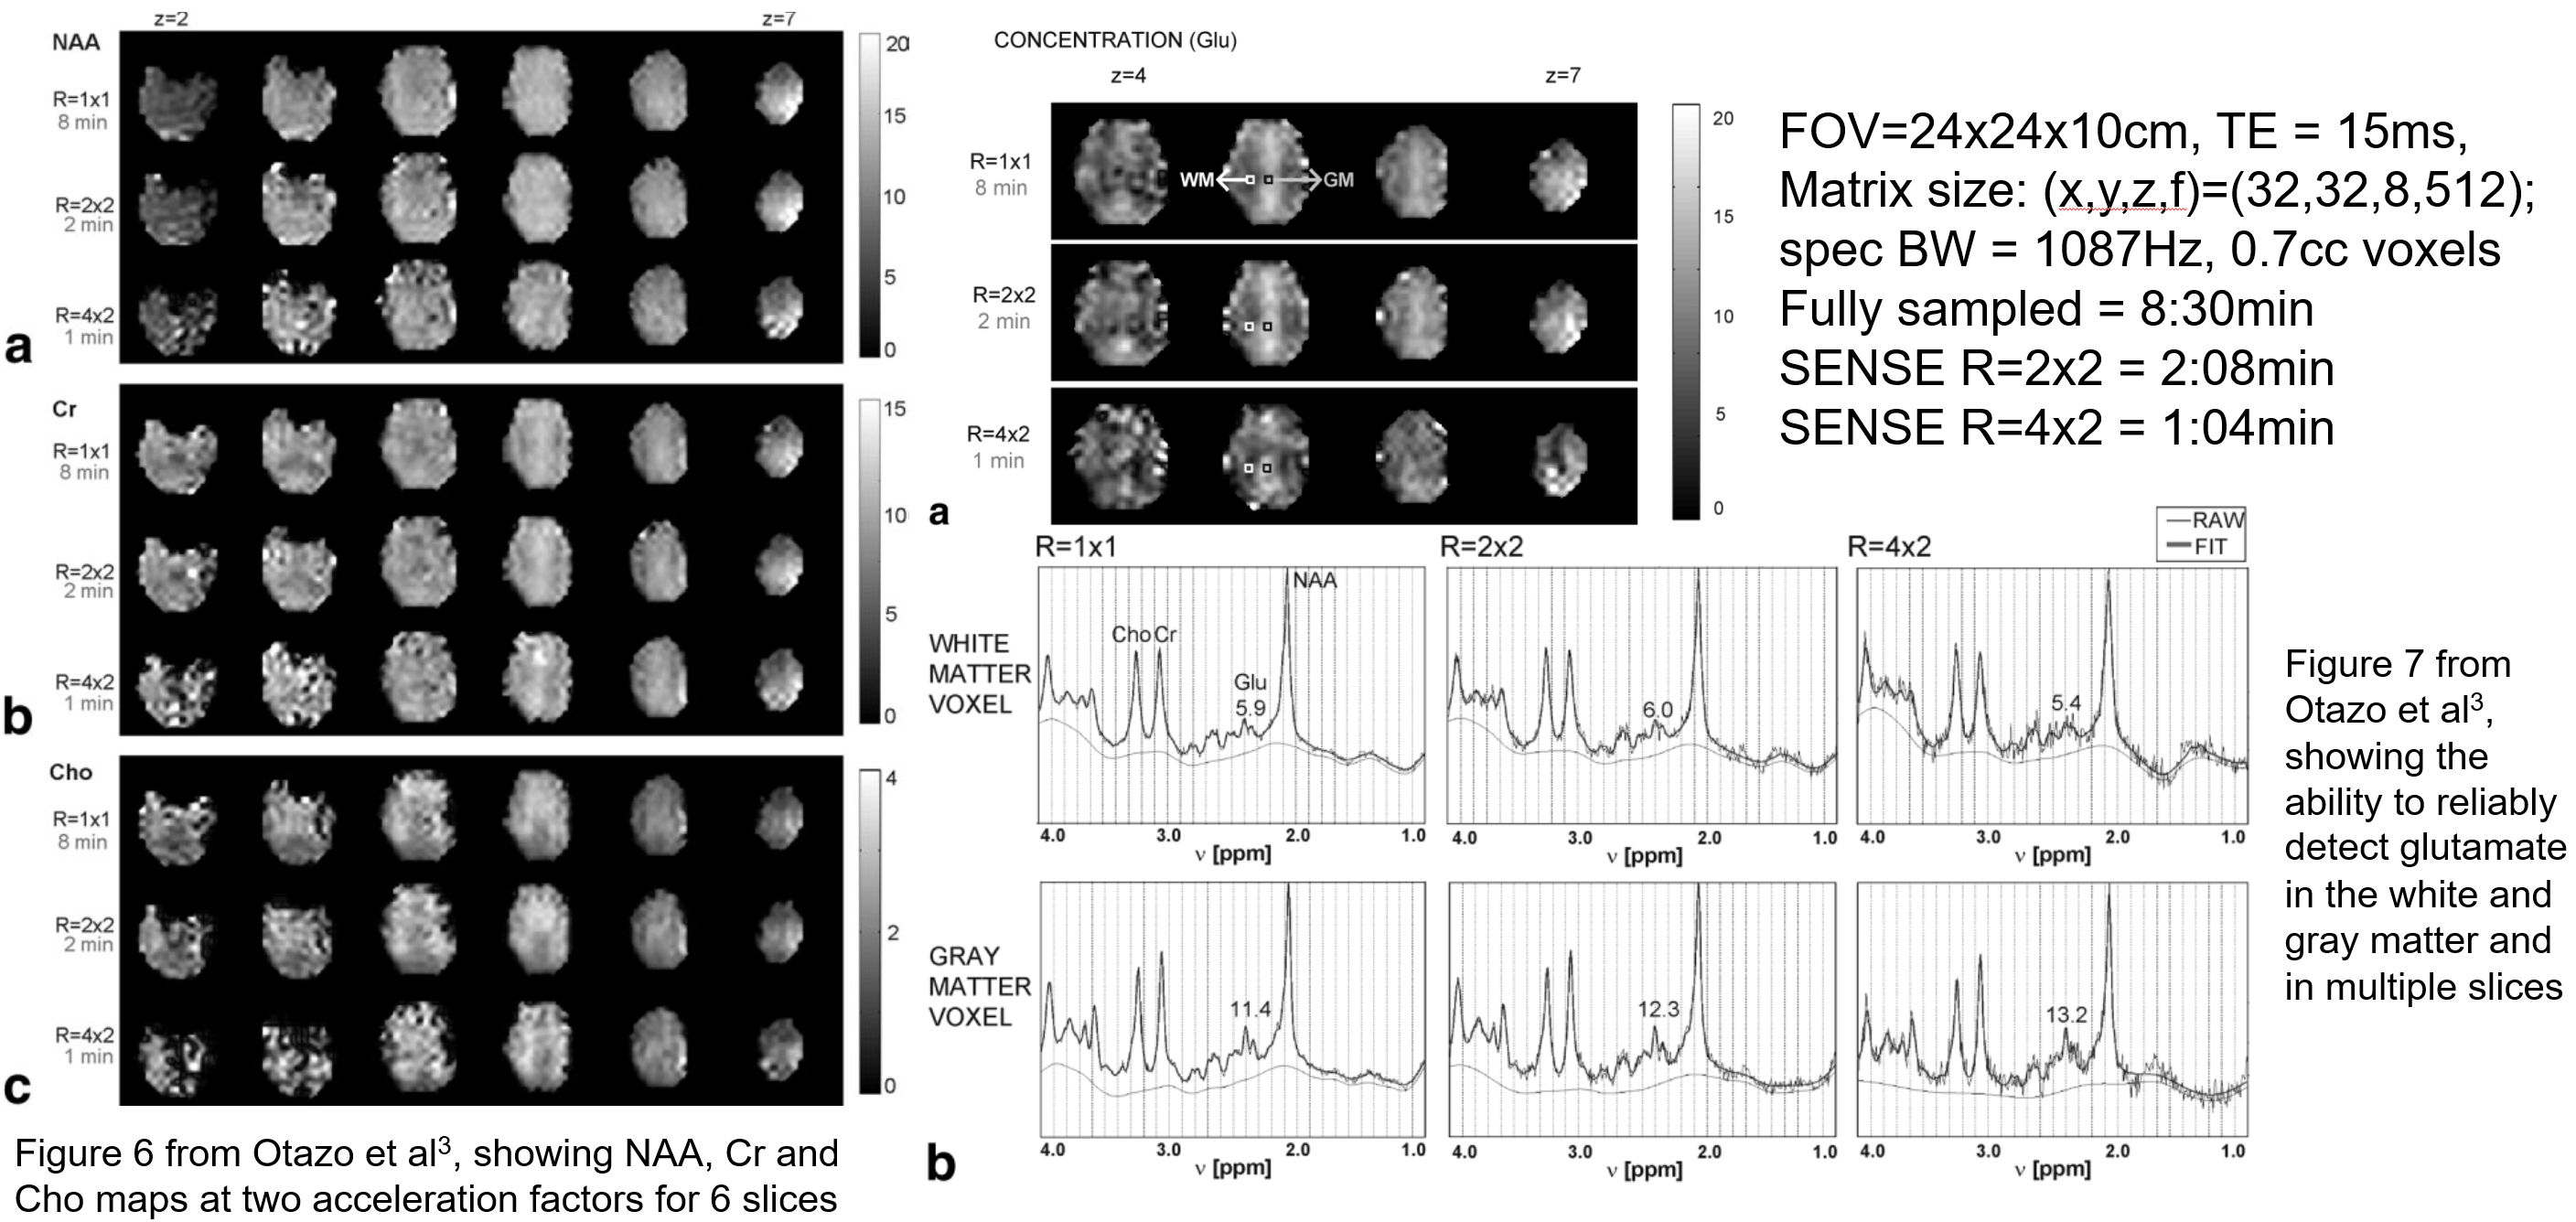
EPSI was introduced by Posse1, and was inspired by the theoretical work by Mansfield2. As I mentioned above, it simultaneously encodes the time axis and one spatial axis, say kx and phase encoding is done along the other two spatial axes. Fig 4 is an animated gif file, which one can click on to play out. As it can be seen, for the first TR, all kf and kx samples for a given ky location are acquired. At the beginning of the TR all kx samples for the first FID point are obtained, before moving to the all kx samples for the second FID point, and so on. In the second TR, the same thing is happening, but now we have moved to a different ky location, and finally again the same thing will be done in the last TR which is acquiring all the kx and kf samples of the last ky point. Note that for a given kx position we acquire both odd and even echoes, which is used in the reconstruction to improve image quality, deal with aliasing, and reduce chemical shift artifacts. Going back to our 16x16x16x512 MRSI example scan from before, with this encoding scheme, we have reduced the overall scan time by 16 fold, and now the 2 hours and 20 minutes scan would only take 8 and a half minutes.Despite the already high acceleration factors over the conventional PE MRSI, further speed up of EPSI is possible by employing established parallel imaging reconstruction methods. Otazo et al3, and shortly before Lin et al4, accelerated EPSI by skipping phase-encoding lines and using 2D SENSE reconstruction. Fig 5 shows NAA, creatine and choline maps from 6 slices from three volumetric 3D EPSI scans - one non-accelerated, and the other two accelerated by a factor of R=2x2 and R=4x2, respectively. The EPSI imaging parameters show that the fully sampled 3D EPSI scan is 8.5 minutes long, while the R=4x2 accelerated lasted only 1 minute. Fig 5 also shows another figure from the same paper, illustrating the ability of all three scans to reliably detect the glutamate signals across multiple slices in both the white and the gray matter. In a different study, Tsai et al5 accelerated EPSI again by skipping phase encoded lines, but now using GRAPPA reconstruction.
Spiral Spectroscopic Imaging
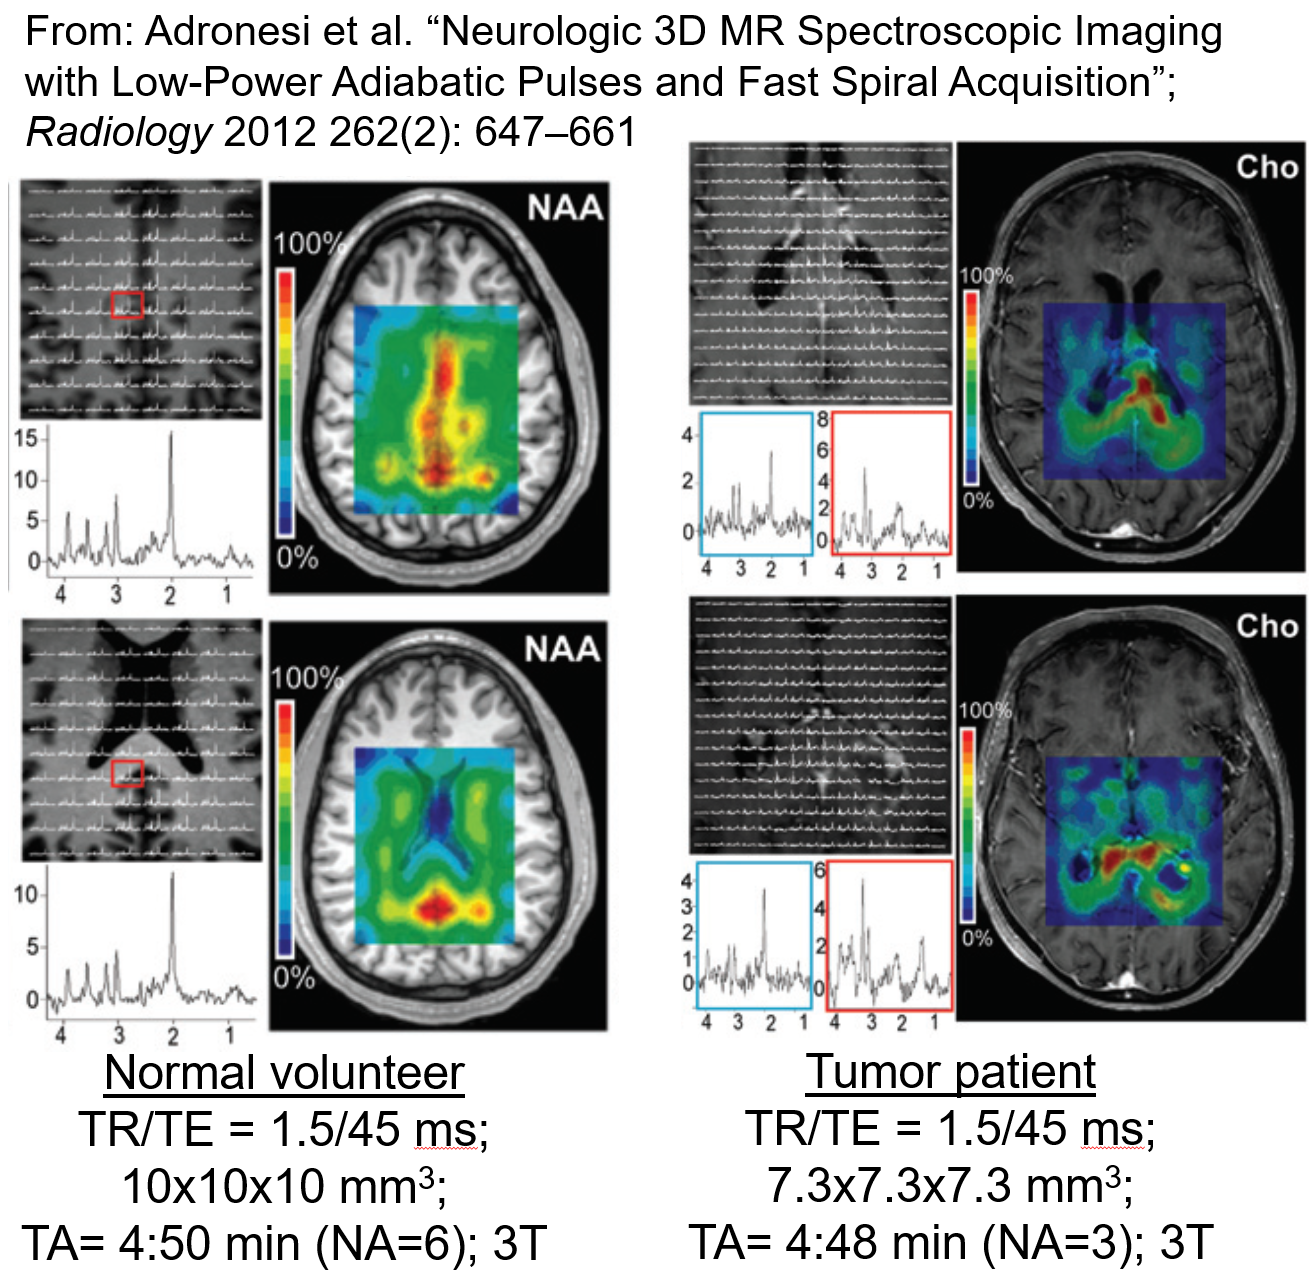
MRSI encoding using spiral-based k-space trajectories was first introduced by Adalsteinsson,6 and the general idea was again inspired by the theoretical work done by Mansfield2. As mentioned earlier, it encodes the time axis and two spatial axes, simultaneously. It plays sinusoidal gradients along Gx and Gy, which yield spiral-like k-space sampling, and phase encoding is applied along the third spatial axis. Fig 6 is again an animated gif which is played on a click, and demonstrates the readout scheme of spiral MRSI. Specifically, the spiral trajectories are repeatedly played during the long readout, effectively sampling the entire FID for a portion of the desired (kx,ky) space. In the subsequent TRs, the entire FIDs of different (kx,ky) samples are obtained by playing rotated spirals. Shown here are spiral-out trajectories, and after each spiral lobe is played, a rewinder gradient is applied to go back to the center of k-space, so that the spiral-out trajectory is played again for the next kf point. Going back to our 3D MRSI example of encoding a 16x16x16x512 matrix, we now can see that using spiral MRSI, we can encode this matrix in a little over 2 minutes.Just like EPSI,7–10 spiral MRSI has also been used in multiple studies,11–14 showing its capability to obtain volumetric spectroscopic data of the human brain and probe brain physiology. Fig 7 shows figures from one such study15 where 3D spiral MRSI using semi-LASER excitation was employed in normal volunteers and in tumor patients, enabling volumetric MRSI data at voxel sizes of 0.4cc to be acquired in less than 5 minutes. Lastly, further acceleration is also possible for spiral MRSI. Mayer et al16 accelerated spiral MRSI by skipping angular interleaves and using SENSE reconstruction.
Conclusion
This talk discusses details about the encoding schemes of echo-planar and spiral spectroscopic imaging, as two of the first acquisition methods used to accelerate MRSI, which have been used for more than 20 years. However, since then, there have been a lot of other methods introduced that also accelerate MRSI by undersampling the spectral-spatial domain in a different fashion and by using specific reconstruction that is tailored to that specific undersampling scheme. Many of these methods, are nicely summarized in a review paper by Bogner at al17, and include: concentric ring trajectories,18 rosette trajectories,19 radial EPSI,20 randomly undersampled spiral trajectories,21 incoherent sampling with compressed sensing22 and the SPICE method,23 which uses subspace, low-rank reconstruction.Acknowledgements
I would like to thank Wolfgang Bogner (Med Uni of Vienna), Elfar Adalsteinsson (MIT) and Eva-Maria Ratai (MGH) for their insightful comments, and Bernhard Strasser (Med Uni of Vienna) for providing the animated gifs that depict the sampling schemes of EPSI and spiral MRSIReferences
1. Posse S, Tedeschi G, Risinger R, Ogg R, Le Bihan D. High speed 1H spectroscopic imaging in human brain by echo planar spatial-spectral encoding. Magn Reson Med. 1995 Jan;33(1):34–40. PMID: 7891533
2. Mansfield P. Spatial mapping of the chemical shift in NMR. Magn Reson Med. 1984 Sep;1(3):370–386. PMID: 6571566
3. Otazo R, Tsai S-Y, Lin F-H, Posse S. Accelerated short-TE 3D proton echo-planar spectroscopic imaging using 2D-SENSE with a 32-channel array coil. Magn Reson Med. 2007 Dec;58(6):1107–1116. PMID: 17968995
4. Lin F-H, Tsai S-Y, Otazo R, Caprihan A, Wald LL, Belliveau JW, Posse S. Sensitivity-encoded (SENSE) proton echo-planar spectroscopic imaging (PEPSI) in the human brain. Magn Reson Med. 2007 Feb;57(2):249–257. PMID: 17260356
5. Tsai S-Y, Otazo R, Posse S, Lin Y-R, Chung H-W, Wald LL, Wiggins GC, Lin F-H. Accelerated proton echo planar spectroscopic imaging (PEPSI) using GRAPPA with a 32-channel phased-array coil. Magn Reson Med. 2008 May;59(5):989–998. PMID: 18429025
6. Adalsteinsson E, Irarrazabal P, Topp S, Meyer C, Macovski A, Spielman DM. Volumetric spectroscopic imaging with spiral-based k-space trajectories. Magn Reson Med. 1998 Jun;39(6):889–898. PMID: 9621912
7. Posse S, Otazo R, Caprihan A, Bustillo J, Chen H, Henry P-G, Marjanska M, Gasparovic C, Zuo C, Magnotta V, Mueller B, Mullins P, Renshaw P, Ugurbil K, Lim KO, Alger JR. Proton echo-planar spectroscopic imaging ofJ-coupled resonances in human brain at 3 and 4 Tesla [Internet]. Magnetic Resonance in Medicine. 2007. p. 236–244. Available from: http://dx.doi.org/10.1002/mrm.21287
8. Maudsley AA, Govind V, Saigal G, Gold SG, Harris L, Sheriff S. Longitudinal MR Spectroscopy Shows Altered Metabolism in Traumatic Brain Injury. J Neuroimaging. 2017 Nov;27(6):562–569. PMCID: PMC5665696
9. Ebel A, Soher BJ, Maudsley AA. Assessment of 3D proton MR echo-planar spectroscopic imaging using automated spectral analysis. Magn Reson Med. 2001 Dec;46(6):1072–1078. PMID: 11746571
10. Otazo R, Mueller B, Ugurbil K, Wald L, Posse S. Signal-to-noise ratio and spectral linewidth improvements between 1.5 and 7 Tesla in proton echo-planar spectroscopic imaging. Magn Reson Med. 2006 Dec;56(6):1200–1210. PMID: 17094090
11. Pfefferbaum A, Adalsteinsson E, Sullivan EV. Cortical NAA deficits in HIV infection without dementia: influence of alcoholism comorbidity. Neuropsychopharmacology. 2005 Jul;30(7):1392–1399. PMID: 15812566
12. Adalsteinsson E, Star-Lack J, Meyer CH, Spielman DM. Reduced spatial side lobes in chemical-shift imaging. Magn Reson Med. 1999 Aug;42(2):314–323. PMID: 10440957
13. Bogner W, Gagoski B, Hess AT, Bhat H, Tisdall MD, van der Kouwe AJW, Strasser B, Marjańska M, Trattnig S, Grant E, Rosen B, Andronesi OC. 3D GABA imaging with real-time motion correction, shim update and reacquisition of adiabatic spiral MRSI. Neuroimage. 2014 Dec;103:290–302. PMCID: PMC4312209
14. Pfefferbaum A, Adalsteinsson E, Spielman D, Sullivan EV, Lim KO. In vivo spectroscopic quantification of the N-acetyl moiety, creatine, and choline from large volumes of brain gray and white matter: effects of normal aging. Magn Reson Med. 1999 Feb;41(2):276–284. PMID: 10080274
15. Andronesi OC, Gagoski BA, Sorensen AG. Neurologic 3D MR spectroscopic imaging with low-power adiabatic pulses and fast spiral acquisition. Radiology. 2012 Feb;262(2):647–661. PMCID: PMC3267083
16. Mayer D, Kim D-H, Spielman DM, Bammer R. Fast parallel spiral chemical shift imaging at 3T using iterative SENSE reconstruction. Magn Reson Med. 2008 Apr;59(4):891–897. PMCID: PMC3986023
17. Bogner W, Otazo R, Henning A. Accelerated MR spectroscopic imaging-a review of current and emerging techniques. NMR Biomed. 2020 May 12;e4314. PMID: 32399974
18. Furuyama JK, Wilson NE, Thomas MA. Spectroscopic imaging using concentrically circular echo-planar trajectories in vivo. Magn Reson Med. 2012 Jun;67(6):1515–1522. PMID: 22006586
19. Schirda CV, Tanase C, Boada FE. Rosette spectroscopic imaging: optimal parameters for alias-free, high sensitivity spectroscopic imaging. J Magn Reson Imaging. 2009 Jun;29(6):1375–1385. PMID: 19472411
20. Ramirez MS, Lee J, Walker CM, Sandulache VC, Hennel F, Lai SY, Bankson JA. Radial spectroscopic MRI of hyperpolarized [1-(13) C] pyruvate at 7 tesla. Magn Reson Med. 2014 Oct;72(4):986–995. PMCID: PMC4007384
21. Chatnuntawech I, Gagoski B, Bilgic B, Cauley SF, Setsompop K, Adalsteinsson E. Accelerated H MRSI using randomly undersampled spiral-based k-space trajectories. Magn Reson Med. 2015 Jul;74(1):13–24. PMID: 25079076
22. Hu S, Lustig M, Chen AP, Crane J, Kerr A, Kelley DAC, Hurd R, Kurhanewicz J, Nelson SJ, Pauly JM, Vigneron DB. Compressed sensing for resolution enhancement of hyperpolarized 13C flyback 3D-MRSI. J Magn Reson. 2008 Jun;192(2):258–264. PMCID: PMC2475338
23. Lam F, Ma C, Clifford B, Johnson CL, Liang Z-P. High-resolution (1) H-MRSI of the brain using SPICE: Data acquisition and image reconstruction. Magn Reson Med. 2016 Oct;76(4):1059–1070. PMCID: PMC4848237
Figures