4361
A Fast Tissue Segmentation Algorithm Using ASL Fingerprint Timeseries1FMRI Laboratory, University of Michigan, Ann Arbor, MI, United States, 2University of Michigan, Ann Arbor, MI, United States
Synopsis
Partial Volume effects (PVE) in ASL have been shown to lead to significant quantification errors. PVE in ASL fingerprinting data have not been previously investigated but are also likely to introduce significant errors in quantification, given their typically coarse resolution. A simple algorithm is presented to calculate tissue fraction maps from ASL MRF timeseries data without collection of additional anatomical images. These fraction maps can be used to implement partial volume corrections as well as identify tissue abnormalities.
Introduction
Partial Volume effects (PVE) in ASL have been shown to lead to significant quantification errors. PVE in ASL fingerprinting data have not been previously investigated but are also likely to introduce significant errors in quantification, given their typically coarse resolution. A simple algorithm is presented to calculate tissue fraction maps from ASL MRF timeseries data without collection of additional anatomical images. These fraction maps can be used to implement partial volume corrections as well as identify tissue abnormalities.Correction schemes for PVE typically rely on segmentation and classification of voxels into tissue types from anatomical images and probabilistic templates and sophisticated spatial normalization algorithms (Chappell 2011). However, MRF time courses can also be used for tissue segmentation (Griswold 2019). Here, we investigate the use of ASL fingerprint signals (Su 2016, Wright 2018) to segment and calculate tissue type fractions in the brain using a simple clustering algorithm akin to k-means.
Methods
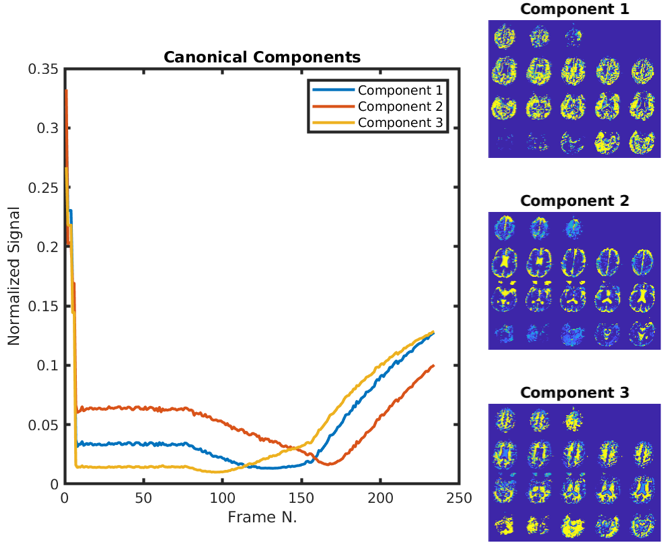
We collected velocity selective ASL fingerprint time series from 5 human participant’s brains. In short, a time series of 234 images was collected following preparation inversion pulses followed by a 3D FSE spiral read-out, after a variable delay. The preparation pulses were either velocity selective or non-selective inversion [Guo 2020], selected at random. A clustering algorithm was implemented to identify representative pure tissue time courses, as follows: (1) Three initial (seed) time courses with synthetic MRF time course were generated using Bloch simulations using rough approximations to the tissue parameters of interest (grey matter, white matter and CSF).(2) The inner product of each voxel’s time course with each the seed time courses was calculated. The time course was then normalized and added to the seed time course with the highest correlation. This procedure was iterated 10 times. The resulting time courses were then assumed to be the canonical signals of each tissue type.(3) The canonical time courses were used to construct a general linear model (X) of the image time series (Y):Y = Xcanonical β + ε
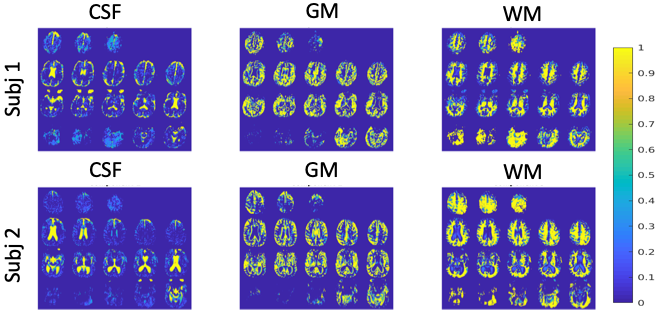
The amplitude (β) of each time course in the model (X) was then estimated using simple linear regression at each voxel. (4) Fractional maps were calculated from the amplitude estimated maps as the fraction of the total amplitude that each component accounted for.(5) The resulting fractional maps were assigned to white matter, grey matter, or CSF, by ranking the apparent T1 decay rates of the canonical time courses.
Results
Time courses resulting from the algorithm for a representative subject can be seen in the left panel of figure 1. These are clearly separated and suggest a strong dependence on T1 and the post-inversion labeling delay. The corresponding fractional maps are seen on the right side of the figure. It is apparent from the images that these maps align well with expected grey, white matter and CSF regions. Two additional subjects are shown in figure 2. The one on the bottom panel showed significantly enlarged ventricles and atrophy.Discussion
The proposed method can provide fractional tissue type maps for partial volume effect corrections in ASL quantification without collecting additional maps. The scope of the present work is limited to the development of the segmentation algorithm. Future work will be to (1) validate the method against other standard normalization pipelines involving structural data and (2) incorporate the tissue fraction information into the fingerprint quantification process to correct for partial volume effects. If successful, this method will allow partial volume correction of ASL fingerprint data without the need for additional structural images.Acknowledgements
National Institutes of Health: R01NS112233
Michigan Alzheimer’s Disease Center
References
Wright, Katherine L., Yun Jiang, Dan Ma, Douglas C. Noll, Mark A. Griswold, Vikas Gulani, and Luis Hernandez-Garcia. 2018. “Estimation of Perfusion Properties with MR Fingerprinting Arterial Spin Labeling.” Magnetic Resonance Imaging 50 (July): 68–77.
Su, Pan, Deng Mao, Peiying Liu, Yang Li, Marco C. Pinho, Babu G. Welch, and Hanzhang Lu. 2016. “Multiparametric Estimation of Brain Hemodynamics with MR Fingerprinting ASL.” Magnetic Resonance in Medicine 00 (November): 1–12.
Guo, Jia, Shaurov Das, and Luis Hernandez-Garcia. n.d. “Comparison of Velocity Selective Arterial Spin Labeling Schemes.” Magnetic Resonance in Medicine.
Griswold, Mark, et al. "Nuclear magnetic resonance (NMR) fingerprinting tissue classification and image segmentation." U.S. Patent No. 10,261,154. 16 Apr. 2019.
Chappell, Michael A., et al. "Partial volume correction of multiple inversion time arterial spin labeling MRI data." Magnetic Resonance in Medicine 65.4 (2011): 1173-1183.
Figures