4356
Quantitative Analysis of DCE-MRI Following Transient Middle Cerebral Artery Occlusion in a Novel Ovine Model1School of Chemical and Physical Sciences, Victoria University of Wellington, Wellington, New Zealand, 2School of Engineering and Computer Science, Victoria University of Wellington, Wellington, New Zealand, 3Centre for Translational Physiology, University of Otago, Wellington, New Zealand, 4Discipline of Anatomy and Pathology, University of Adelaide, Adelaide, Australia, 5Robinson Research Institute, Victoria University of Wellington, Wellington, New Zealand
Synopsis
Following a surgical model of transient and ischaemic stroke, 20 sheep (24-36 months; 65-75kg; 10M, 10F) underwent 2h middle cerebral artery occlusion (MCAO). Dynamic Contrast Enhanced (DCE) MRI datasets were obtained capturing the healthy animal, and progression of the infarct at 24h, 3d, 6d and 28 d post-stroke. Based on established pharmacokinetic models, analysis of these DCE-MRI images allows for calculation of perfusion parameters. The surgical procedure used is standardised and reproducible, meaning that this dataset provides an opportunity for quantitative in vivo analysis of stroke evolution in a clinically-relevant, gyrencephalic large animal model.
Introduction
Stroke is the most common cause of dementia, acquired disability and the second leading cause of death worldwide1,2. Ischaemic stroke results from a disruption in cerebral blood flow, most commonly due to arterial occlusion. Given that continuous supply of nutrients and oxygen is essential for cerebral function, disruption to cerebral blood flow leads to neuronal cell death within minutes of onset. While over 1,000 potential stroke therapies have proven beneficial in experimental stroke studies, only one has been successfully translated into an effective clinical stroke therapy3. It has been suggested that one of the potential causes for the poor translation from experimental setting to clinical trials is the choice of animal model. Small animals, such as rodents, are most commonly used to model stroke because they are cost-effective, have a large known physiological database and are easy to handle. However, the rodent brain differs considerably in terms of structure and function from the human brain due to its lissencephalic pattern and small proportion of white matter4.As such, we used a reproducible ovine model of stroke to capitalise on the advantages of a large human-like gyrencephalic brain with a large proportion of white matter5,6. We believe that using a reproducible, clinically-relevant model enables longitudinal comparison between animals, especially in quantitative measurements such as ones associated with perfusion from the stroke-affected region of brain tissue.
This research is the first of its kind to provide estimates of perfusion parameters in a novel ovine model of stroke at clinically relevant time points. These results can enable future research into a perfusion-diffusion mismatch, which is an active area of research, critical to clinical decisions associated with the treatment and determination of the therapeutic window for stroke patients.
Methods
MRI protocols were co-created with clinical radiologists based on standard protocol for stroke patients, and time intervals for successive acquisitions (24 hours, 3 days, 6 days, 28 days) were selected based on clinically significant time points.Dual flip angle spoiled gradient echo images (TE/TR = 1.47/4.09 ms) were used to calculate a T1 map for each animal. Angiography images that were obtained as part of each MR acquisition were used to isolate vasculature in the anatomy, and an arterial input function (AIF) was determined using code to search for the optimal curve shape within the vascular region. Following conversion to concentration and determination of the AIF for each animal, the tissue concentration curves were fitted to existing pharmacokinetic models in order to extract quantitative parameters such as the volume transfer constant, Ktrans, the fractional interstitial volume, ve, and the fractional plasma volume, vp.
Existing DCE-MRI analysis software packages were used to fit perfusion parameters7-9. These open-source packages were evaluated against synthetic data10 (QIBA), and image processing code based on ROCKETSHIP was written in Python to allow for further development of analysis techniques specific to this model. In order to optimise curve fitting techniques, an initial estimation of the parameters for the curve fitting function was set based on different regions of the sheep’s anatomy. Time delay effects in the contrast agent uptake, and the statistical noise distribution resulting from the image processing were also taken into account.
Results
Data from 20 animals was acquired and reported, at pre-stroke, 24 hours, 3 days, 6 days and 28 days post-stroke time-points. Figure 1 shows results from one of the processed datasets, showing Ktrans and vp maps, along with T1 weighted and DWI images. The infarct region in the sheep's diseased hemisphere can be visibly observed to evolve in the Ktrans and vp maps from 24 hours to 6 days.Conclusion
We believe this is the first time the temporal progression of perfusion changes due to stroke has been demonstrated in a reproducible, large animal model.Parameters calculated as part of this research may be used:
- as a point of comparison for data obtained in future from different stroke models (for example hemorrhagic stroke),
- for the measurement of the efficacy of potential future stroke therapies,
- for comparison of different perfusion imaging methods,
- to further characterise stroke pathophysiology and evolution in the ovine model,
- to help elucidate research into perfusion-diffusion mismatch and identify salvageable brain tissue.
Acknowledgements
We would like to thank Sunthara Rajan Perumal for the acquisition of the MRI and to acknowledge the facilities and technical assistance of the National Imaging Facility, a National Collaborative Research Infrastructure Strategy (NCRIS) capability, at LARIF, SAHMRI. We would also like to acknowledge Nawaf Yassi and Daniel Zappia for optimising the scan and sequence protocols used in this study.References
1. Hankey G. Stroke. Lancet Neurol. 2017;389(10069):641-654
2. Feigin V et al. Global, regional, and national burden of neurological disorders, 1990-2016: a systematic analysis for the Global Burden of Disease Study 2016. Lancet Neurol. 2019 May;18(5):459-480
3. O’Collins V et al. 1,026 experimental treatments in acute stroke. Ann Neurol. 2006 Mar;59(3):467-77
4. Sorby-Adams, A J et al. Large animal models of stroke and traumatic brain injury as translational tools. Am J Physiol Regul Integr Comp Physiol. 2018 Aug 1;315(2):R165-R190
5. Sorby-Adams A J et al. Determining the Temporal Profile of Intracranial Pressure Changes Following Transient Stroke in an Ovine Model. Front Neurosci. 2019 Jul 9;13:587
6. Wells A J et al. A surgical model of permanent and transient middle cerebral artery stroke in the sheep. PLoS One. 2012;7(7):e42157
7. Barnes, S et al. ROCKETSHIP: a flexible and modular software tool for the planning, processing and analysis of dynamic MRI studies. BMC medical imaging 2015; 15(19) (https://github.com/petmri/ROCKETSHIP)
8. Smith DS et al. DCEMRI.jl: a fast, validated, open source toolkit for dynamic contrast enhanced MRI analysis. PeerJ. 2015 Apr 23;3(909) (https://github.com/davidssmith/DCEMRI.jl)
9. Debus C et al. MITK-ModelFit: A generic open-source framework for model fits and their exploration in medical imaging – design, implementation and application on the example of DCE-MRI. BMC Bioinformatics. 2019 20(1)
10. QIBA_v4 Extended Tofts, 2009.04.16, D. P. Barboriak Lab, Duke University. Available online: https://sites.duke.edu/dblab/qibacontent/
Figures
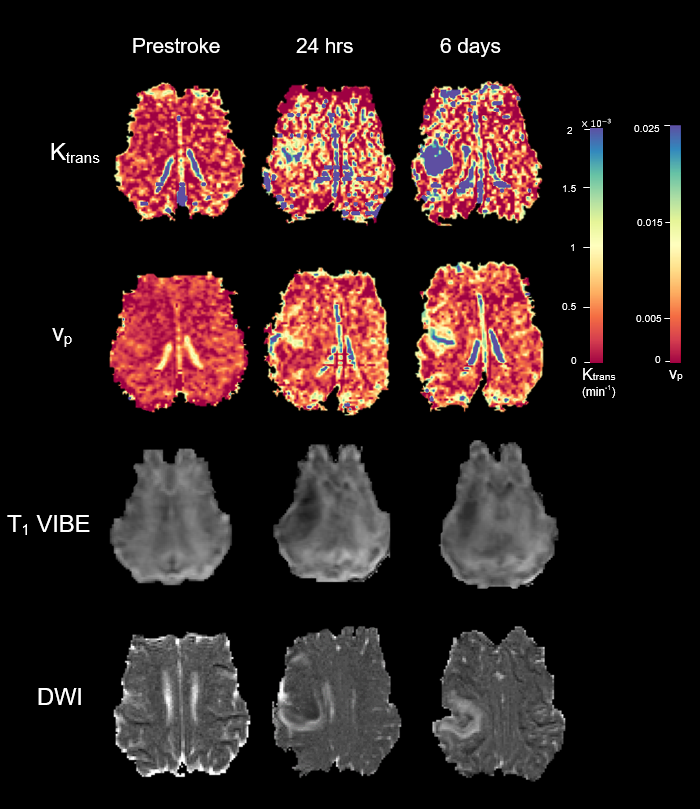
Perfusion map of Ktrans [min-1] (top row) and vp [arb.] (second row), T1 weighted images (third row), and diffusion weighted images (bottom row) of a single animal from before stroke, 24 hours post stroke, and 6 days post stroke.