4354
DTI-based Longitudinal Assessment of Stroke Recovery at 21.1 T1National High Magnetic Field Laboratory, Florida State University, Tallahassee, FL, United States, 2Chemical & Biomedical Engineering, FAMU-FSU College of Engineering, Tallahassee, FL, United States
Synopsis
This research utilizes DTI and graph theory to provide a method for monitoring the progression of structural stroke recovery at 21.1 T. Edema that occurs for multiple days post the initial ischemic limits the ability for tractography to be used for any meaningful connectivity analysis before day 5. After this initial phase, graph theory provides metrics for determining the progression of recovery in major white matter regions of the ischemic brain. This method could be utilized as a means for determining the efficacies of different treatments compare with standard stroke recovery.
Purpose
Stroke is the fifth leading cause of death and the leading cause of long-term disability in the United States, and is expected to rise with in the near future due to an aging population.1 Clinically, MRI is used to monitor stroke recovery by diffusion, perfusion and functional MRI (fMRI)2. The premise of this study is to evaluate the longitudinal impacts of structural changes during the recovery of acute stroke that may affect functional recovery.Methods
Animal Model: Male Sprague Dawley rats (220-250 g) were induced with 5% and maintained at 2% isoflurane. A rubber-coated filament (Doccol Corp) was guided 1.9 cm through the external carotid artery until the middle cerebral artery (MCA) was blocked, and blood flow interrupted to the brain. This transient Middle Cerebral Artery Occlusion (MCAO) was instituted for 1 h to achieve an ischemic lesion followed by reperfusion after removal of the filament. MCAO animals were compared to naïve controls.MR Techniques: Using the 21.1-T ultra-wide bore magnet at the US National High Magnetic Field Laboratory and linear 1H/23Na birdcage coil, high resolution images were acquired at acute and chronic time points post-MCAO. DTI data was acquired with a multi-slice 2D EPI scan using 18 diffusion encoding directions (nominal b = 1 ms/μm2) and one unweighted acquisition, with δ=3 ms and Δ=11 ms and using six segments to reduce susceptibility distortions. Each rat was imaged with an in-plane resolution of 200x200 μm, matrix size of 160x160, partial phase FT of 35%, slice thickness of 1 mm, repetition time of 5 s, echo time of 20 ms and 4 averages, resulting in an acquisition time of 38 min.
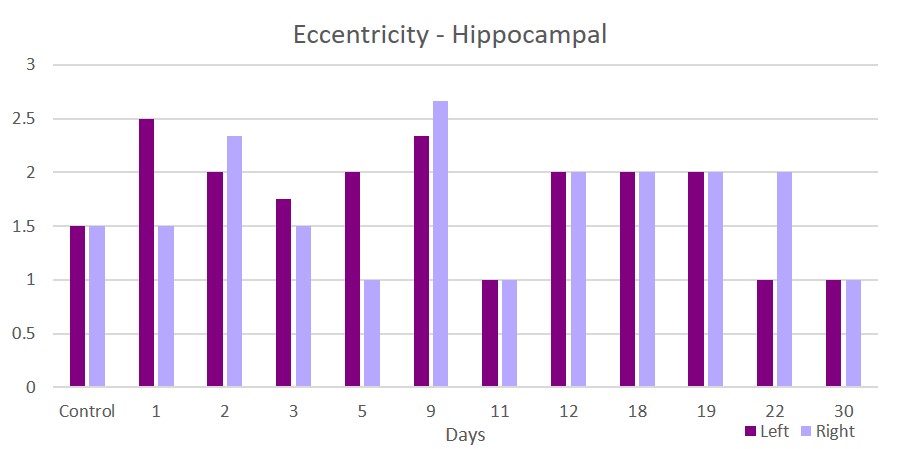
Data Analysis: DTI data was analyzed using DSI Studio3 to generate tracts using the following parameters: FA Threshold≥0.10, Angular Threshold≤60, Step Size=0.1 mm, Minimum Length=1 mm, Maximum Length=25 mm, and a whole brain termination after 106 tracts. Regions of interest (ROI) were selected as 14 equally spaced ellipsoids in the cortical regions and two ROI for each right and left hippocampi. The segmented nodes were categorized into four neural regions: Piriform, Temporal, Parietal and Hippocampus, and they were split into left and right hemispheric regions. Tract counts were imported into Gephi for extracting graph properties including: Degree & Weighted Degree, Clustering Coefficient, Closeness (betweenness, closeness, eigenvector & harmonic) and Eccentricity. A one-way ANOVA with a least significant difference post-hoc test were used to determine statistical significance (p<0.05) among samples.
Results & Discussion
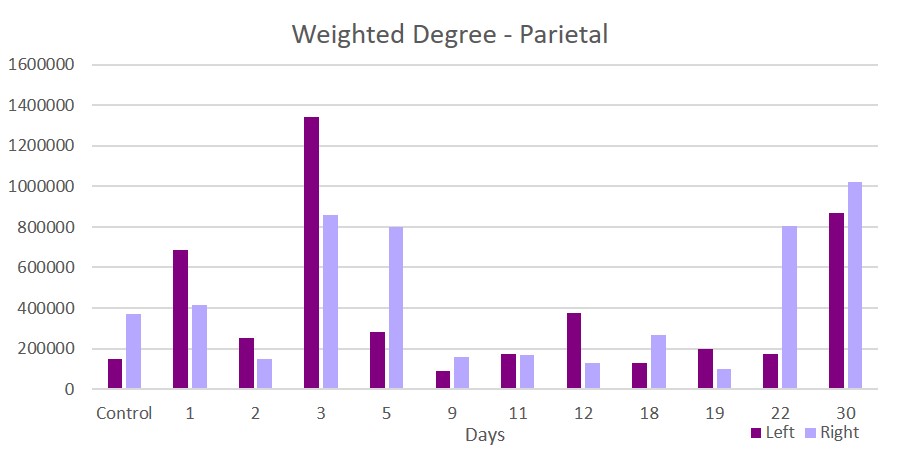
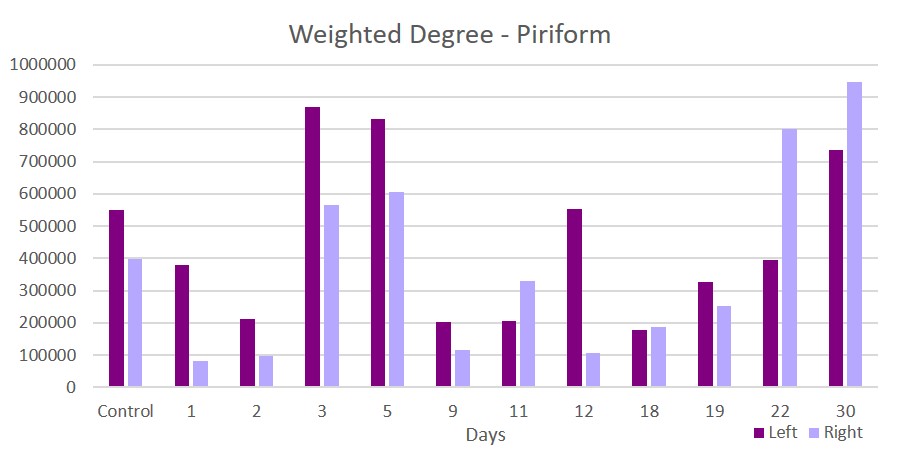
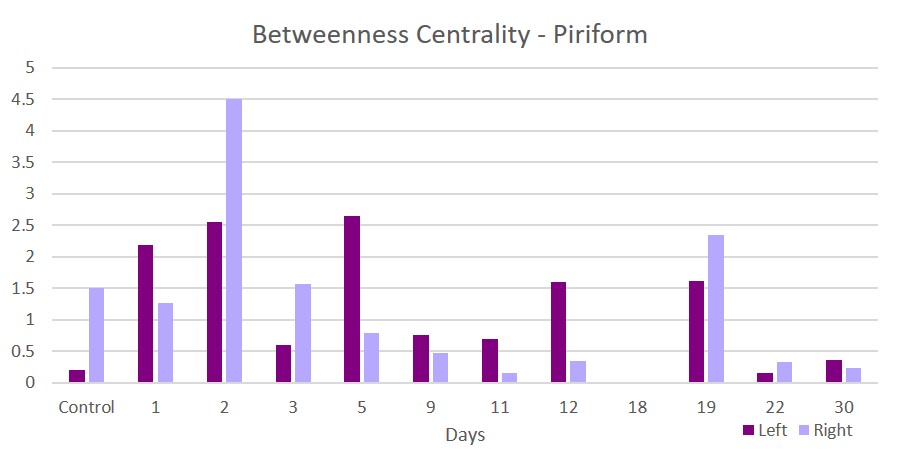
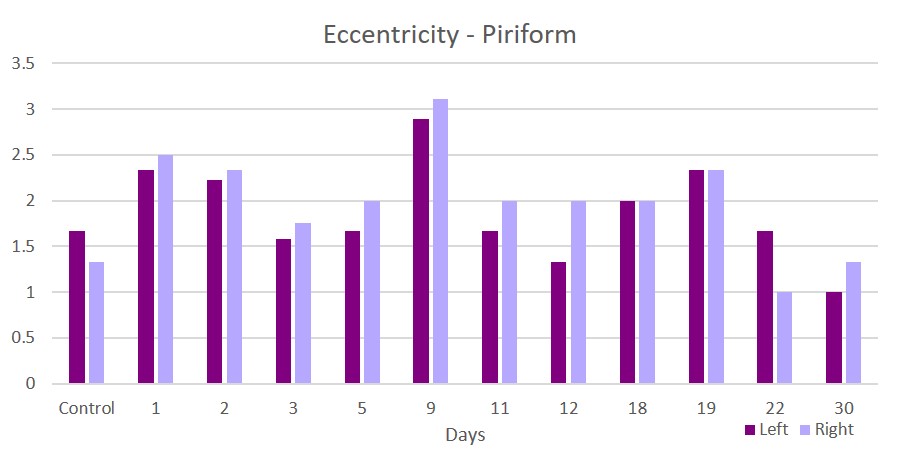
This acute study looked at early time points (up to day 30 post-ischemia) compared to naïve. Additionally, regions are segmented in left and ride hemispheric sides to better elucidate ipsi-(left) and contralateral (right) changes. Brain edema after ischemic stroke reaches its maximum extent in 3-5 days post stroke and causes an increase in tissue water by more than 100%4. With low fractional anisotropy (FA) thresholds used in the tractographic reconstruction, excessive water could cause overestimation in the number of fiber connections, leading to an increase in weighted degree. Similar spikes on day 3 are seen in the parietal (Figure 1) and piriform (Figure 2) regions. Betweenness centrality shows network reorganization occurring up to day 19 post-ischemia (Figure 3). Eccentricity, however, is time and region specific for which similar trends are apparent for different regions at later times but differing time and hemispheric trends are evident at earlier times (Figures 4 & 5).Conclusion
This research provides a method for monitoring the progression of stroke recovery and highlights the continuous degradation that occurs for multiple days after the stroke event, even after cerebral blood flow is restored. This work also underscores the importance for early treatments to provide the fastest route to recovery and minimize prolonged degradation. Additionally, this work will help to expand the application of DTI to other neurodegenerative diseases as well as its use as a metric for determining the efficacies of treatments applied to standard stroke recovery.Acknowledgements
This work was supported by the NIH (RO1-NS102395). The National High Magnetic Field Laboratory is funded by the NSF (DMR-1644779) and the State of Florida.References
1. Benjamin EJ, et al. 2017. AMA, Statistics Committee and Stroke Statistics Subcommittee.
2. Johansen-Berg H. Functional imaging of stroke recovery: what have we learnt and where do we go from here? Int J Stroke. 2007;2:7–16.
3. Yeh F, Verstynen TD, Wang Y, Fernández-Miranda JC, Tseng WI. 2013. Deterministic diffusion fiber tracking improved by quantitative anisotropy. PLoS One. 8(11): e80713.
4. Dostovic, Z., Dostovic, E., Smajlovic, D., & Avdic, O. (2016). Brain Edema After Ischaemic Stroke. Medical Archives, 70(5), 339. doi: 10.5455/medarh.2016.70.339-341
Figures