4351
Relationship between FVH and the blood perfusion, acid-base metabolism and edema in patients with acute/subacute infarction1The First Affiliated Hospital of Dalian Medical University, Da Lian, China, 2Philips Healthcare, Bei Jing, China
Synopsis
This study prospectively compared the differences of fluid-attenuated inversion recovery vascular hyperintensity (FVH) score and MR measurements between patients with mild-to-moderate and severe vascular stenosis, and analyzed the relationship between the FVH score and MRI measurements. It was found that the FVH score in severe-occlusion group were higher than those in mild-to-moderate stenosis group. In addition, FVH scores were positively correlated with the ratio of relative CBF2.5 value, and negatively correlated with the ADC value, indicating FVH score was correlated with collateral circulation and brain edema. No significant correlation was observed between the FVH score and amide-proton-transfer weighted measurement, suggesting that FVH had little effect on acid-base metabolism.
Introduction
A series of pathophysiological changes will occur after cerebral infarction, including blood flow perfusion, acid-base metabolism, cell edema and so on. As a compensatory mechanism of cerebral ischemia, the fluid-attenuated inversion recovery vascular hyperintensity (FVH) sign will affect these pathological changes to some extent [1]. At present, it is believed that the pathogenesis of FVH sign is caused by the opening of leptomeningeal collateral circulation[2]. Previous studies have shown that 3D-arterial spin labeling (3D-ASL) imaging has great potential in detecting absolute (aCBF) and relative (rCBF) cerebral blood flow values in ischemic regions and these values have great potential for the prognosis evaluation of cerebral infarction patients [3]. Studies also found that amide proton transfer weight (APTw) and apparent diffusion coefficient (ADC) values were significantly reduced in large infarctions in patients with high national institute of health stroke scale (NIHSS) and modified rankin scale (mRS) scores [4]. This study aims to explore the relationship between the FVH score and MR measurements including CBF, APTw and ADC values in patients with acute/subacute cerebral infarction caused by unilateral middle cerebral artery (MCA) stenosis or occlusion.Methods
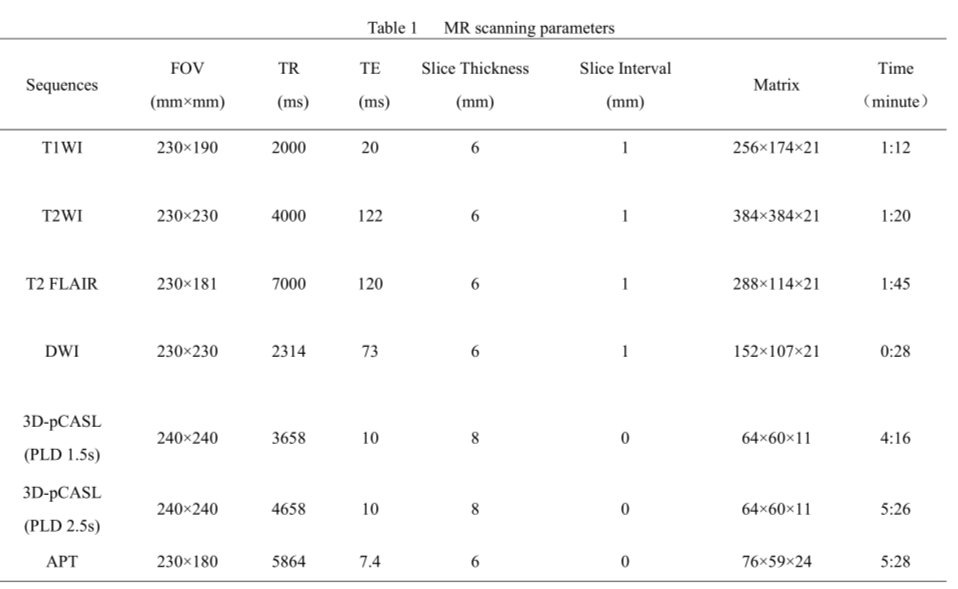
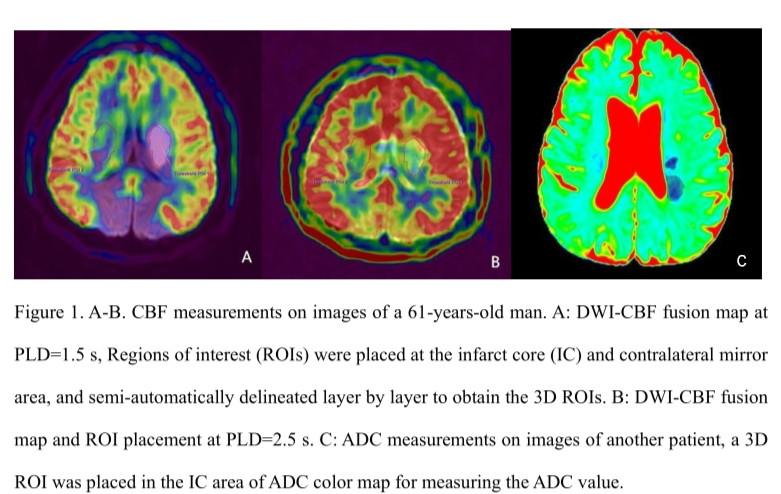
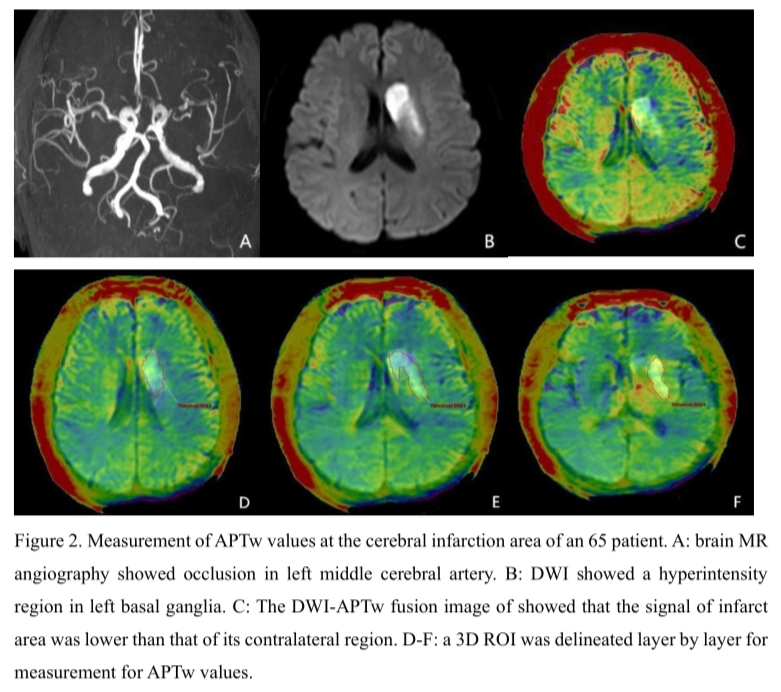
Twenty-six patients with acute or subacute cerebral MCA infarction were prospectively collected. The clinical base data for all patients were recorded. All MR images were acquired on a 3.0 T MRI scanner (Ingenia CX, Philips Healthcare, Best, the Netherlands) with an 8-channel receive-only head coil. All subjects underwent conventional MRI and DWI, APT and 3D-ASL sequences (Table 1). All patients were divided into mild-to-moderate and severe-occlusion groups based on the rate of middle cerebral artery stenosis assessed by the north american symptomatic carotid endarterectomy (NASCET) standard. The FVH on FLAIR were graded according to the modified Alberta Stroke Program Early CT score (ASPECTS) system. The rCBF and APTw images were fused with the DWI images at the workstation (IntelliSpace Portal, Philips Healthcare). 3D ROIs were drawn to outline the lesions on each layer of the infarct core (IC) and control area for calculation of rCBF (rCBF1.5, rCBF2.5) and APTw (maximum: APTwmax, minimum: APTwmin, and mean: APTwmean) values. The ratio of relative cerebral blood flow (rrCBF = rCBFlesion / rCBFnormal), difference of maximum and minimum APTw values (APTwmax-min), and ratio between mean APTw values of lesion and the normal tissue (rAPTwmean = APTwmean lesion/APTwmean normal) were calculated. The ADC value and DWI volume were measured on ADC and DWI images (Figure 1-2). Differences of rrCBF, APTw, ADC and DWI-volume values between the two groups were compared by independent sample t-test. Spearman correlation analysis were separately used to analyze the relationships between the FVH score and MRI parameters in all patients.Results
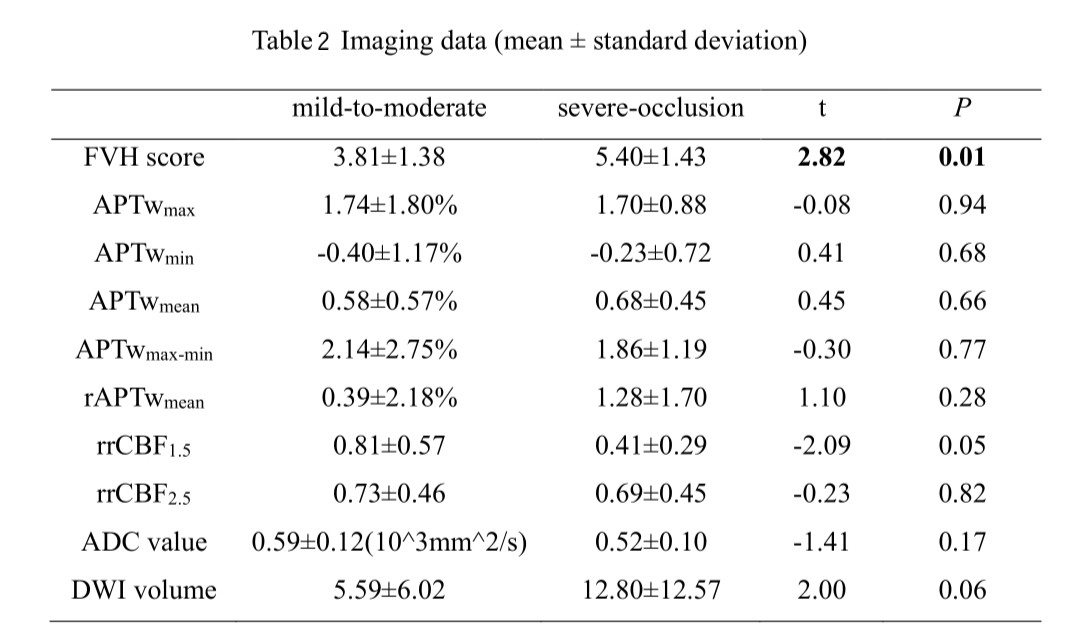
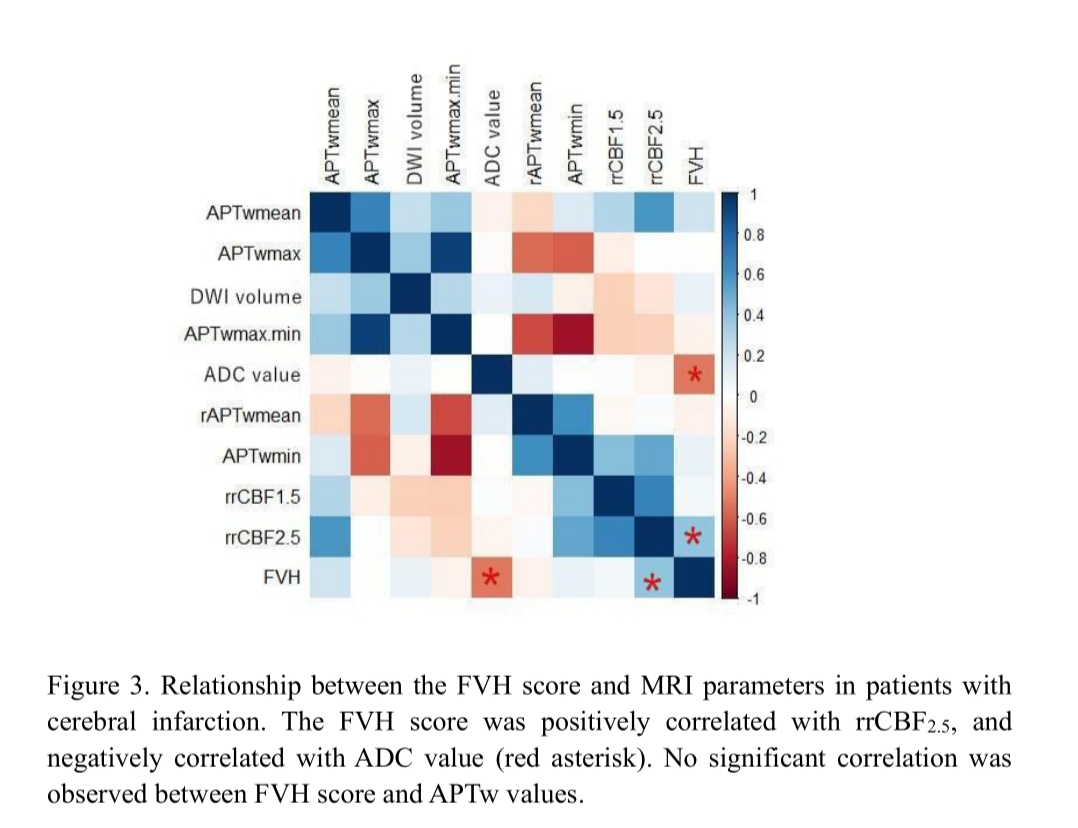
In twenty-six patients, the FVH scores of the severe group were significantly higher than those of the mild-to-moderate group (t=2.82,p=0.01, Table 2). On unified comparison, the FVH score was positively correlated with rrCBF2.5 (r=0.42, p=0.04), and negatively correlated with ADC value (r=-0.52,p=0.01). No significant correlation between the FVH score and APTw, rrCBF1.5, and DWI-volume values (all p > 0.05). (Figure 3).Discussion
In the early stage of cerebral infarction, the combined effect of lactic acid poisoning, ion transport disorders, and extracellular glutamate accumulation could result in a decrease in APT value; while in the subacute phase, the APTw value began to increase due to partial blood flow recovery and reperfusion [5-6]. Some studies [7] have also shown that the APTw value in hyperacute infarction and acute stage show high heterogeneity. These studies suggest that the APTw value varies greatly in different stages of ischemic brain tissue, which may result in no significant correlation between the FVH score and APTw values. Previous studies have shown that CBF1.5 is sensitive to ischemia, and CBF2.5 represents collateral blood flow. A positive correlation was observed between the FVH score and rrCBF2.5, indicating that the A larger FVH territory represents a better blood perfusion. The majority of patients enrolled in this study were with subacute cerebral infarction; in this stage, the FVH score has begun to reduce, while the water diffusion tends to increase, this pathological change is consistent with the negative correlation between the FVH score and ADC value observed in this study.Conclusion
The range of FVH is related to the stenosis of the responsible artery. The increased territory of FVH is correlated with higher blood perfusion and reduced water diffusion. FVH range has no significant effect on the acid-base metabolism and the hyperintensity volume in diffusion weighted imaging.Acknowledgements
No acknowledgement found.References
[1]Liu Dezhi,Scalzo Fabien,Rao Neal M et al. Fluid-Attenuated Inversion Recovery Vascular Hyperintensity Topography, Novel Imaging Marker for Revascularization in Middle Cerebral Artery Occlusion.[J] .Stroke, 2016, 47: 2763-2769.
[2]Apfaltrer Paul, Wenz Holger, Böhme Johannes, et al. FLAIR Vascular Hyperintensities Indicate Slow Poststenotic Blood Flow in ICA Stenosis. [J] .Clin Neuroradiol, 2020, undefined: undefined.
[3]Aracki-Trenkic Aleksandra,Law-Ye Bruno,Radovanovic Zoran et al. ASL perfusion in acute ischemic stroke: The value of CBF in outcome prediction.[J] .Clin Neurol Neurosurg, 2020, 194: 105908.
[4]Momosaka Daichi,Togao Osamu,Kikuchi Kazufumi et al. Correlations of amide proton transfer-weighted MRI of cerebral infarction with clinico-radiological findings.[J] .PLoS One, 2020, 15: e0237358.
[5]Boese A C, Le Q S E, Pham D, et al. Neural stem cell therapy for subacute and chronic ischemic stroke[J]. Stem cell research & therapy, 2018, 9(1): 154.
[6]Zöllner J P, Hattingen E, Singer O C, et al. Changes of pH and energy state in subacute human ischemia assessed by multinuclear magnetic resonance spectroscopy[J]. Stroke, 2015, 46(2): 441-446.
[7]Guodong S , Chunmei L , Xiaojie L , et al. Evolution of Cerebral Ischemia Assessed by Amide Proton Transfer-Weighted MRI[J]. Frontiers in Neurology, 2017, 8.
Figures