4349
Feasibility of amide proton transfer weighted imaging in the diagnosis of patients with symptomatic intracranial artery stenosis1The First Affiliated Hospital of Shandong First Medical University, Jinan, China, 2MR Research China, GE Healthcare, Beijing, China
Synopsis
The main purpose was to explore the feasibility of amide proton transfer weighted (APTw) imaging in diagnosing patients with symptomatic intracranial artery stenosis (SIAS). 27 patients with severe intracranial artery stenosis (≥ 70%) or occlusion diagnosed by DSA but without infarction were recruited for MRI measurement. Compared to the contralateral area, higher APT relevant MTRasym ratio and lower cerebral-blood-flow (CBF) measured by 3D arterial-spin-labeling imaging were found in the abnormal blood supply area by the corresponding ipsilateral vessels. With these findings, APTw imaging may thus be used as an effective method providing added clinical value in diagnosing of SIAS.
Introduction
Intracranial artery stenosis(IAS)is a very common independent risk factor for stroke. The diagnosing value of 3D arterial-spin-labeling (ASL) in IAS patients has been confirmed[1,2]. After the decrease of cerebral blood perfusion, the cellular metabolic state of ischemic brain tissue changes and potential pH changes may exist. 3D-ASL imaging however is not able to provide this measurement.Amide proton transfer weighted(APTw)imaging, relying on the exchange between amide mobile and water protons, has been reported to be sensitive to intracellular pH changes[3,4]. With this feature, APTw imaging has been applied in the diagnosis of acute cerebral infarction, the recognition of penumbra and the accurate stratification of infarct area[5,6]. However, no relevant research has so far been implemented to confirm whether the cerebral metabolism changes in low perfusion area of symptomatic intracranial artery stenosis (SIAS) patients but no infarct lesions.
Therefore, the main purpose of this study was to explore the feasibility of APTw imaging in diagnosing SIAS patients.
Materials and Methods
Subjects27 patients (19 males vs 8 females; age range, 55.70 ± 9.60 years) with severe intracranial artery stenosis (≥ 70%) or occlusion diagnosed by DSA but without infarction were recruited in this study and underwent MRI examinations.
MRI experiments
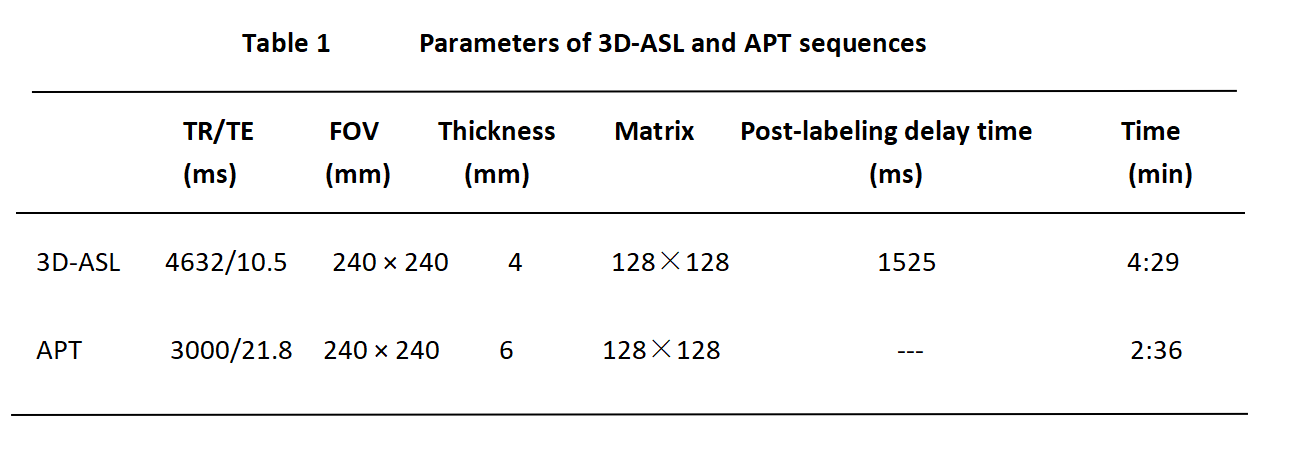
All MRI experiments were performed on a 3.0T MRI scanner (GE Discovery MR750, USA) with a 32-channel head coil. In addition to routine anatomical imaging (T2-weighted), 3D -ASL and APTw imaging were also performed for each patient. Single slice spin-echo echo-planar-imaging based APTw imaging was acquired on an axial slice including the maximum low-perfusion area according to the T2w images. Images at 52 frequencies were acquired, including 49 frequencies ranging from -600 to 600 Hz with an increment of 25 Hz. The applied saturation B1 power was 2µt and the saturation duration was 2000ms. Other scan parameters of APTw imaging as well as 3D fast spin echo based ASL imaging were shown in Table.1. Total scan time was 7mins 5s.
Data analysis
All acquired data were analyzed using vendor-provided APT or 3D-ASL postprocessing software at GE workstation 4.6. The resultant MTRasym ratio for APTw imaging and 3D-ASL derived CBF mapping were obtained, respectively. Two senior radiologists were employed for data analysis. On the slice with the maximal low perfusion area of T2w anatomical images, three regions of interest (ROI)s with comparable area (0.5-0.7cm2) were chosen by each radiologist. Mirrored ROIs at the contralateral side were also delineated. These ROIs were further copied to MTRasym and CBF maps. The corresponding mean values of MTRasym and CBF were obtained for further statistical analyses.
Statistical analysis
All statistical analyses were performed in Graphpad prism and IBM SPSS 23.0. The inter-class correction coefficient (ICC) was used to evaluate the inter-observer agreement of measuring MTRasym and CBF between both radiologists. ICC>0.75 was considered good reproducibility. Paired t-test was separately used to analyze the difference of MTRasym or CBF between the ipsilateral and contralateral ROIs. Receiver-operating-characteristic curve (ROC) analysis and area under the ROC curve (AUC) were used to evaluate the diagnostic efficacy of APTw imaging and 3D-ASL imaging in SIAS. Significant threshold was set as p <0.05.
Results
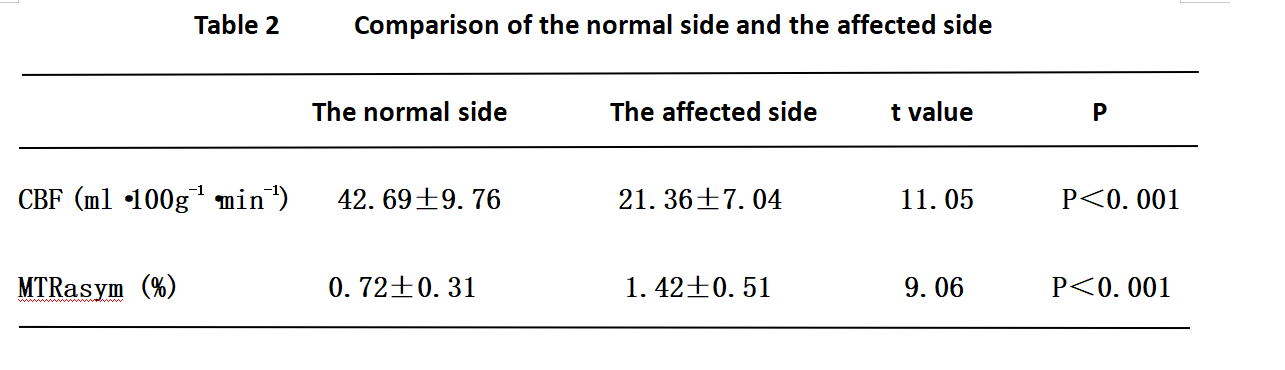
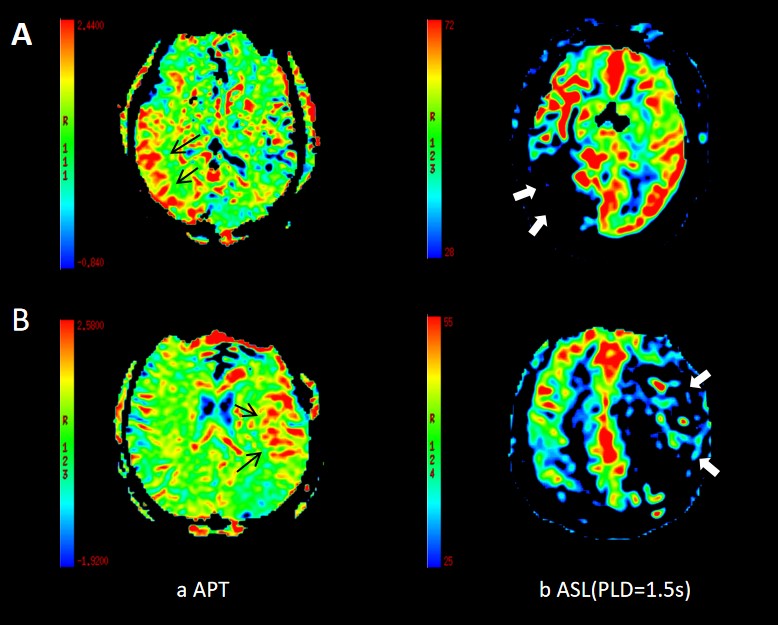
Using ICC analysis, high inter-agreements of MTRasym (0.920) and CBF (0.992) measurements between both radiologists were confirmed.With paired-t test, the stenosis side showed significantly lower CBF and higher MTRasym than the contralateral side (CBF:42.69±9.76 vs 21.36±7.04; MTRasym:0.72±0.31 vs 1.42±0.51;p < 0.05; Table 2 and Fig.1).
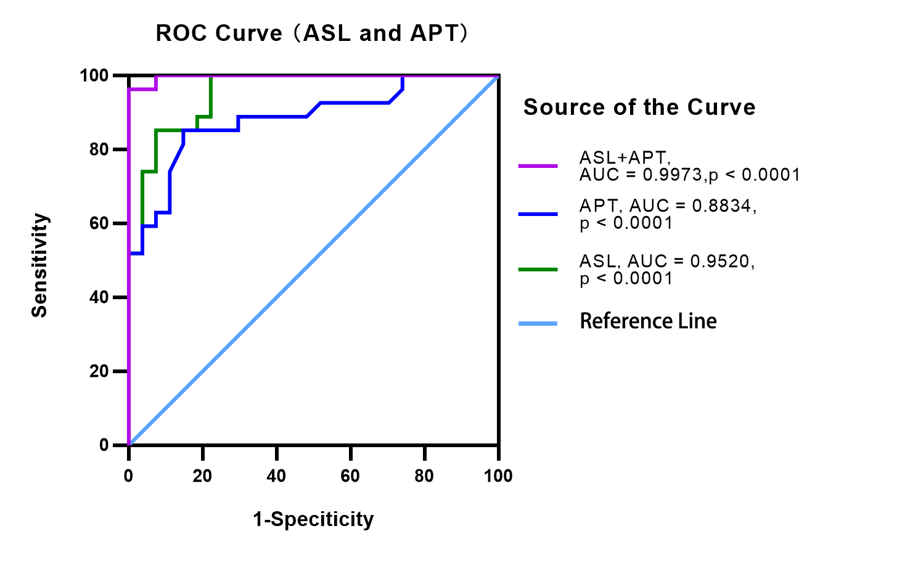
Using ROC analysis (Fig.2), for 3D-ASL derived CBF, good diagnostic efficacy (AUC=0.952, P<0.001) was obtained with sensitivity of 85.19% and specificity of 92.59%. Slightly low diagnostic efficacy (AUC=0.883,P<0.001) was revealed for APTw imaging with sensitivity of 85.19% and specificity of 85.19%. However, combing APTw and 3D-ASL imaging , the best diagnostic efficacy (AUC=0.997,P<0.001) in SIAS patients without infarction was obtained, the corresponding sensitivity is 96.3% and the specificity is 100%. As shown in Fig.2, the ROC curve showed the sensitivity and specificity values of APT and 3D-ASL in the diagnosis of symptomatic intracranial artery stenosis. The diagnostic value of 3D-ASL (AUC=0.952, P<0.001) was higher than that of APT(AUC=0.883,P<0.001), and the combined diagnosis of 3D-ASL and APT(AUC=0.997,P<0.001) showed the best diagnostic performance.
Discussion and conclusions
In this study, we explored the feasibility of APTw imaging in the diagnosis of symptomatic intracranial artery stenosis. In addition to the decreased CBF found in SIAS patients, increased APTw related MTRasym ratio was found in patients suffering from long-term ischemia and hypoxia. Abnormal brain metabolism may be one cause of recurrent symptoms in patients. Using ROC analysis, the combined 3D-ASL and APTw imaging can provide robust diagnostic performance of SIAS.In conclusion, APTw imaging may be used as one effective method in diagnosing symptomatic intracranial artery stenosis, and provide additional clinical value on the basis of 3D-ASL imaging.
Acknowledgements
We thank Weiqiang Dou from GE Healthcare for this valuable support on the 3D-ASL and APT sequences.References
[1] Lyu J, Ma N, Tian C, et al. Perfusion and plaque evaluation to predict recurrent stroke in symptomatic middle cerebral artery stenosis. Stroke Vasc Neurol, 2019, 4(3):129-134.
[2] Li Z, Li N, Qu Y,et al. Application of 3.0T magnetic resonance arterial spin labeling (ASL) technology in mild and moderate intracranial atherosclerotic stenosis. Exp Ther Med, 2016, 12(1):297-301.
[3] Zhou J, Wilson DA, Sun PZ, et al. Quantitative description of proton exchange processes between water and endogenous and exogenous agents for WEX, CEST, and APT experiments. Magn Reson Med, 2004, 51(5):945-952.
[4] Zhou J, Payen JF, Wilson DA, et al. Using the amide proton signals of intracellular proteins and peptides to detect pH effects in MRI. Nat Med, 2003, 9(8):1085-1090.
[5] Guo Y, Zhou IY, Chan ST, et al. PH-sensitive MRI demarcates graded tissue acidification during acute stroke -PH specificity enhancement with magnetization transfer and relaxation-normalized amide proton transfer (APT) MRI. Neuroimage, 2016, 141:242-249.
[6] Wang E, Wu Y, Cheung JS, et al. Mapping tissue PH in an experimental model of acute stroke - Determination of graded regional tissue pH changes with non-invasive quantitative amide proton transfer MRI. Neuroimage, 2019; 191:610-617.
Figures