4347
Using diffusion microstructure distributions for prediction of motor outcomes in stroke recovery1UCAIR, Dept. of Radiology and Imaging Sciences, University of Utah, Salt Lake City, UT, United States
Synopsis
We investigate the potential advantages of using distribution-valued variables to capture image information instead of the conventional techniques which use mean values to represent entire regions-of-interest. Using distribution-based distances in comparison with a mean-based approach, we explore various models to predict motor performance recovery in stroke patients. Our experiments indicate that for predictor variables Orientation Dispersion index and the Restricted Diffusion Index (diffusion scalars derived from the NODDI model), the distribution representations can lead to significantly improved regression models, over the respective mean values. Additionally, using the baseline Fugl-Meyer scores to predict follow-up Fugl-Meyer scores further enhances the model statistics.
Introduction
Regions-of-interest (ROIs) in medical images are often summarized using the ‘mean’ value of the parameter of interest within these regions. This oversimplification early in the pipeline can lead to a loss of variability information which can hold critical differentiating power later in the analysis. In this work, we propose using distribution-valued variables for representing information from image neighborhoods. This allows us to retain the nuances of the underlying image information in a structured manner and can be used to build more powerful regression models.Regression modeling requires the concept of ‘distance’ between observations to estimate statistics like the mean and variance. To extend this to the current context, we use probabilistic distances between probability density functions (PDFs) captured from ROIs. Our driving application is the prediction of motor performance recovery in stroke patients. Baseline measurements of microstructure derived from diffusion-weighted images are known to be predictive even when using ROI mean-based analysis. Here we quantify the improvements provided by the inclusion of distribution-based distances. We also test the ability of PDFs of diffusion parameters combined with baseline measurements of a clinical motor score, the Fugl-Meyer Upper Extremity (FMUE) to predict follow-up FMUE scores.
Method
Previous work has highlighted the importance of the PLIC region for analysis involving motor functions.1 Much of this work involves Fractional Anisotropy (FA) values expressed as a ratio or differences acquired from inter-hemispheric information.2,3Recent work has also highlighted that NODDI parameters like the Orientation Dispersion Index (ODI) and neurite density (or RDI- Restricted Diffusion Index) correlates with motor recovery. Most of these studies use the mean differences of FA or ODI values from ROIs in the ipsilesional and contralesional sides. Instead, we find the inter-hemispheric differences as the Wasserstein distance between the respective PDFs. The Wasserstein distance (also known as the Earth Mover’s distance) is a distance metric, unlike other probabilistic distances like the Kullback Leibler divergence.4,5 It intuitively quantifies the distance as the transformation of one PDF into another while respecting the underlying geometry of the domain of the measurement variable. Using this metric, we explore different regression models using baseline measurements as the predictor variables and the follow-up FMUE scores (FMUE-TP2) as the response variable. Our predictor variables include: FMUE scores at time point 1 (FMUE-TP1), and diffusion parameters derived from the NODDI model- ODI and RDI.6 8 stroke patients were imaged on a 3T scanner with diffusion spectrum imaging (203 directions, max b=4000).7 The MRI scans were acquired in the subacute phase (at 9±6 days post-stroke), and baseline FMUE measurements were performed within 1-2 days of the MRI scans. Follow-up FMUE assessment was performed at 53±21 days after stroke.Results and discussion
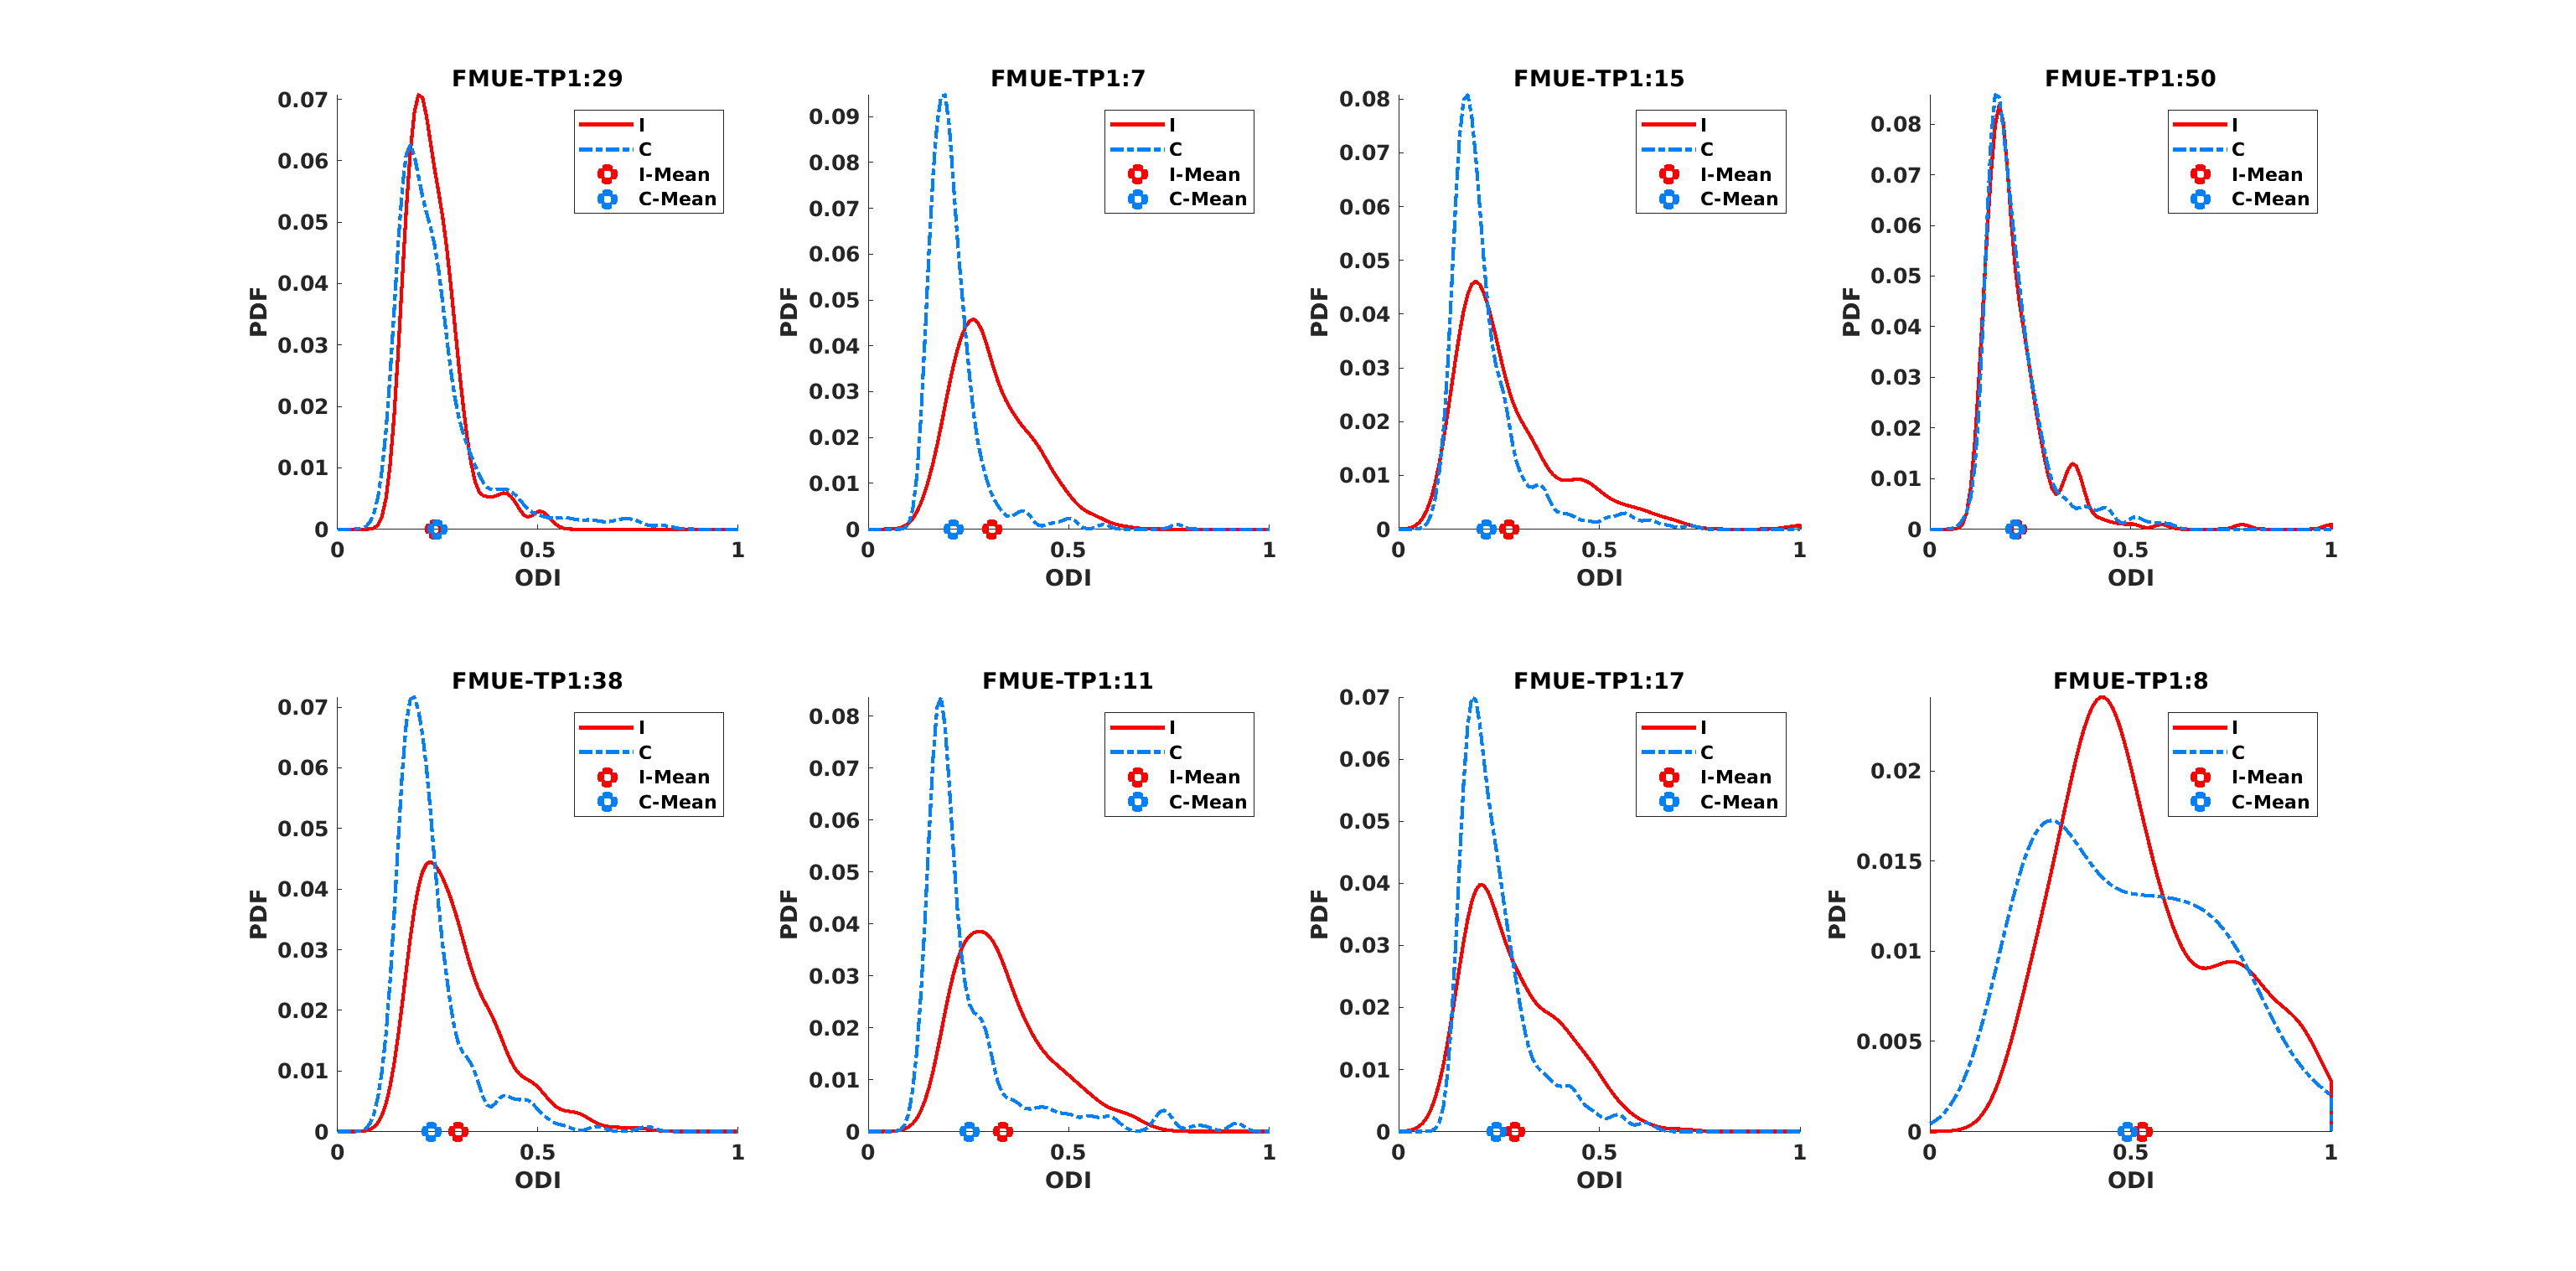
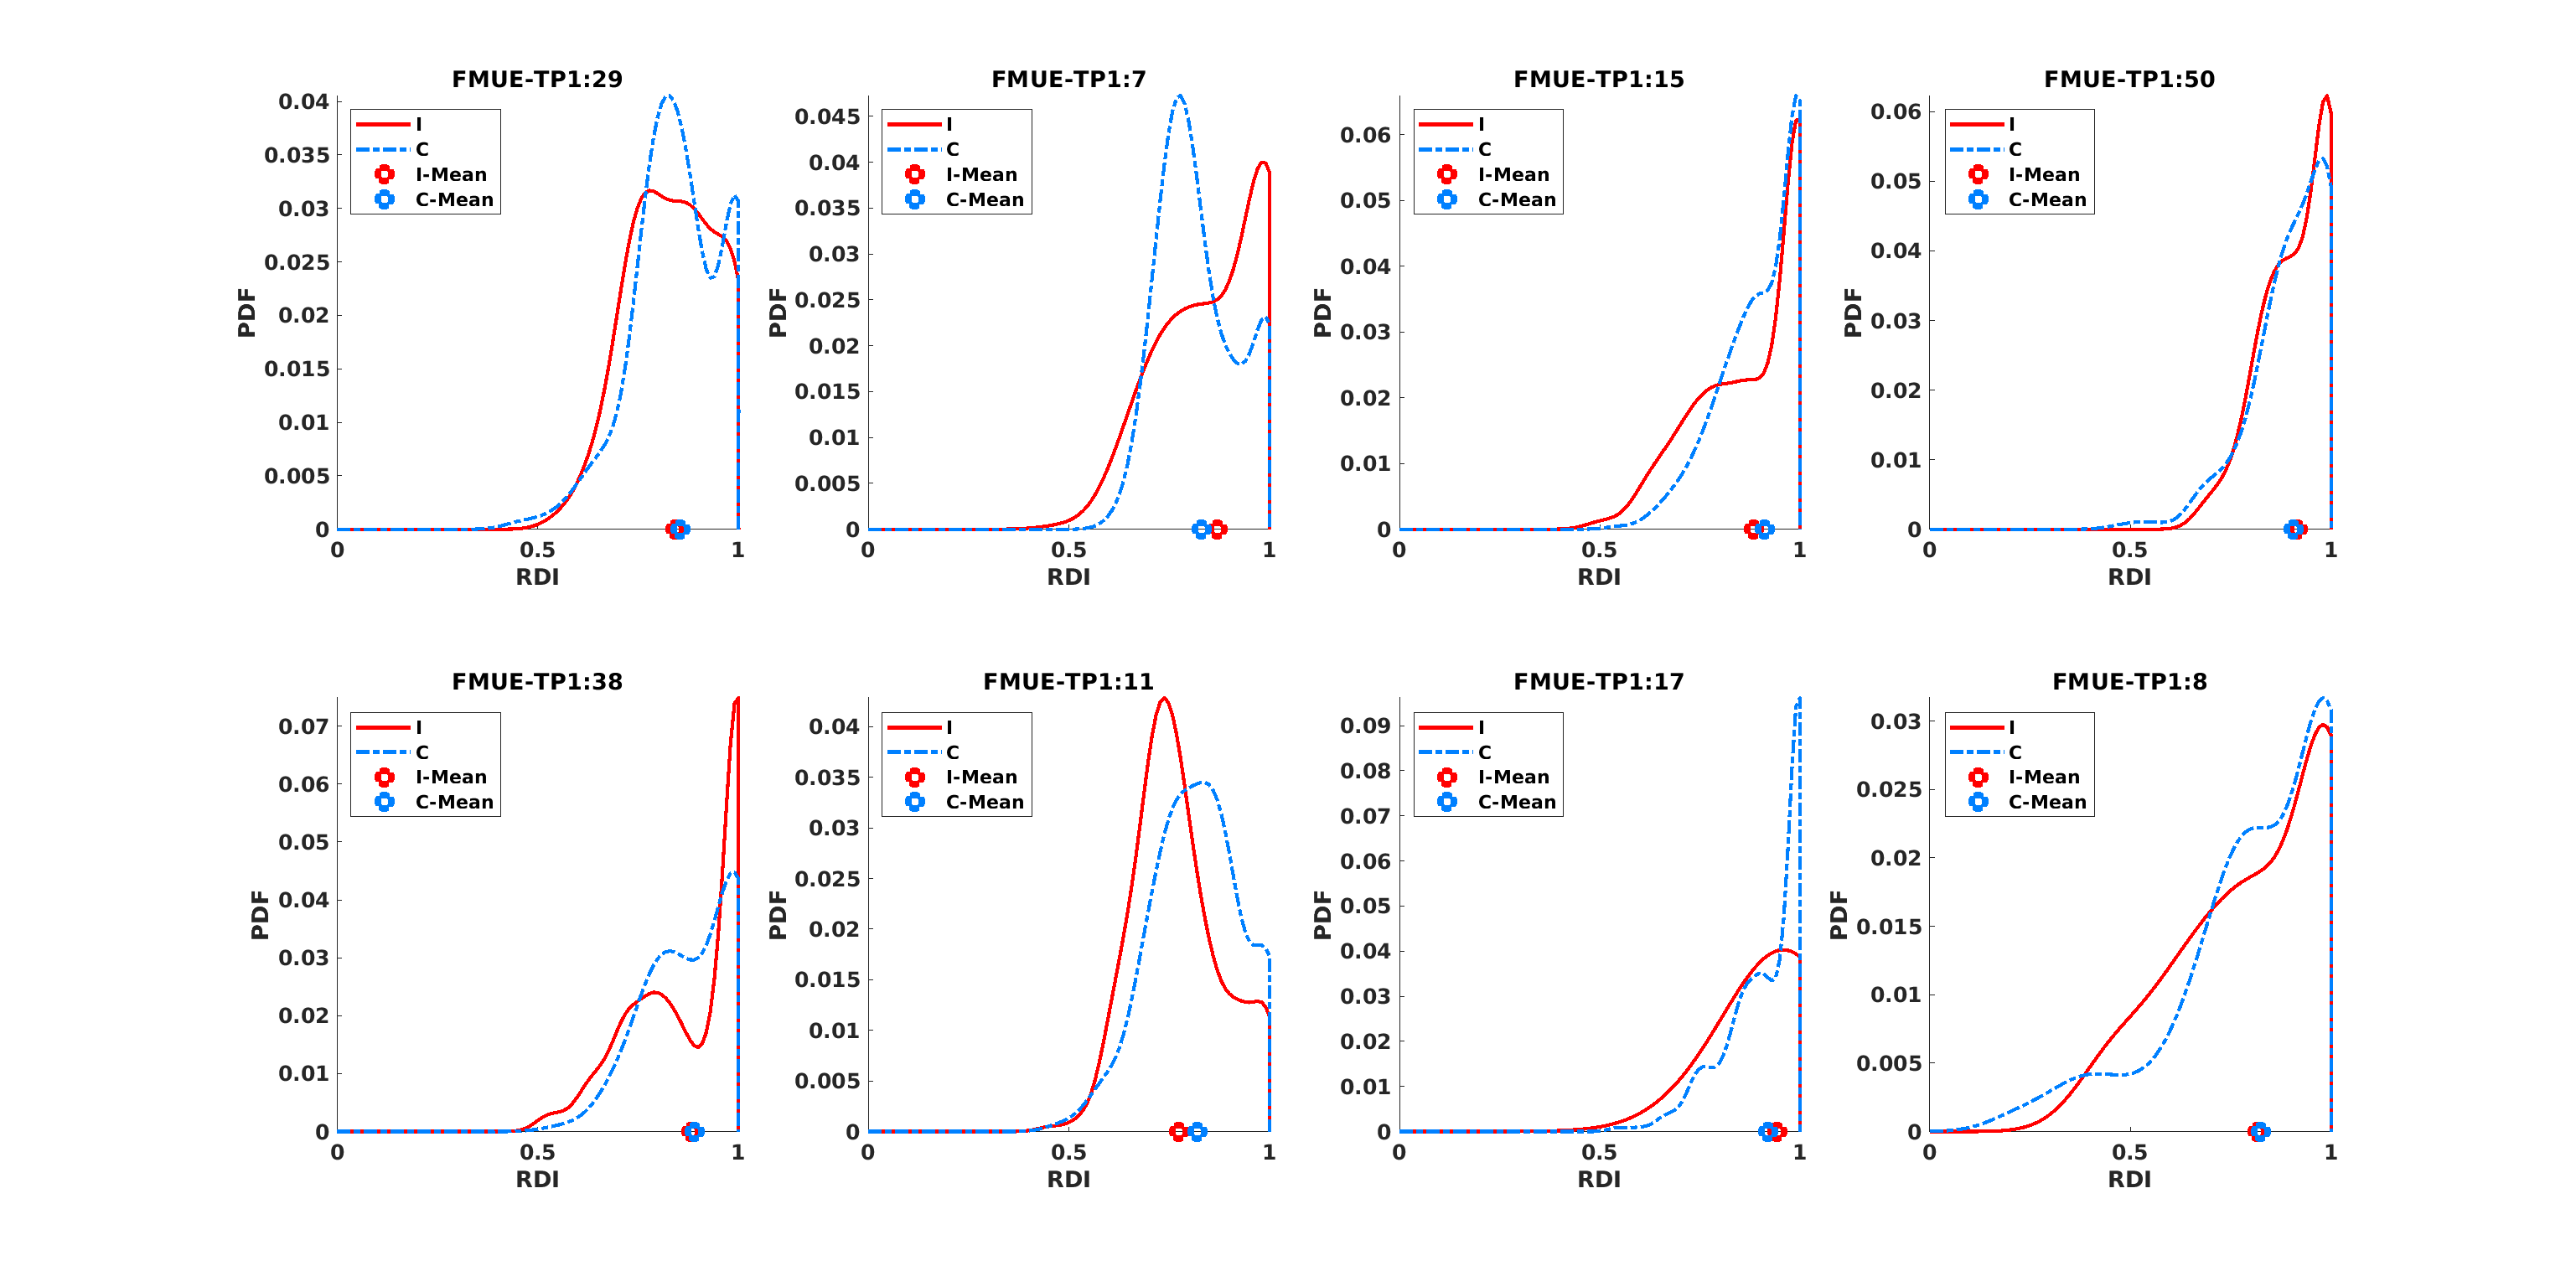
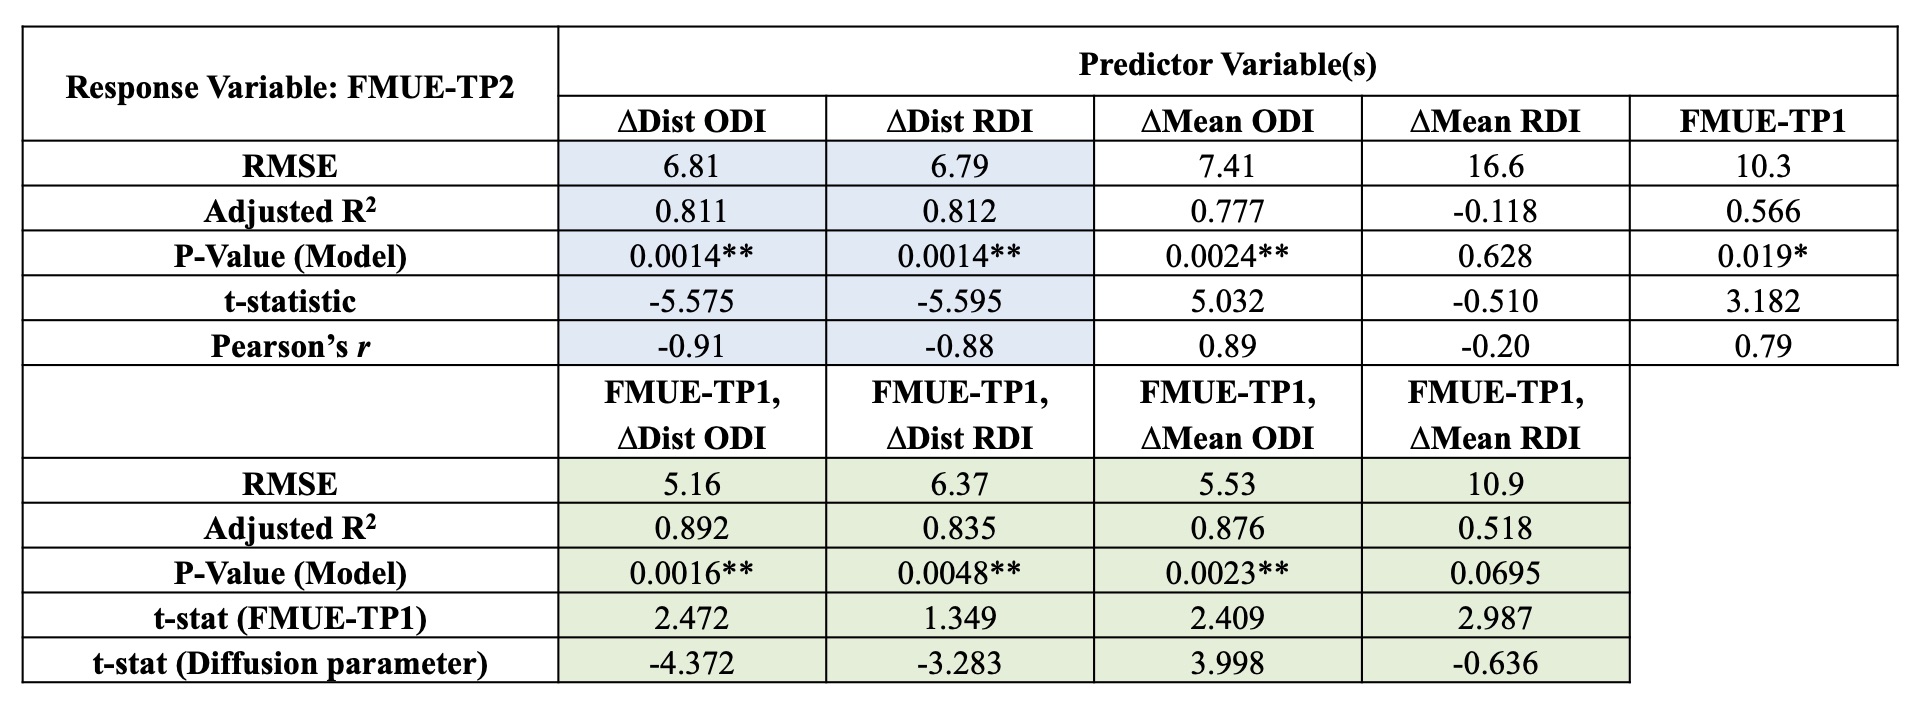
Table 1 shows results for the analyses using the ipsi- and contralateral PLIC regions. We first estimate a linear model: FMUE-TP2 as the response variable, and interhemispheric difference in the mean-values of the individual diffusion parameters (ΔMean ODI, ΔMean RDI) as the predictor variable. Next, we replace the mean-based differences with the Wasserstein-distances between the ipsilesional and contralesional PLIC distributions (ΔDist ODI, ΔDist RDI). We report our results in terms of the model RMSE, coefficient of determination (R2 adjusted for the number of variables), p-value (jointly for the model), t-statistic for the predictor variables and Pearson’s correlation coefficient r (when using a single predictor). Even with a single predictor variable, through reduced RMSE and p-values, increased R2 and r, and significant t-statistics, distribution-based analysis shows improvement over the corresponding mean-based models.Especially of interest are the results for RDI where a negative R2 and very low r show that mean RDI values provide an ineffective model with no prediction power. However, RDI distributions remarkably improve the differentiating capacity of this variable. See the distribution plots for ODI and RDI in Fig. 1 and 2. For some subjects, the mean values almost coincide which can be misleading and can lead to a loss of statistical power in a data set that is already relatively small.
Next, we use FMUE-TP1 as the only predictor variable (Table 1) to show that it can independently predict FMUE-TP2 reasonably well. Joint use of FMUE-TP1 and either ODI or RDI improved predictive capability (Table 1, lower block of results). These results again show the potential gains from using distributions over mean values (specially for RDI) as well as adding FMUE-TP1 as a predictor variable. Overall, the best linear model for these datasets uses FMUE-TP1 and ΔDist ODI as the two predictor variables. We have currently refrained from using three predictor variables jointly as our sample size is limited and we risk overfitting when adding another variable.
Conclusion
Distribution-valued variables highlight and detect underlying differences which may be missed when using mean values to represent image regions. These probabilistic representations of the data exhibit the potential to improve distinguishing power in regression models. The ‘information gain’ achieved via retaining distributions can particularly help in offsetting the limitations posed by limited sample sizes. The combination of baseline clinical FMUE score and NODDI diffusion parameters (ODI and RDI) show promising results in their ability to quantify future recovery. If validated in larger datasets, this may allow for more efficient clinical management.Acknowledgements
No acknowledgement found.References
- Song J, Young B M, Nigogosyan Z, et al. Characterizing relationships of DTI, fMRI, and motor recovery in stroke rehabilitation utilizing brain-computer interface technology. Front. Neuroeng. 2014;7:31.
- Moura L M, Luccas R, De Paiva J P, et al. Diffusion tensor imaging biomarkers to predict motor outcomes in stroke: a narrative review. Front. Neurol. 2019;10:445.
- Groisser B N, Copen W A, Singhal A B, et al. Corticospinal tract diffusion abnormalities early after stroke predict motor outcome. Neurorehabil. Neural Repair. 2014;28(8):751-760.
- Peyré G, Cuturi M. Computational Optimal Transport: With Applications to Data Science. Found. Trends Mach. Learn. 2019;11(5-6):355-607.
- Sharma A, Gerig G. Trajectories from Distribution-Valued Functional Curves: A Unified Wasserstein Framework. In Med. Image Comput. Comput. Assist. Interv. (MICCAI). October 2020;343-353. Springer, Cham.
- Zhang H, Schneider T, Wheeler-Kingshott C A, et al. NODDI: practical in vivo neurite orientation dispersion and density imaging of the human brain. NeuroImage. 2012;61(4):1000-1016.
- Hodgson K, Adluru G, Richards L G, et al. Predicting motor outcomes in stroke patients using diffusion spectrum MRI microstructural measures. Front. Neurol. 2019;10:72.
Figures