4346
Is Arterial Spin Labeling Effective in Measuring Cerebrovascular Reactivity? A Test-retest Study on Impact of Labeling Efficiency1Bioengineering, Stanford University, Stanford, CA, United States, 2Radiology, Stanford University, Stanford, CA, United States, 3Medical Imaging, UC Davis, Davis, CA, United States, 4Taipei Medical University, Taipei, Taiwan, 5University College London Hospitals, London, United Kingdom, 6University of California Riverside, Riverside, CA, United States, 7Tokyo Medical. and Dental University, Tokyo, Japan, 8GE Healthcare, Menlo Park, CA, United States
Synopsis
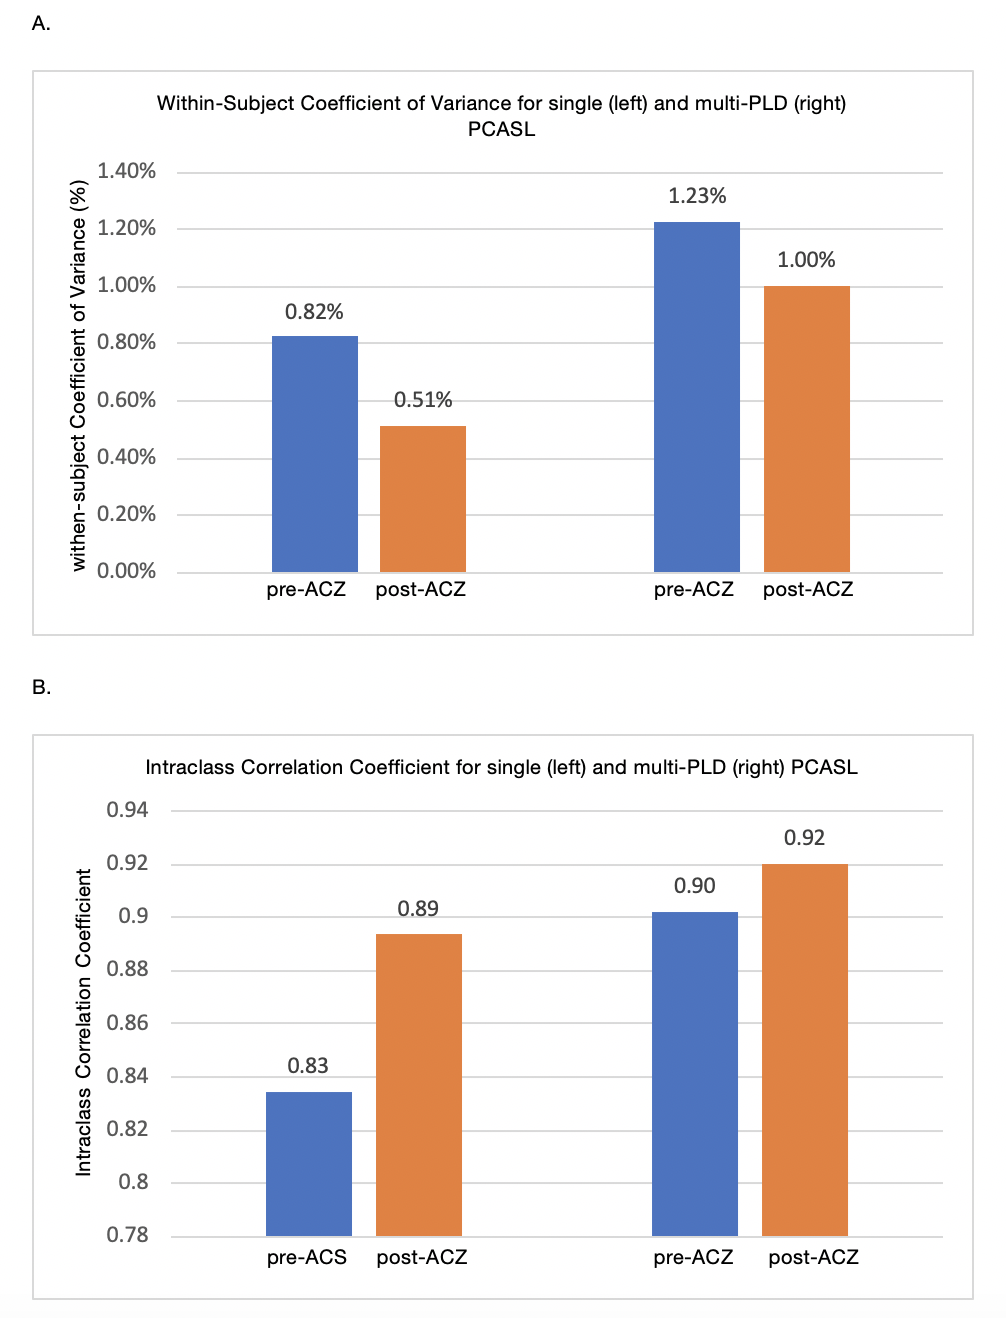
In this study, we examined repeatability of labeling efficiency of single- and multi-PLD arterial spin labeling (ASL) MRI before and after vasodilation in 15 normal subjects. Individual measurements of hematocrit and flow velocity in the carotid and vertebral arteries, obtained by phase-contrast (PC) MRI, were used to assess the labeling efficiency for both ASL methods. Our results showed that both labeling techniques achieved high repeatability before and after vasodilation (within-subject Coefficient of Variance pre-ACZ: 0.82 and 1.23%, and post-ACZ: 0.51 % and 1.00%).
Introduction
Cerebrovascular reactivity (CVR) reflects the brain’s capacity to respond to physiological changes and can be used to predict the risk of cerebrovascular diseases [1]. CVR can be measured by the changes in cerebral blood flow (CBF) during a brain stress test where CBF is altered by a vasodilator such as acetazolamide (ACZ) [2]. Currently, the gold standard to measure CBF is PET imaging, but the procedure is invasive and also inaccessible to many patients. Arterial spin labeling (ASL) is a non-invasive and quantitative MRI method to measure CBF. Although single post labeling delay pseudo continuous ASL (single-PLD PCASL) is the recommended technique to measure CBF at rest [3], its accuracy and repeatability may decline in CVR studies due to the variations in labeling efficiency induced by the vasodilator [4]. The labeling efficiency can be estimated using flow velocity data obtained from phase-contrast MRI and hematocrit from blood tests [5].In this study, we compare the labeling efficiency of two PCASL techniques in a test-retest study including 15 normal subjects. The repeatability of the labeling efficiency was evaluated using within-subject Coefficient of Variance (wsCV) and Intraclass Correlation Coefficient (ICC).
Materials and Methods
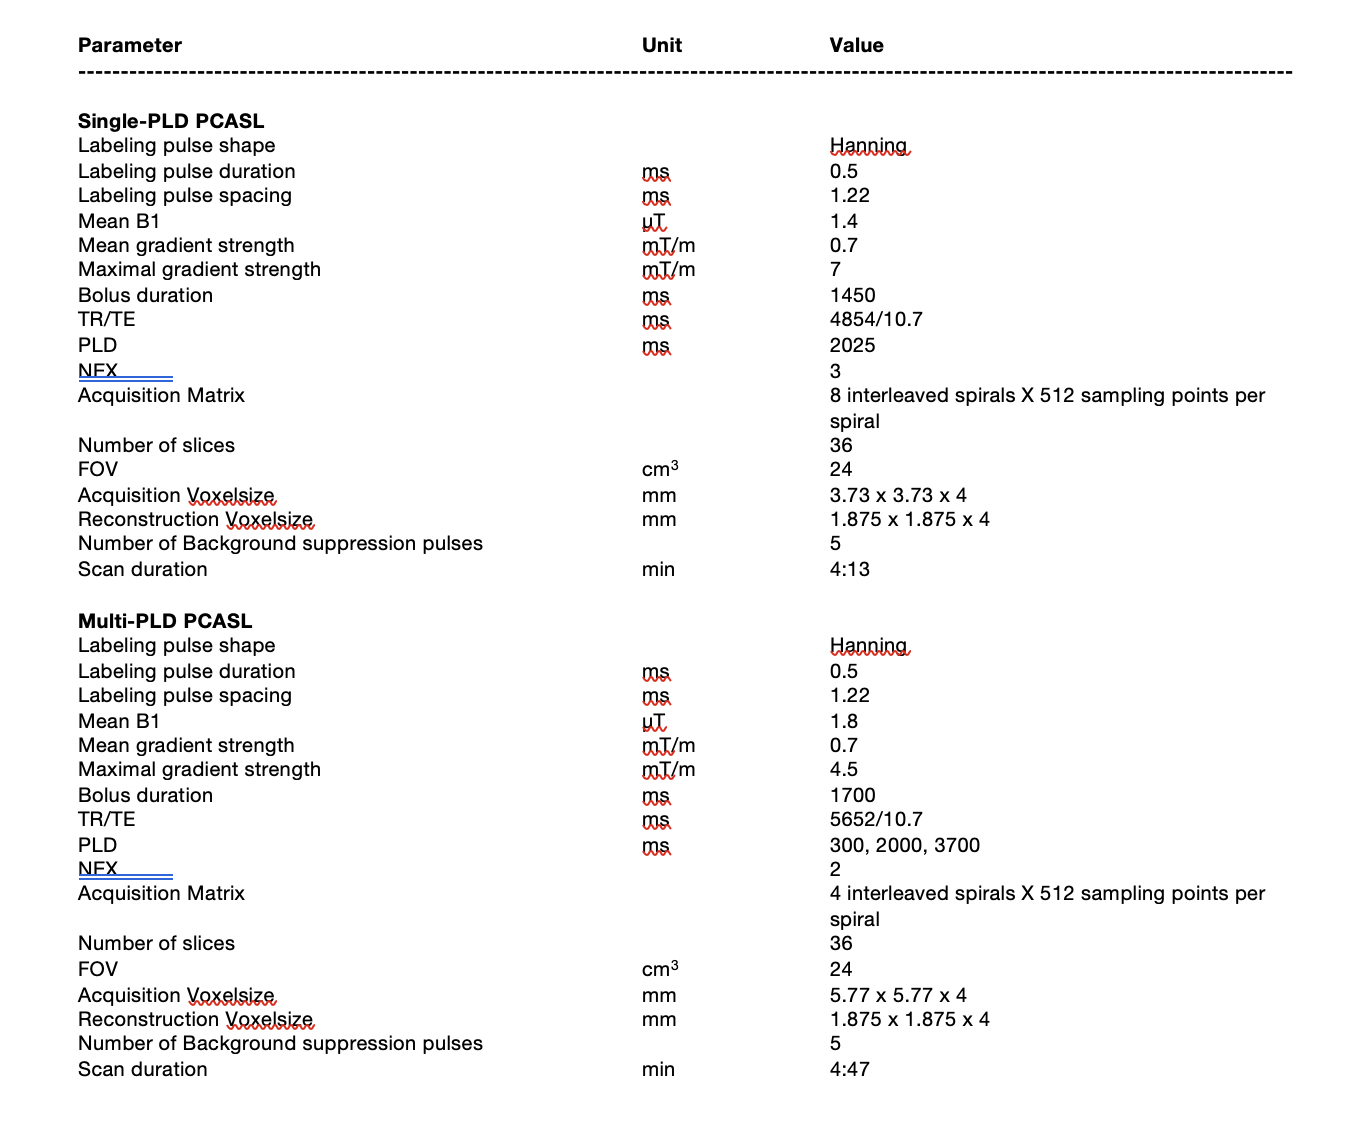
MRI data were collected from 15 healthy subjects (25-46 years, 7 males) using a 3T PET/MRI system (Signa, GE Healthcare, Waukesha, WI, USA) in two sessions separated by a week. In each session, single and multi-PLD PCASL was performed pre- and 15 minutes post the administration of ACZ using the parameters in Table 1. Blood samples (10 ml) from each subject were used to estimate the hemoglobin and hematocrit levels. Phase contrast MRI scans were performed before each ASL sequence to measure the flow volume and velocity of the internal carotid and vertebral arteries using the Arterys software (Arterys Inc., San Francisco, CA, USA). Based on the flow velocity and ASL sequence parameters, the labeling efficiency in each vessel was computed by solving the Bloch equations assuming homogenous field, ‘unbalanced’ PCASL labeling, and laminar flow [2]. The mean labeling efficiency of each subject was computed by summing the labeling efficiency of each vessel and weighted by the fraction of blood volume contributed by each vessel out of the total volume [6]. The repeatability of the labeling efficiency was evaluated using the wsCV and ICC of repeated measurements in the two scanning sessions [7]. Lower wsCV and higher ICC values indicate higher repeatability.Results
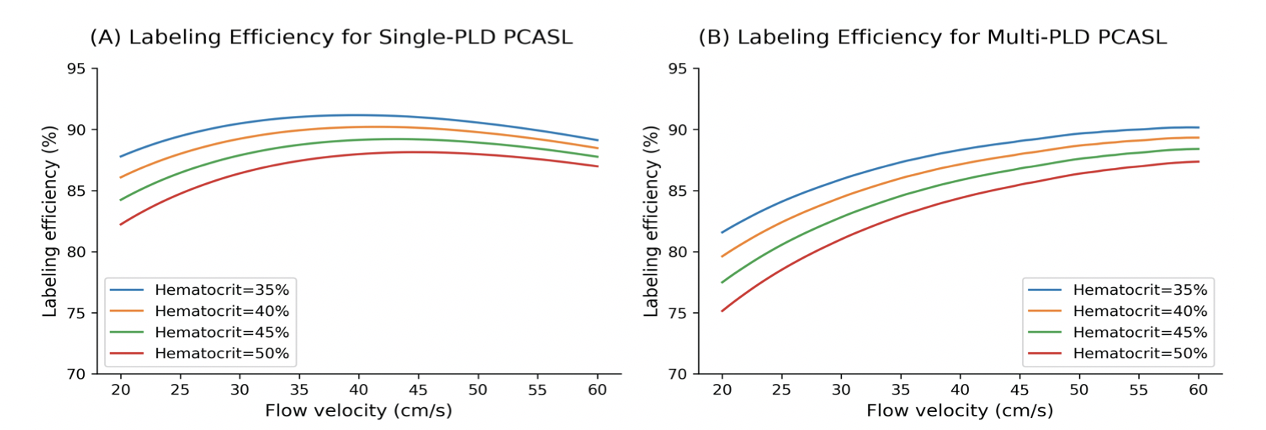
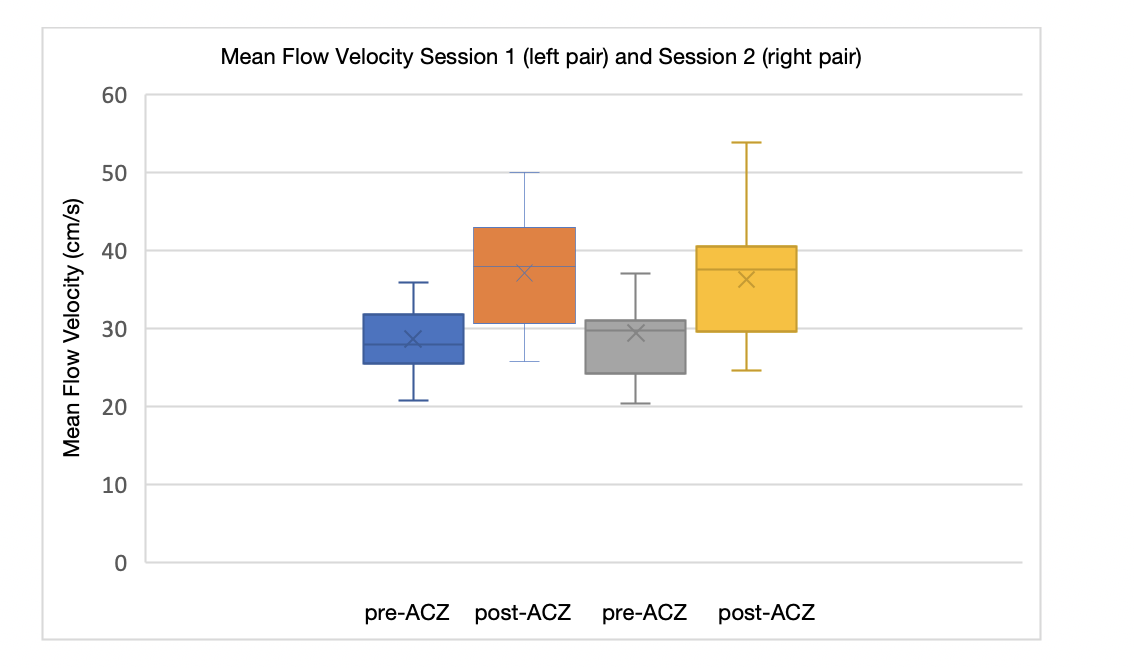
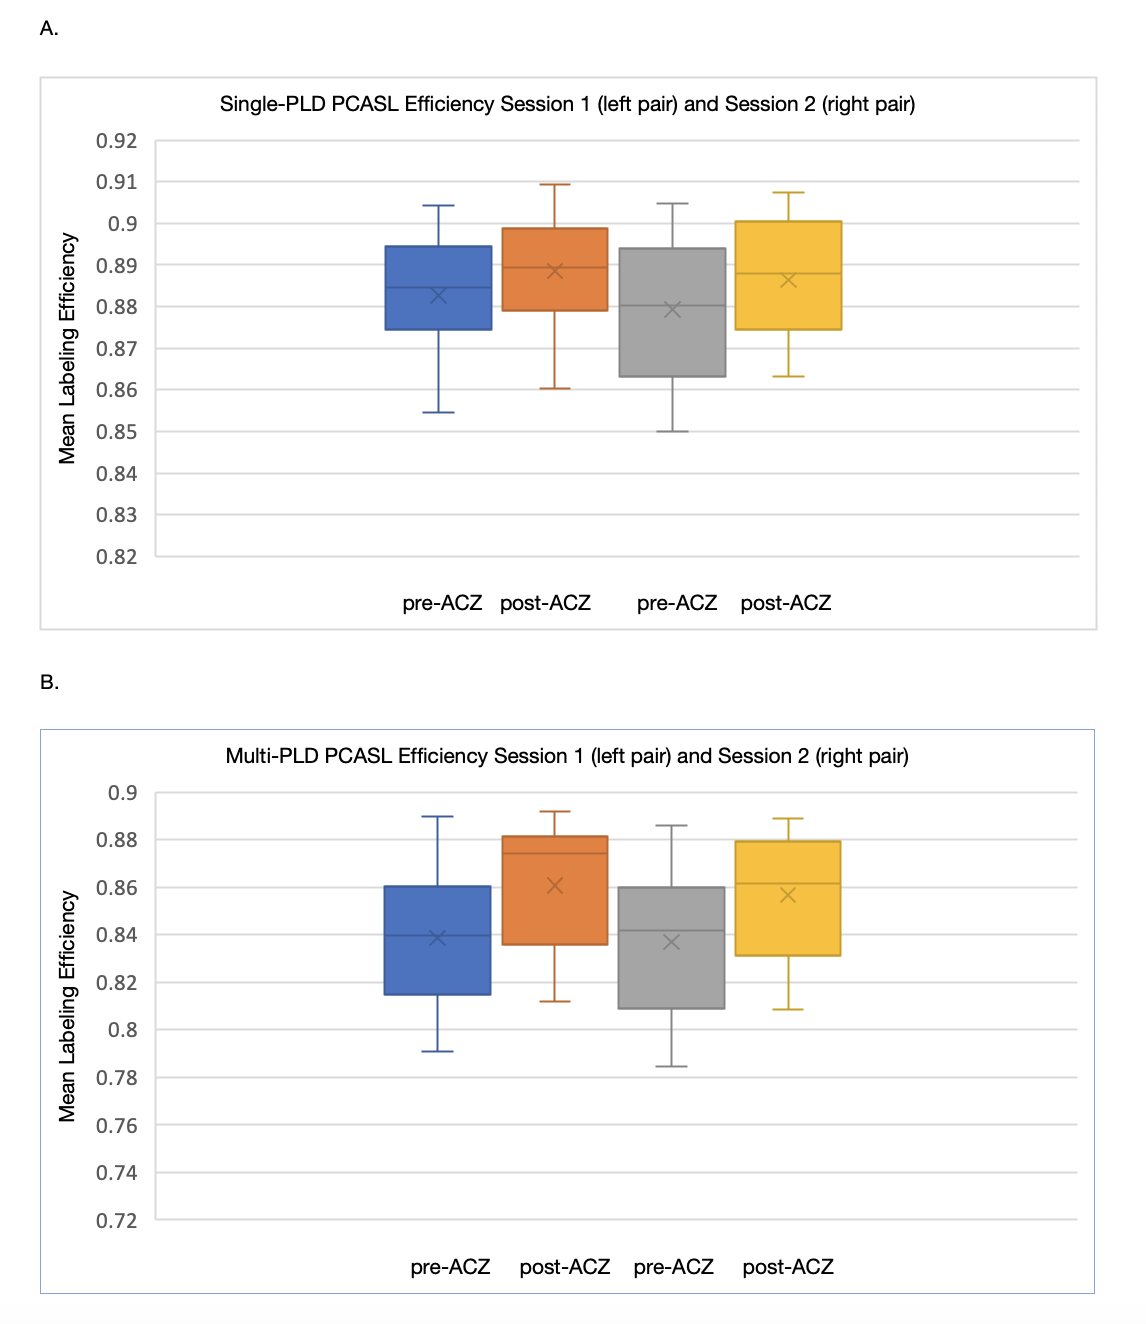
The mean and standard deviation of hematocrit were 45% and 6.11% respectively in this cohort. Figure 1 shows changes in labeling efficiency for single and multi-PLD PCASL at different hematocrit and flow velocity levels. For both labeling techniques, the labeling efficiency increased slightly in the expected range of the flow velocity of our cohort. Figures 2 and 3 show the changes in flow velocity in the carotid and vertebral arteries measured by PC MRI during the sessions, and the labeling efficiency change for single and multi-PLD PCASL, pre- and post-ACZ conditions. Overall, the administration of ACZ caused significant variations in these parameters. The total flow volume and the mean flow velocity increased by 51±23% and 25±19% respectively, post ACZ. This translated into a significant increase in labeling efficiency post-ACZ (0.7±1.2% for single-PLD PCASL and 2.4±2.0% for multi-PLD PCASL). Figures 4A and 4B show the repeatability of the labeling efficiency measured by wsCV and ICC values for both single and multi-PLD PCASL methods. The values for wsCV pre-ACZ are closer to 0% for both single and multi-PLD PCASL. Also, the values for ICC pre and post-ACZ are closer to 1 for both single and multi-PLD PCASL.Discussion
Although the labeling efficiency for both labeling techniques increased slightly, the magnitude of increase was higher for the multi-PLD PCASL implementation. This suggested that the multi-PLD PCASL sequence was more sensitive to labeling efficiency changes induced by the variation in flow velocity. Also, higher hematocrit resulted in a lower labeling efficiency at the same flow velocity. In our implementation, the labeling pulses of both PCASL sequences were designed such that the resulting labeling efficiency was relatively insensitive to the expected range of the flow velocity and hematocrit of our cohort, as shown in Figure 1. The mean velocity in carotid and vertebral arteries changed from 27 to 38 cm/s, a significant increase (p<0.01) of 41% (Figure 2). This variations in flow velocity resulted in slightly increased labeling efficiency for both the single and multi-PLD PCASL techniques (4% and 5% respectively) (Figures 3A and 3B,). This increase in mean labeling efficiency is significant (p=0.03 and p<0.01 respectively). Both labeling techniques, pre and post-ACZ, had low wsCV (close to 0%), which indicate that these labeling techniques are repeatable. Intraclass Correlation Coefficients for both single and multi-PLD PCASL pre and post-ACZ were much closer to 1 than 0, which also indicate that these labeling techniques are repeatable. These data implied that, by carefully selecting the labeling parameters to accommodate the expected flow variations, CVR can be measured using PCASL without the impact of labeling efficiency. We can conclude based on these data that the labeling efficiency for both ASL sequences achieved high repeatability and should be considered to improve the accuracy in CBF measurements after vasodilation.Acknowledgements
This work is supported by the NIH grant R01EB025220-02 and 4R00NS102884-03.References
1. H. Markus and M. Cullinane, “Severely impaired cerebrovascular reactivity predicts stroke and TIA risk in patients with carotid artery stenosis and occlusion,” Brain, vol. 124, no. 3, pp. 457–467, Mar. 2001, doi: 10.1093/brain/124.3.457.
2. M. Y. Zhao et al., “Quantification of cerebral perfusion and cerebrovascular reserve using Turbo-QUASAR arterial spin labeling MRI,” Magn. Reson. Med., vol. 83, no. 2, pp. 731–748, 2020, doi: 10.1002/mrm.27956.
3. D. C. Alsop et al., “Recommended implementation of arterial spin-labeled perfusion MRI for clinical applications: A consensus of the ISMRM perfusion study group and the European consortium for ASL in dementia.,” Magn. Reson. Med., vol. 73, no. 1, pp. 102–116, 2015, doi: 10.1002/mrm.25197.
4. P. Liu, J. B. De Vis, and H. Lu, “Cerebrovascular reactivity (CVR) MRI with CO2 challenge: A technical review,” NeuroImage, vol. 187, pp. 104–115, Mar. 2018, doi: 10.1016/j.neuroimage.2018.03.047.
5. M. Sokolska, X. Golay, and D. Thomas, “Effect of labelling plane angulation on pCASL labelling efficiency – does it really matter?,” in Proc. Intl. Soc. Mag. Reson. Med, 2015, vol. 23, pp. 2331–2331.
6. L. Vaclavu, M. Sokolska, A. J. Nederveen, and D. L. Thomas, “Accounting for pCASL labelling efficiency variation in patients with low and high arterial blood flow velocities,” in Proceedings of International Society for Magnetic Resonance In Medicine, 2018, pp. 1–3.
7. Cohen, Alexander D., et al. "Longitudinal reproducibility of MR perfusion using 3D pseudocontinuous arterial spin labeling with Hadamard‐encoded multiple postlabeling delays." Journal of Magnetic Resonance Imaging 51.6 (2020): 1846-1853.
Figures