4345
Changes in Functional Connectivity and Cognition in HIV Infected Individuals with Cerebral Small Vessel Disease1University of Rochester, Rochester, NY, United States
Synopsis
HIV-infected individuals are at increased risk of developing cerebrovascular diseases, such as cerebral small vessel disease (CSVD). Further, cognitive deficits as a result of chronic infection are common. In this abstract, we use a graph theoretical analysis of resting-state functional connectivity to show that functional and cognitive changes are driven by both HIV-infection and CSVD. We observed correlations between global and local graph theory metrics and cognitive scores derived from neuropsychological testing in the presence of HIV. We also describe potential compensatory changes in global brain function to combat functional deficits from HIV and CSVD.
Purpose
HIV-infected individuals are at increased risk of developing cerebrovascular diseases such as cerebral small vessel disease (CSVD)1 which impacts small arteries and veins2. Successful treatment by combination antiretroviral therapies (cART) allows individuals with HIV to live to longer than ever before, yet cognitive deficits still persist at an alarming prevalence (15-50%)3 as measured by the HIV-Associated Neurocognitive Disorder (HAND) criteria4. Studies exploring cognitive deficits due to HIV via changes in functional connectivity (FC) remain limited. Here we explore FC network differences between HIV-infected and uninfected individuals and relationships between FC and cognitive domains in the setting of CSVD.Methods
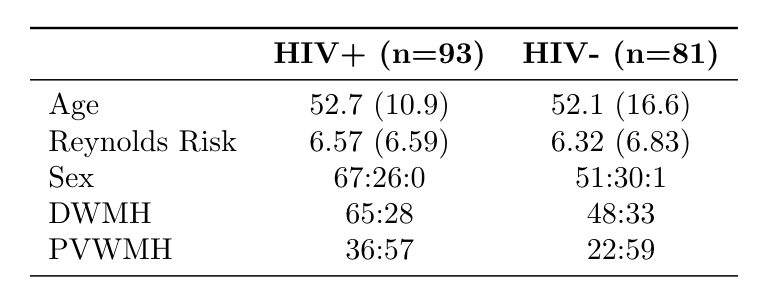
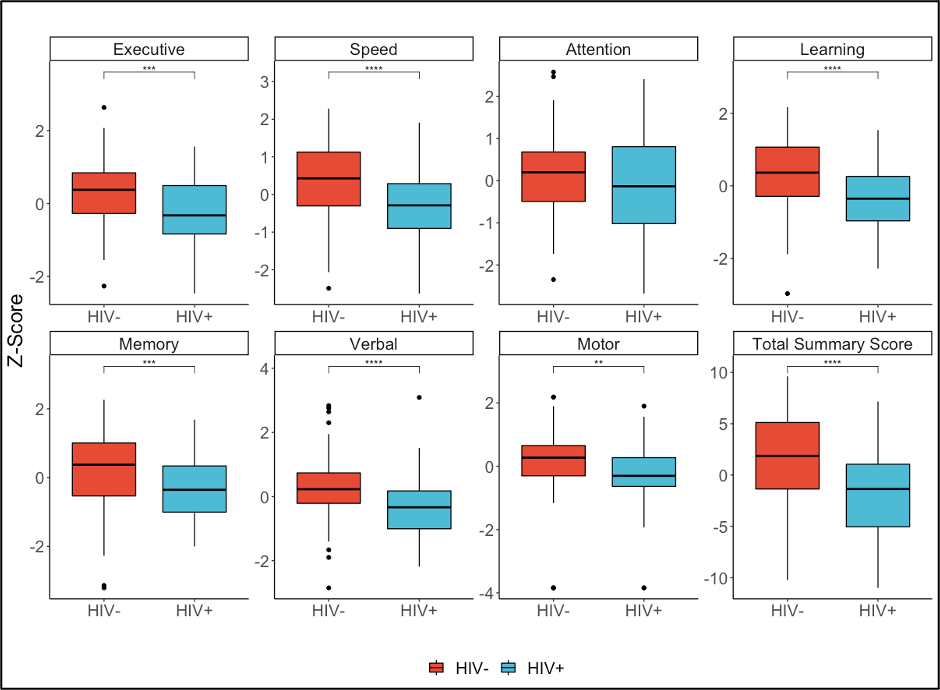
In an ongoing study, 175 subjects (age mean +/- std = 52.4 +/- 13.8, range 19 - 78) were evaluated to study HIV-associated CSVD (Table 1). All subjects underwent comprehensive neurocognitive assessments and magnetic resonance imaging. Cognitive domains considered are executive function, attention, memory, learning, speed of information processing, verbal reasoning, and motor speed. A total summary Z score was calculated by summing the Z score of all cognitive domains. T-tests were performed between HIV cohorts for each cognitive domain.All imaging was conducted on a 3T scanner (Siemens Prisma, Erlangen, Germany) equipped with a 64-channel head coil. The protocol included a high-resolution T1-weighted (T1w) anatomical image using the MPRAGE sequence (TI=950ms, TE/TR=3.87ms/1620ms, 1 mm isotropic resolution). Resting-state functional imaging was acquired with a gradient echo EPI (GE-EPI) sequence (TE/TR=43.0ms/2000ms, echo spacing=0.56ms, flip angle=70 degrees, EPI factor=128, 2mm isotropic resolution, 300 volumes). T1w images were used for co-registration of functional images to MNI152-2mm standard space. FMRI data processing was carried out using FEAT Version 6.00, part of FSL5.
Subject specific FC matrices were calculated for the Harvard-Oxford cortical and subcortical atlases using NiLearn in Python version 3.6, normalized and thresholded at 0.2. Graph theory analyses were performed using the Brain Connectivity Toolbox6, including global efficiency, transitivity, and assortativity. Local metrics including local efficiency, clustering coefficient, node degree, and node strength were calculated for each subject to evaluate the local network for each subcortical structure. T-tests were performed for each region of interest and the Benjamini-Hochberg procedure was used to correct for the false discovery rate. Graph theory metrics were marginally associated with the cognitive Z-scores from each domain via Spearman’s rank correlation coefficient.
Results
Cognitive ScoresThe rate of incidence of CSVD in our study is greater in the HIV+ population. Nearly every cognitive subdomain Z-score showed decreased cognitive function in the HIV+ group compared to controls (Figure 1).
Functional Connectivity
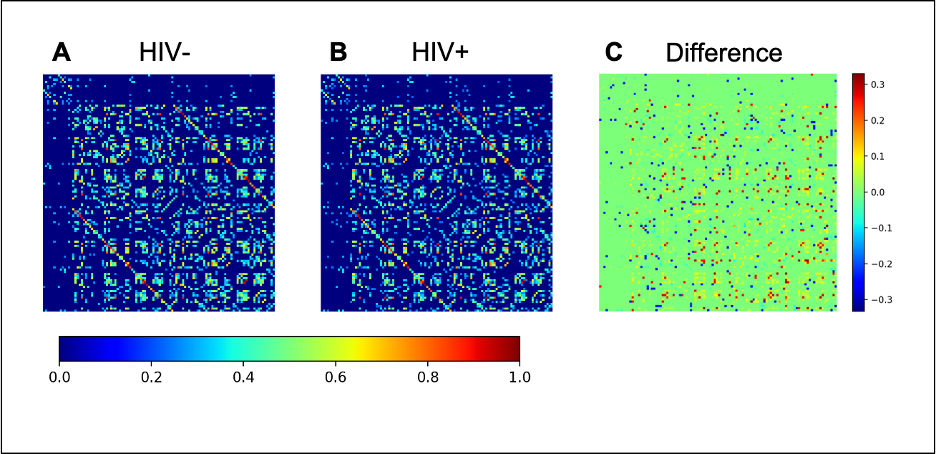
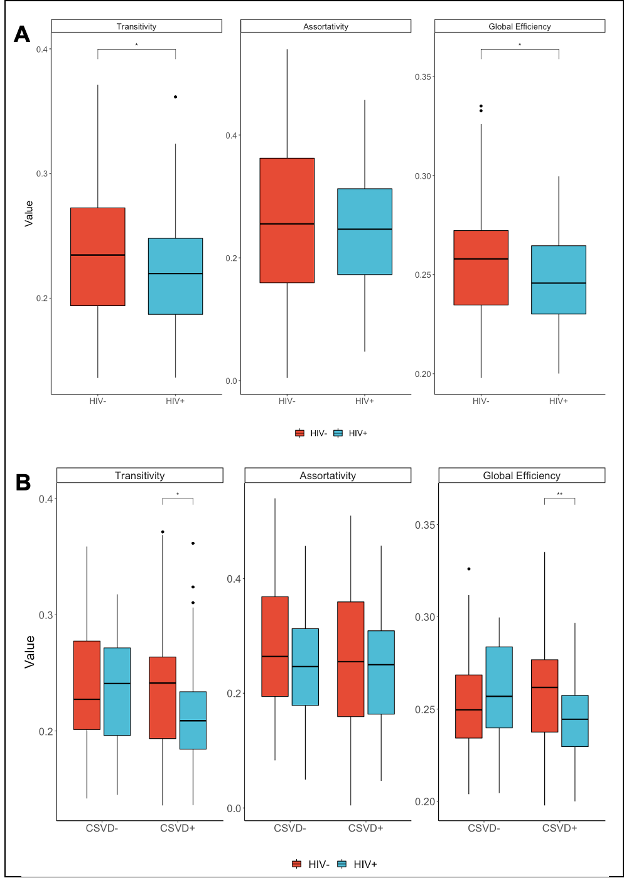
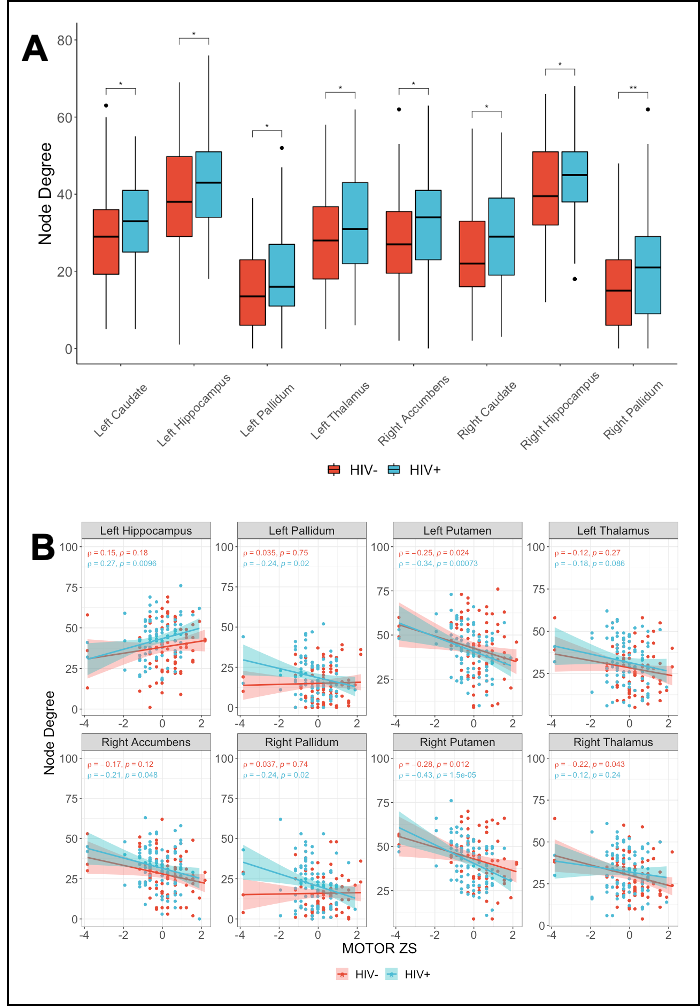
Mean FC matrices, by HIV cohort are shown in Figure 2. The HV+ group shows decreased Transitivity (p=0.026) and Global Efficiency (p=0.037) compared to controls. These HIV-metric relationships are preserved within the subset of subjects exhibiting signs of CSVD (Figure 3). Node Degree using each subcortical structure found increased values in the HIV+ group (Figure 4A).
Association of Cognitive Scores and Functional Connectivity
Correlations between cognitive domain scores and global metrics show moderate positive associations between assortativity and the motor (rho=0.31, p=0.003) and executive (rho=0.29, p=0.005) scores within the HIV+ cohort, only. Most subcortical regions showing increased node degree also showed moderate to strong inverse relationships with motor scores within the HIV+ cohort (Figure 4B). Similar associations were found in the right and left thalamus in the HIV– group.
Discussion
Our study shows an increased rate of CSVD within our HIV+ group, consistent with previous studies7. Our global graph theory analyses confirm previous results from our group with a much larger sample size8. We further show that group differences in global graph theory metrics are driven by a multifactorial pathology, namely HIV and CSVD. Specifically, the relation between assortativity and the executive and motor scores, combined with the decreases in transitivity and global efficiency suggest that there are global functional network disruptions. Further, in our subcortical analysis, we found that node degree is higher in the HIV+ group and inversely correlated with the motor scores. This finding suggests that a higher node degree is indicative of a more diffuse network and thus a deviation from the small-worldness typically seen in brain networks9. Furthermore, these findings might explain the reduced transitivity and global efficiency at the whole-brain level.Conclusion
In this preliminary analysis, we show that HIV-infection drives changes in cognition and FC. Alterations in network topology are more pronounced in the setting of both HIV infection and CSVD. Further, relationships between cognition and FC metrics suggest compensatory effects due to network dysfunction as a result of HIV-associated brain injury. Additional analyses upon completion of data collection are expected to expand upon these initial results.Acknowledgements
This work was funded by the NIH grant R01-AG05432804. We would like to acknowledge study participants, research coordinators, and the Schifitto imaging lab.References
1. Vinikoor MJ, Napravnik S, Floris-Moore M, Wilson S, Huang DY, Eron JJ. Incidence and clinical features of cerebrovascular disease among HIV-infected adults in the Southeastern United States. AIDS Res Hum Retroviruses. 29(7):1068-74, 2013.
2. Pantoni L. Cerebral small vessel disease: from pathogenesis and clinical characteristics to therapeutic challenges. Lancet Neurol. 9(7):689-701, 2010.
3. Schouten J, Cinque P, Gisslen M, Reiss P, Portegies P. HIV-1 infection and cognitive impairment in the cART era: a review. AIDS. 25(5):561-575, 2011.
4. Clifford DB, Ances BM. HIV-associated neurocognitive disorder. Lancet Infect Dis. 13(11):976-86, 2013.
5. Woolrich MW, Jbabdi S, Patenaude B., Chappell M, Makni S, Behrens T, Beckmann C, Jenkinson M, Smith SM. Bayesian analysis of neuroimaging data in FSL. NeuroImage, 45:S173-86, 2009.
6. Rubinov M, Sporns O. Complex network measures of brain connectivity: Uses and interpretations. NeuroImage, 52:1059-69, 2010.
7. Moulignier A, Savatovsky J, Assoumou L, Lescure FX, Lamirel C, Godin O, Valin N, Tubiana R, Canestri A, Roux P, Sadik JC, Salomon L, Abrivard M, Katlama C, Yazdanpanah Y, Pialoux G, Girard PM, Costagliola D; Microvascular Brain Retina and Kidney (MicroBREAK) Study Group. Silent Cerebral Small-Vessel Disease Is Twice as Prevalent in Middle-Aged Individuals With Well-Controlled, Combination Antiretroviral Therapy-Treated Human Immunodeficiency Virus (HIV) Than in HIV-Uninfected Individuals. Clin Infect Dis. 66(11):1762-1769, 2018.
8. Zhuang Y, Qiu X, Wang L, Ma Q, Mapstone M, Luque A, Weber M, Tivarus M, Miller E, Arduino RC, Zhong J, Schifitto G. Combination antiretroviral therapy improves cognitive performance and functional connectivity in treatment-naïve HIV-infected individuals. J Neurovirol. 23(5):704-712, 2017.
9. Bassett DS, Bullmore ET. Small-world brain networks revisited. Neuroscientist. 23(5):499-516, 2017.
Figures