4342
Exploring the effect of aquaporin-4 suppression on cell membrane water exchange in a mouse model of brain ischemia using diffusion-weighted MRI1Department of Functional Brain Imaging Research, National Institute of Radiological Sciences, QST, Chiba, Japan, 2Applied MRI Research, National Institute of Radiological Sciences, QST, Chiba, Japan, 3Keio Advanced Research Center for Water Biology and Medicine, Keio University, Tokyo, Japan
Synopsis
We measured multi-b-value multi-diffusion-time (MbMTd) DWI and compared ADCs in the ischemic focii of aquaporin4-knockout (AQP4-KO) and wild type (WT) mice. In the ischemic region, AQP4-KO mice showed lower ADCs compared to WT mice, whereas higher ADCs were observed in the contralateral region. In addition, we compared estimates of cell membrane water exchange time obtained by fitting a two-compartment exchange model to the DWI signal. The exchange-time was approximately 2.5 times longer for the AQP4-KO mice than for the WT mice. These results suggest that MbMTd DWI may be useful for in vivo research and clinical diagnosis of AQP4-related diseases.
Introduction
Aquaporin-4 (AQP4) is a membrane channel protein that specifically allows water molecules to pass through it. It has been suggested that AQP4, which is highly expressed in brain astrocytes, is involved in cell swelling after cerebral infarction, and suppression of AQP4 function may be effective in reducing cellular edema1–3. Therefore, it is very important to develop clinically applicable measurement systems to understand the effects of AQP4 suppression on the living body. The apparent diffusion coefficient (ADC) is widely used as an indicator of biological diffusion in DWI studies. Different ADCs may be attributed to different parts of an organism depending on the nature of diffusion in that component4,5. For example, as water diffusion inside cells is strongly obstructed by the cell membrane as well as the many intracellular structures, it usually corresponds to a restricted diffusion component. On the other hand, diffusion through the extracellular space is comparatively (but not completely) free so it contributes to a hindered diffusion component. In general, the ADC of the hindered diffusion component is larger than that of the restricted diffusion component. This means that the contribution from the hindered diffusion component is relatively small at b-values above 2000 s/mm2, so the signal from the restricted diffusion component dominates at high b-values. In addition to the effects of the microstructure, signal attenuation may also be affected by the rate of water exchange between different components6,7. This may be investigated by varying the diffusion-time. In this study, we measured multi-b-value multi-diffusion-time (MbMTd) DWI and compared ADCs in the ischemic focii of AQP4-KO and WT mice. The data was also analyzed with a two-compartment exchange model to quantitatively assess water exchange-time8.Methods
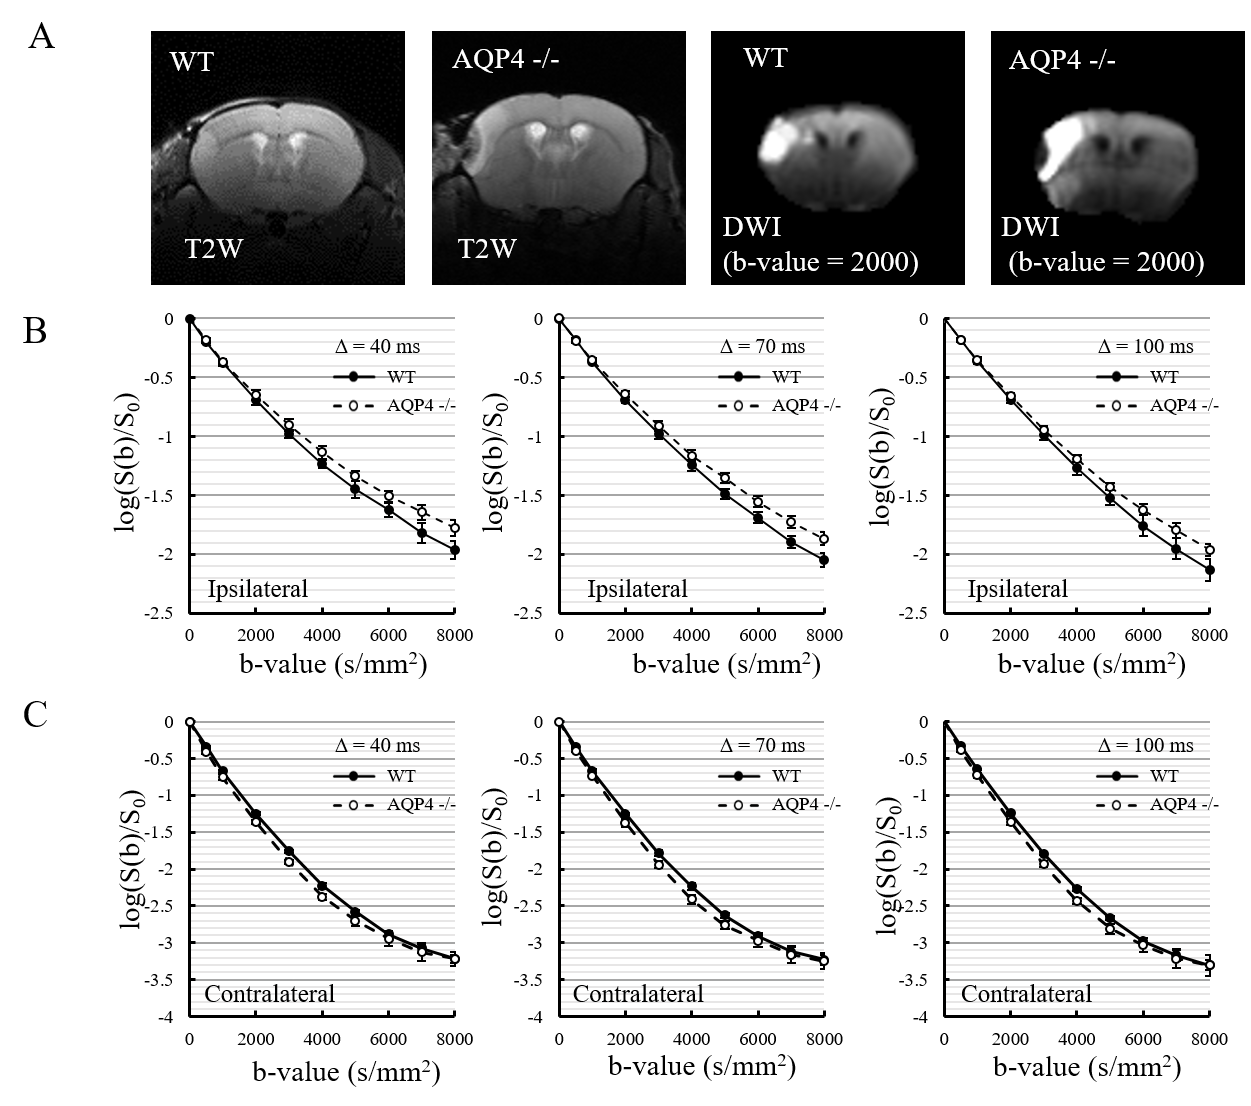
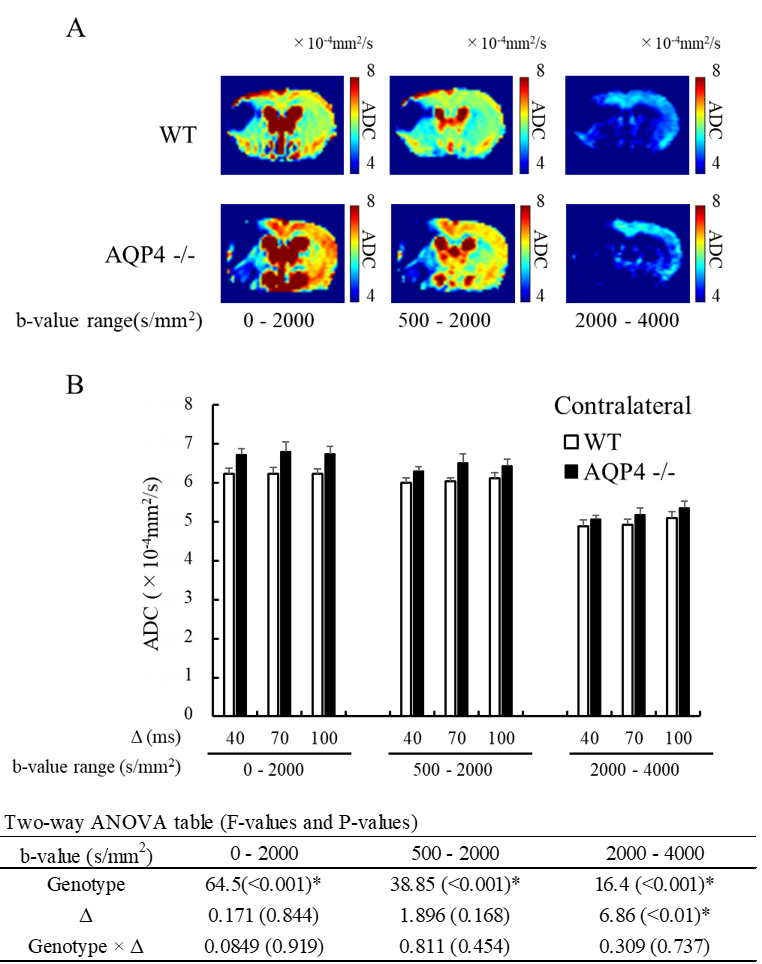
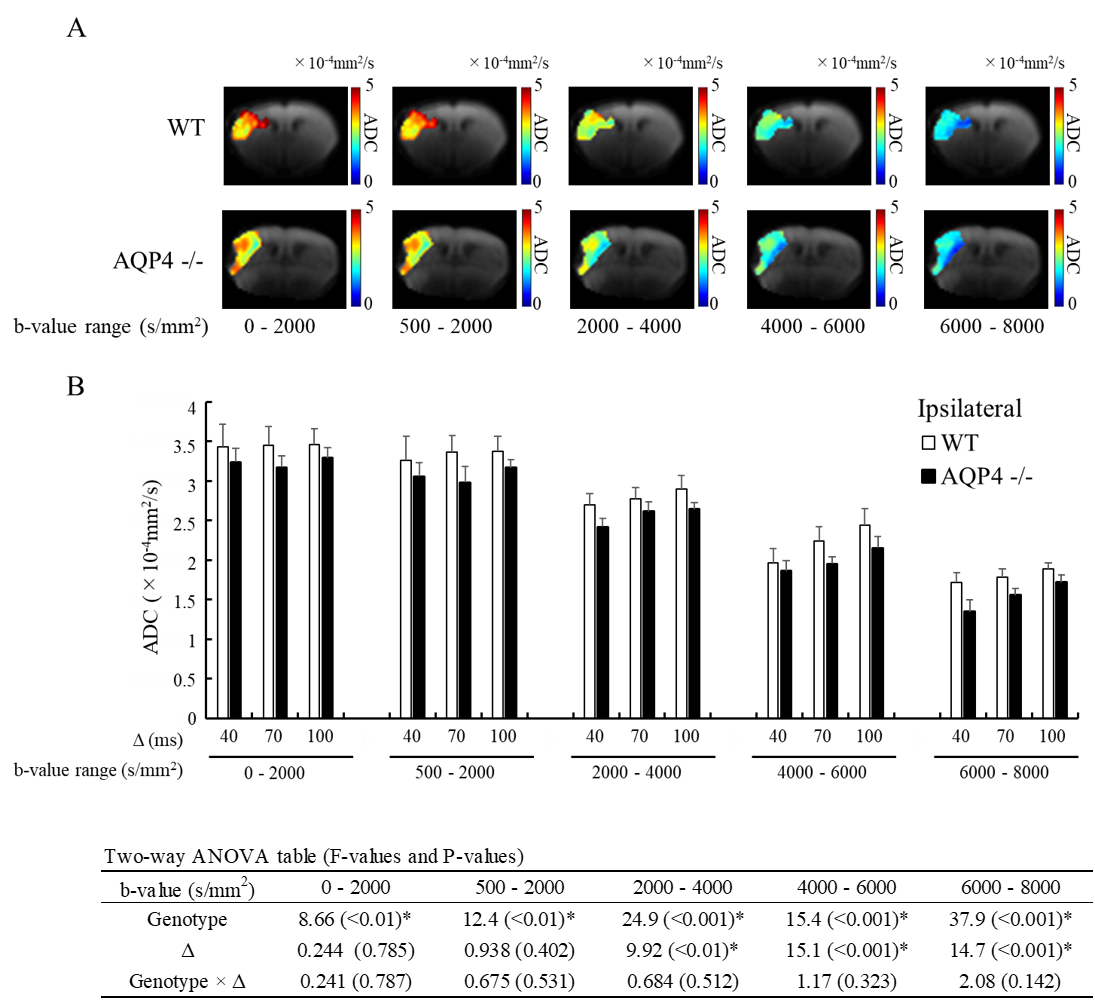
A total of 6 C57BL/6J WT mice and 7 AQP4-KO mice were used in the diffusion MRI experiments. Middle cerebral artery occlusion (MCAO) was performed for all animals using the Tamura method9, where a permanent occlusion is made at the proximal branch of the MCA in the left cerebral cortex. MRI measurements were performed at 2 hours after MCAO surgery on a 7T animal MRI (Kobelco and Bruker, Tokyo, Japan). MbMTd DWI was obtained using a pulsed-gradient spin-echo sequence with four-shot EPI acquisition (TR = 3 s, TE = 115 ms, matrix size = 128 × 128, spatial resolution = 0.02 × 0.02 mm2, slice thickness = 1.5 mm, gradient directions = 3). The separation of the diffusion-gradient lobes (Δ) was set at 40, 70, and 100 ms to vary diffusion-time while keeping TE constant. The diffusion-gradient duration (δ) was fixed at 7 ms for all experiments. For each Δ, the b-value was increased from 0 to 8000 s/mm2 in 11 steps (0, 2, 500, 1000, 2000, 3000, 4000, 5000, 6000, 7000, and 8000 s/mm2) by increasing the gradient amplitude. DWI data analysis was performed in Matlab (MathWorks, MA, USA). Regions-of-interest were drawn in the ischemic and contralateral regions on T2-weighted images. The DWI data were averaged over the 3 gradient directions, and ADC maps were created by ordinary least squares fitting to the logarithmic signals with respect to b-value. ADCs were estimated for five different b-value ranges: 0-2000, 500-2000, 2000-4000, 4000-6000, 6000-8000 s/mm2. Estimation of cell membrane water exchange-time and other model parameters (α: parameter reflecting the mean cell volume, Fin: signal fraction from intracellular space, and Dex: ADC for the extracellular space) was performed based on a previously reported two-compartmental model with inter compartment exchange8.Results
The normalized signal in the ischemic and the contralateral regions were plotted against b-value for all three values of Δ (Fig. 1). The SNR in the contralateral region was less than 5 for b-values above 5000 s/mm2, so that data was excluded from subsequent analysis of that region. In the contralateral region, the AQP4-KO mice showed significantly higher ADC than the WT mice for each of the b-value patterns (Fig. 2). Also, the ADC for the 2000-4000 s/mm2 b-value range showed a Δ-dependent difference. In the ischemic region, for all b-value ranges the ADCs were significantly lower for the AQP4-KO mice than for the WT mice (Fig. 3). Moreover, the ADCs for the 2000-4000, 4000-6000, and 6000-8000 s/mm2 b-value ranges showed a significant Δ-dependent difference. Estimates of the four exchange model parameters obtained by fitting to the ischemic data are shown in Fig. 4. The AQP4-KO mice showed a significantly longer water exchange-time than the WT mice (Fig. 4a, P<0.05). α, Fin, and Dex had significantly larger mean values for the WT mice (Fig. 4B-D; α: P<0.05, Fin: P<0.01, Dex: P<0.01).Discussion
The larger ADC of the AQP4-KO mice in normal tissue may reflect the larger extracellular space in AQP4-KO mice10. Since ischemia causes astrocytes and neuronal dendrites to swell11,12, the smaller ADC of AQP4-KO mice in ischemic tissue may reflect differences in water exchange-time between the two genotypes. Exchange-time was about 2.5 times longer for the AQP4-KO mice, which is consistent with previous in vitro studies8,13.Conclusion
Our results suggest that in cell membrane water exchange abnormalities caused by AQP4 loss may be detected in living animals. MbMTd DWI might be useful for evaluating the efficacy of AQP4 targeted medicines and for the clinical diagnosis of AQP4 related diseases.Acknowledgements
The Authors would like to express their appreciation for the support of Dr. Ichio Aoki and Dr. Tatsuya Higashi during this study. This work was supported by the grants from KAKENHI (15H04910), Japan.References
1. Igarashi, H., Huber, V. J., Tsujita, M. & Nakada, T. Pretreatment with a novel aquaporin 4 inhibitor, TGN-020, significantly reduces ischemic cerebral edema. Neurol. Sci. 32, 113–116 (2011).
2. Yao, X., Derugin, N., Manley, G. T. & Verkman, A. S. Reduced brain edema and infarct volume in aquaporin-4 deficient mice after transient focal cerebral ischemia. Neurosci. Lett. 584, 368–372 (2015).
3. Manley, G. T. et al. Aquaporin-4 deletion in mice reduces brain edema after acute water intoxication and ischemic stroke. Nat. Med. 6, 159–163 (2000).
4. Assaf, Y. et al. High b-value q-space analyzed diffusion-weighted MRI: Application to multiple sclerosis. Magn. Reson. Med. 47, 115–126 (2002).
5. Clark, C. A. & Le Bihan, D. Water diffusion compartmentation and anisotropy at high b values in the human brain. Magn. Reson. Med. 44, 852–859 (2000).
6. Lampinen, B., Lätt, J., Wasselius, J., Westen, D. Van & Nilsson, M. Diffusion time dependence and tissue outcome in ischemic stroke. 2–5 (2020).
7. Nilsson, M. et al. Evaluating the accuracy and precision of a two-compartment Kärger model using Monte Carlo simulations. J. Magn. Reson. 206, 59–67 (2010).
8. Obata, T. et al. Comparison of diffusion-weighted MRI and anti-Stokes Raman scattering (CARS) measurements of the inter-compartmental exchange-time of water in expression-controlled aquaporin-4 cells. Sci. Rep. 8, (2018).
9. Tamura, A., Graham, D. I., McCulloch, J. & Teasdale, G. M. Focal cerebral ischaemia in the rat: I. Description of technique and early neuropathological consequences following middle cerebral artery occlusion. J. Cereb. Blood Flow Metab. 1, 53–60 (1981).
10. Yao, X., Hrabětová, S., Nicholson, C. & Manley, G. T. Aquaporin-4-deficient mice have increased extracellular space without tortuosity change. J. Neurosci. 28, 5460–5464 (2008).
11. Risher, W. C., Andrew, R. D. & Kirov, S. A. Real-time passive volume responses of astrocytes to acute osmotic and ischemic stress in cortical slices and in vivo revealed by two-photon microscopy. Glia 57, 207–221 (2009).
12. Badaut, J., Ashwal, S. & Obenaus, A. Aquaporins in cerebrovascular disease: A target for treatment of brain edema? Cerebrovascular Diseases vol. 31 521–531 (2011).
13. Ibata, K., Takimoto, S., Morisaku, T., Miyawaki, A. & Yasui, M. Analysis of aquaporin-mediated diffusional water permeability by coherent anti-Stokes Raman scattering microscopy. Biophys. J. 101, 2277–2283 (2011).
Figures