4341
Monte Carlo Simulation Study of Asymmetric Spin Echo and Preliminary Estimation of Vessel Size Index1University of Southern California, Los Angeles, CA, United States, 2Children's Hospital Los Angeles, Los Angeles, CA, United States
Synopsis
Asymmetric spin echo (ASE) sequence is a technique for mapping oxygen extraction fraction (OEF) and venous cerebral blood volume (vCBV). However, there might be an overestimation of vCBV due to the diffusion effect related to vessel size. In this study, we use Monte Carlo simulation to study this effect and investigate the feasibility of estimating vessel size index from ASE data.
Introduction
Asymmetric spin echo (ASE) sequence is a technique for mapping oxygen extraction fraction (OEF) and venous cerebral blood volume (vCBV).1 The analytical model assumes that the signal decay behaves in the static dephasing regime (SDR), which means the diffusion of water does not affect the signal decay.2 However, recent research reveals that this assumption might not be valid and the diffusion effect might introduce a vessel size dependent effect on the signal decay.3,4 We hypothesize that the effect introduces bias to the expected parameters and the actual signal decay might reflect the information of vessel size. Thus, in this study we use Monte Carlo simulation to study this effect and investigate the feasibility of using ASE data to estimate vessel size index.Methods
Theory: ASE can be viewed as a modification of SE in which the acquisition time is fixed with a shifting 180 pulse, increasing dephasing and creating signal decay with R2’ contrast. The signal decay can be simplified to two relaxation regimes separated by 2$$$\tau=1.5/\delta \omega$$$ with constant TE and a sufficiently long TR5:$$S_L(\tau) = c*exp(-\lambda*\delta \omega*2\tau+\lambda)(1)$$
$$S_S(\tau) = c*exp(-0.3*\lambda*(\delta \omega*2\tau)^2)(2)$$
Where c is a constant, $$$\lambda$$$ is the venous blood volume fraction, $$$\tau$$$ is the time shift from the expected echo formation, and $$$\delta \omega$$$ is the frequency shift induced by the microscopic susceptibility. In the presence of randomly oriented cylinders containing de-oxygenated hemoglobin, $$$\delta \omega$$$ can be written as follows:
$$\delta \omega = 4/3*\pi*\gamma*\Delta \chi*Hct*B_0*OEF(3)$$
$$R_2' =\delta \omega*\lambda(4)$$
Where $$$\gamma$$$ is the gyro-magnetic ratio, B0 is the main magnetic field strength, Hct is the fractional hematocrit and $$$\Delta \chi$$$ is the susceptibility difference between fully oxygenated and fully deoxygenated blood. R2’ and $$$\lambda$$$ can be estimated calculating the slope and intercept of plot of log (SL(t)) versus 2t (Eq 1).
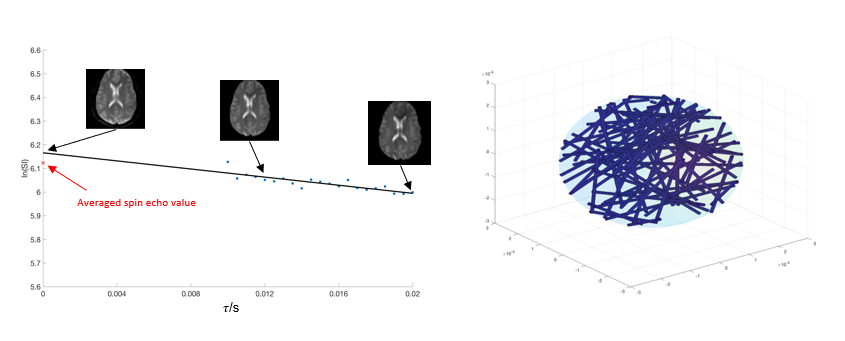
ASE acquisition and processing: A total of 10 subjects (female 30%, age 24±8), including 6 sickle cell disease patients and 4 healthy controls were studied. All subjects underwent an MR study using Philips 3T Achieva System. The ASE sequence was acquired with the following parameters: TR = 3s, TE = 62ms, resolution = 3*3*6 mm3, matrix size = 64*64, range = 10:0.5:20 ms. Each scan was composed of 28 dynamics, including 7 spin echo scans ($$$\tau$$$ = 0) and other 21 equally spaced $$$\tau$$$ value from 10ms to 20ms. For every voxel in ASE dataset, the first 7 spin echo values were averaged, and the other 21 values with different $$$\tau$$$ values were fitted linearly in log space to generate R2’ and $$$\lambda$$$. Voxel-wise OEF maps were subsequently derived using equation 3.
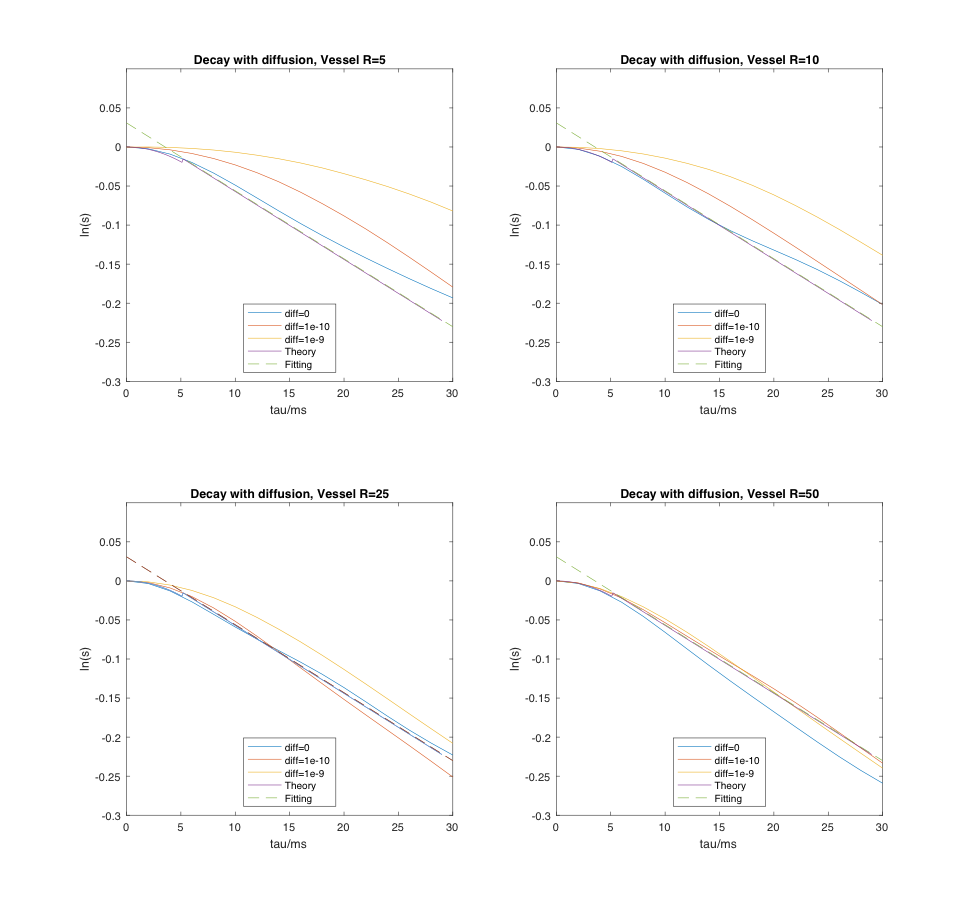
Simulation: 1. A spherical simulation space was generated containing vessels represented by infinite and random-oriented cylinders with fixed radius. 2. The susceptibility-induced field shift ($$$\Delta$$$B_0) was calculated in K-space using the known Fourier transform of infinite cylinders.6 3. Monte Carlo random walk was performed simulating the diffusion of water protons. Each step taken by a proton followed the normal distribution with 0 mean and standard deviation ($$$\sigma = \sqrt{2D\Delta t}$$$ for each dimension, D is the diffusion coefficient and ∆t is the time step)7. 4. The phase accumulation in the rotating frame at each step was calculated by summing over the field contributions from all vessels based on: $$$\Delta \varphi = \gamma \Delta B_0\Delta t$$$. 5. The signal decay curve was plotted by summing up all the protons with calculated phase. Simulations were performed for a selection of vessel radii (5, 10, 25, 50 um) and diffusion coefficients (D=0, 10e-10, 10e-9 m2/s). The remaining parameters were: number of protons N=10000, simulation sphere radius=200 um, vessel volume fraction=3%, TE=60 ms, τ=0-30 ms by 1 ms increments.
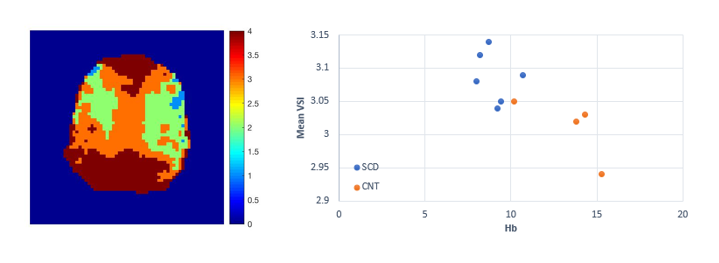
VSI estimation: Using the simulation data, we calculated a signal decay curve dictionary under different combinations of vessel sizes and diffusion coefficients. From this dictionary, we processed signal decay curves from the in-vivo ASE data for each voxel and selected the vessel size yielding the minimum squared error for each diffusion coefficient.
Results
Representative signal decay curve and the Monte Carlo simulation system are shown in Figure 1. The decay curves under different vessel sizes and diffusion coefficients, as well as the decay curve by theory (Equation 1 and 2) are displayed in Figure 2. We can see that the fitting error increases when the vessel size decreases or the diffusion gets larger. And the signal behaves as expected by theory when the radius is 50 um, despite the diffusion condition. Typical VSI map is shown in Figure 3. And the mean VSI for SCD is 3.09 and the mean VSI for healthy is 3.01.Discussion
In this study, the Monte Carlo simulation is used to study the signal generation of ASE and the potential effect of vessel size and diffusion. It turns out the assumption of ASE might be invalid for small vessels and there might be a shift from the static dephasing regime to diffusion narrowing regime.3 This method also demonstrates the feasibility of generating VSI map from ASE data though the result is preliminary. Further optimization of the simulation process, extension of the curve dictionary and cross validation over a large dataset are required.Acknowledgements
This work is supported by the National Heart Lung and Blood Institute (1RO1HL136484-A1, 1U01HL117718-01), the National Institutes of Health (1R01-NS074980), the National Institute of Clinical Research Resources (UL1 TR001855-02) and by research support in kind from Philips Healthcare.References
1. An, Hongyu, and Weili Lin. "Impact of intravascular signal on quantitative measures of cerebral oxygen extraction and blood volume under normo‐and hypercapnic conditions using an asymmetric spin echo approach." Magnetic Resonance in Medicine: An Official Journal of the International Society for Magnetic Resonance in Medicine 50.4 (2003): 708-716.
2. Yablonskiy, Dmitriy A., and E. Mark Haacke. "Theory of NMR signal behavior in magnetically inhomogeneous tissues: the static dephasing regime." Magnetic resonance in medicine 32.6 (1994): 749-763.
3. Stone, Alan J., et al. "Simulations of the effect of diffusion on asymmetric spin echo based quantitative BOLD: An investigation of the origin of deoxygenated blood volume overestimation." NeuroImage 201 (2019): 116035.
4. Boxerman, Jerrold L., et al. "MR contrast due to intravascular magnetic susceptibility perturbations." Magnetic resonance in medicine 34.4 (1995): 555-566.
5. An, Hongyu, and Weili Lin. "Quantitative measurements of cerebral blood oxygen saturation using magnetic resonance imaging." Journal of Cerebral Blood Flow & Metabolism 20.8 (2000): 1225-1236.
6. Wang, Yi, and Tian Liu. "Quantitative susceptibility mapping (QSM): decoding MRI data for a tissue magnetic biomarker." Magnetic resonance in medicine 73.1 (2015): 82-101.
7. Mooney, Christopher Z. Monte carlo simulation. Vol. 116. Sage publications, 1997.
Figures