4335
Test–Retest Repeatability of Brain Oxygen Metabolism Measurement using MRI1Department of Biomedical Engineering, Washington University in St. Louis, St. Louis, MO, United States, 2Department of Neurology, Washington University School of Medicine, St. Louis, MO, United States, 3Mallinckrodt Institute of Radiology, Washington University School of Medicine, St. Louis, MO, United States
Synopsis
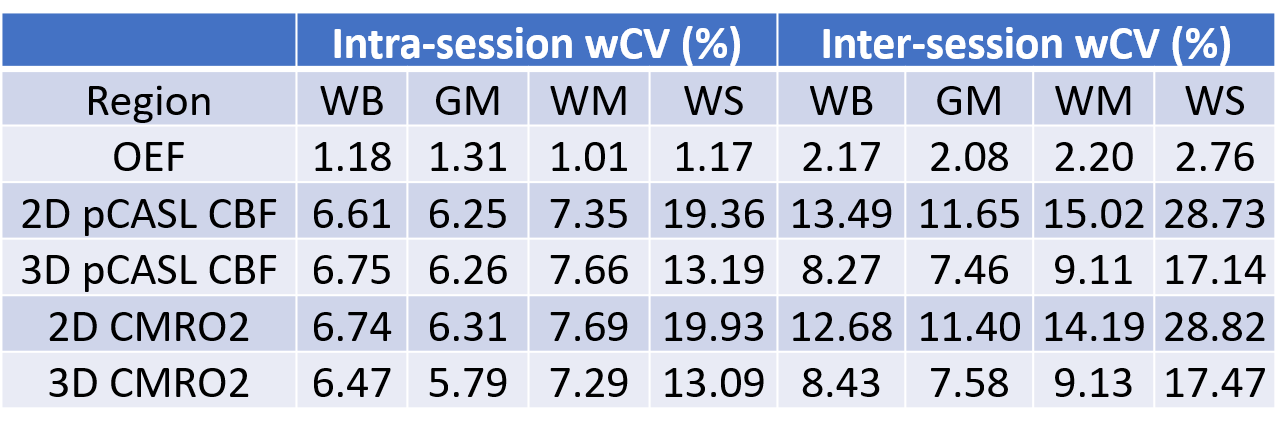
We evaluated the test-retest repeatability of MR-measurement of CBF, OEF and CMRO2 in whole brain, gray matter, white matter, and watershed regions in healthy subjects. The inter-session wCV was 2.20% in white matter and 2.76% in watershed region for OEF measured with ASE, 15.02% in white matter and 28.73% in watershed region for CBF measured with 2D multi-slice pCASL, and 9.11% in white matter and 17.14% in watershed region for CBF measured with background suppressed 3D pCASL. CMRO2 had similar test-retest repeatability to CBF.
Introduction
Cerebral blood flow (CBF), oxygen extraction fraction (OEF) and cerebral metabolic rate of oxygen (CMRO2) are important brain metabolic parameters. Quantitative CBF can be measured with arterial spin labeling (ASL)1. Our laboratory has developed an asymmetric spin echo (ASE) EPI sequence to measure tissue-level OEF noninvasively2. CBF and OEF have been used to investigate various neurological diseases, including cerebral small vessel disease (CSVD)3-6. Elevated OEF in white matter and watershed regions, where CBF is at its nadir, were found in CSVD patients3,4. On the other hand, literature regarding CBF in CSVD patients is conflicting3-5. A meta-analysis suggested that the decreased CBF observed in CSVD patients may be attributed to age but not disease6.As both OEF and CBF have been used widely to study disease onset and progression, and potential therapeutic intervention, test-rest repeatability of these parameters needs to be established in various relevant regions to correctly distinguish true pathophysiological changes from methodology variability. In this study, we evaluated the test-retest repeatability of MR-measured OEF, CBF and CMRO2 in whole brain, gray matter, white matter, and watershed regions in healthy subjects.
Methods
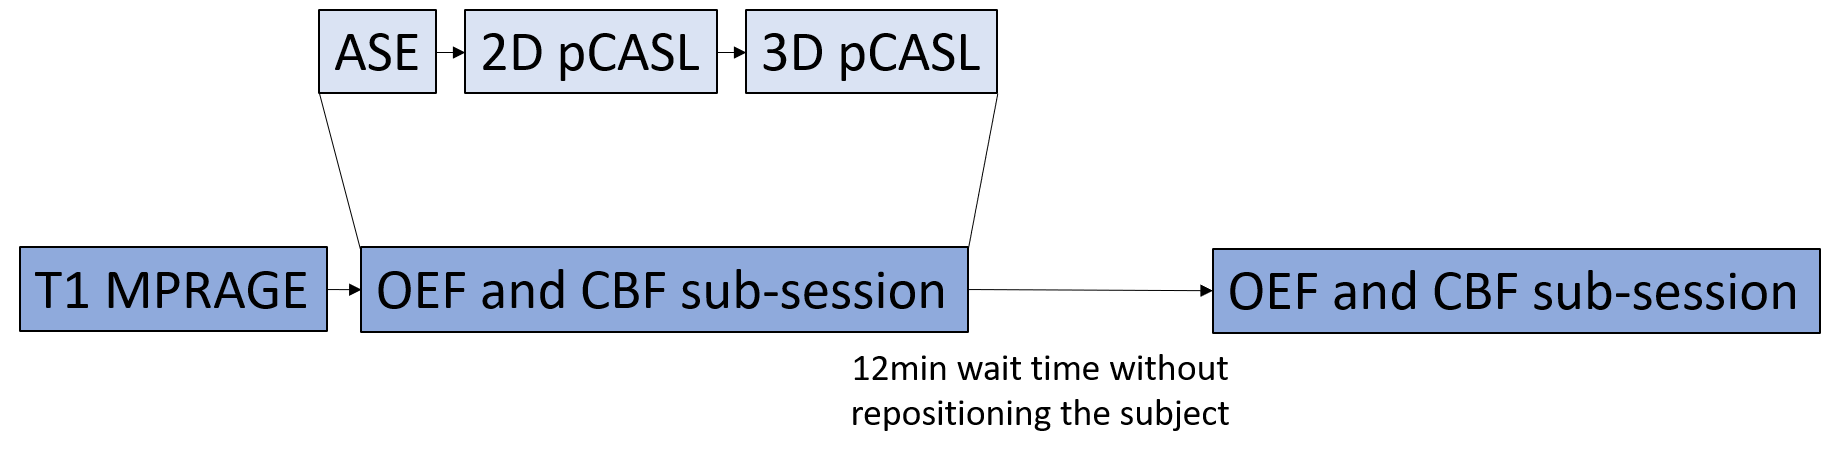
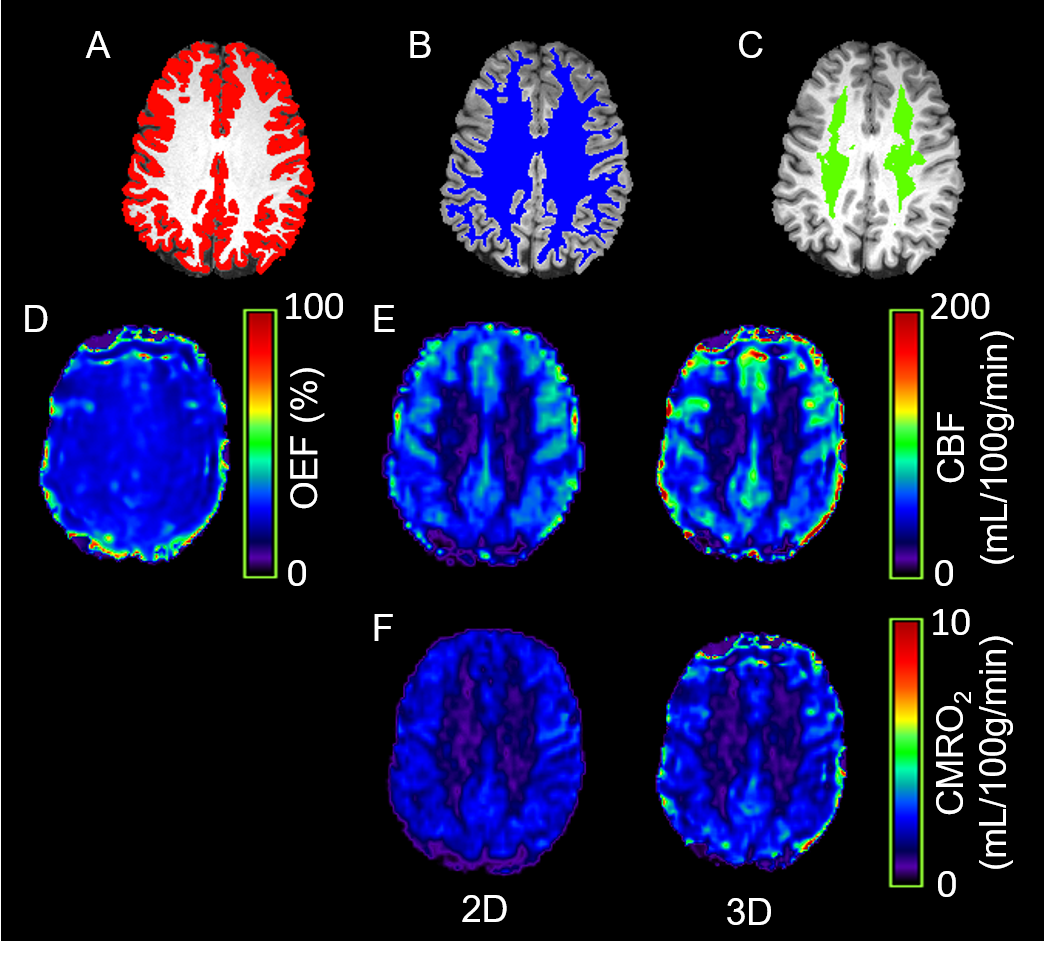
MR images were acquired from 11 healthy subjects (35.9±12.3yo, 9 female) using a 3T Siemens Prisma scanner. Each subject underwent two identical scan sessions with 5-14 days interval. Each scan session comprised two identical OEF and CBF measurement sub-sessions with approximately 12 minutes in between without repositioning the subject (Figure 1). Each sub-session consisted of an ASE sequence for OEF measurement, a pCASL sequence with 2D multi-slice EPI readout and a pCASL sequence with background suppressed 3D GRASE readout for CBF measurement1.T1w images were used to segment tissue into gray matter (GM), white matter (WM) and CSF. A physiological watershed (WS) region was pre-defined as a region within the lowest 10th percentile of the mean WM CBF in a separate healthy control cohort7. The CMRO2 maps were calculated as OEF×CBF×CaO2 using either a 2D pCASL CBF (2D CMRO2) or a 3D pCASL CBF (3D CMRO2), respectively. CaO2 was estimated from the venous blood sample8. Mean OEF, CBF and CMRO2 were calculated in WB, GM, WM and WS regions respectively for all subjects.
The test-retest repeatability of regional OEF, CBF and CMRO2 were evaluated using intra-session and inter-session percentage within subject coefficient of variation (wCV) in all regions. Repeatability coefficient (RC) was calculated as 1.96$$$\sqrt{2}$$$wCV9. Any longitudinal measurement changes greater than RC can be considered true physiological changes with 95% confidence. To assess inter-session repeatability, a random seed was used to select one observation per subject within each session to create a representative non-biased sample.
Results
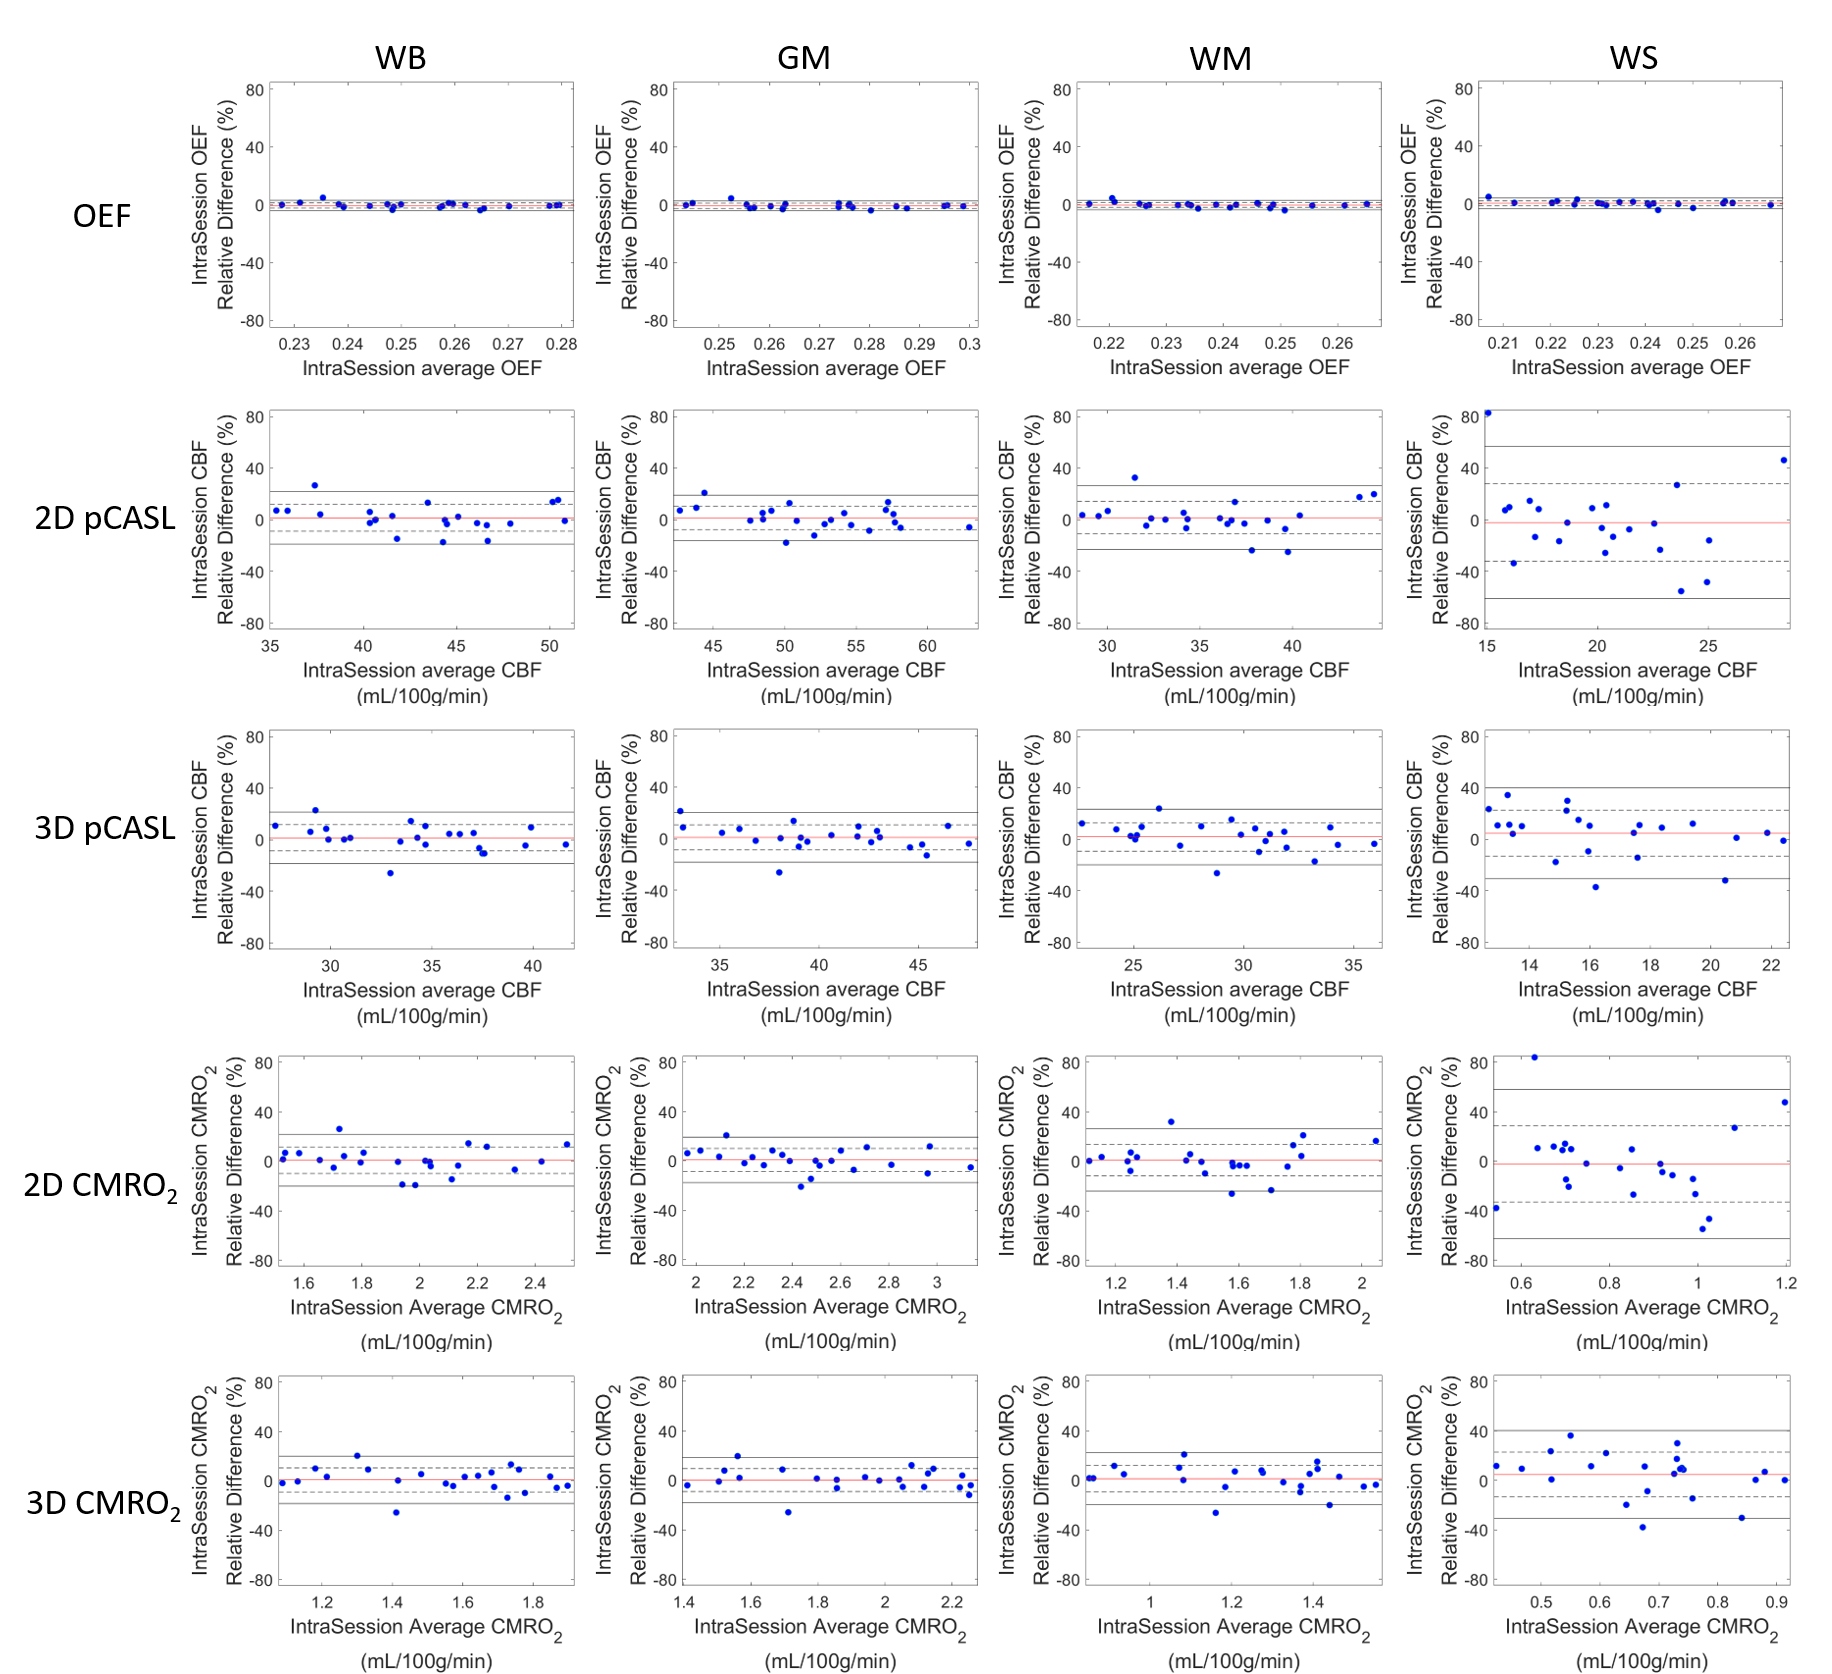
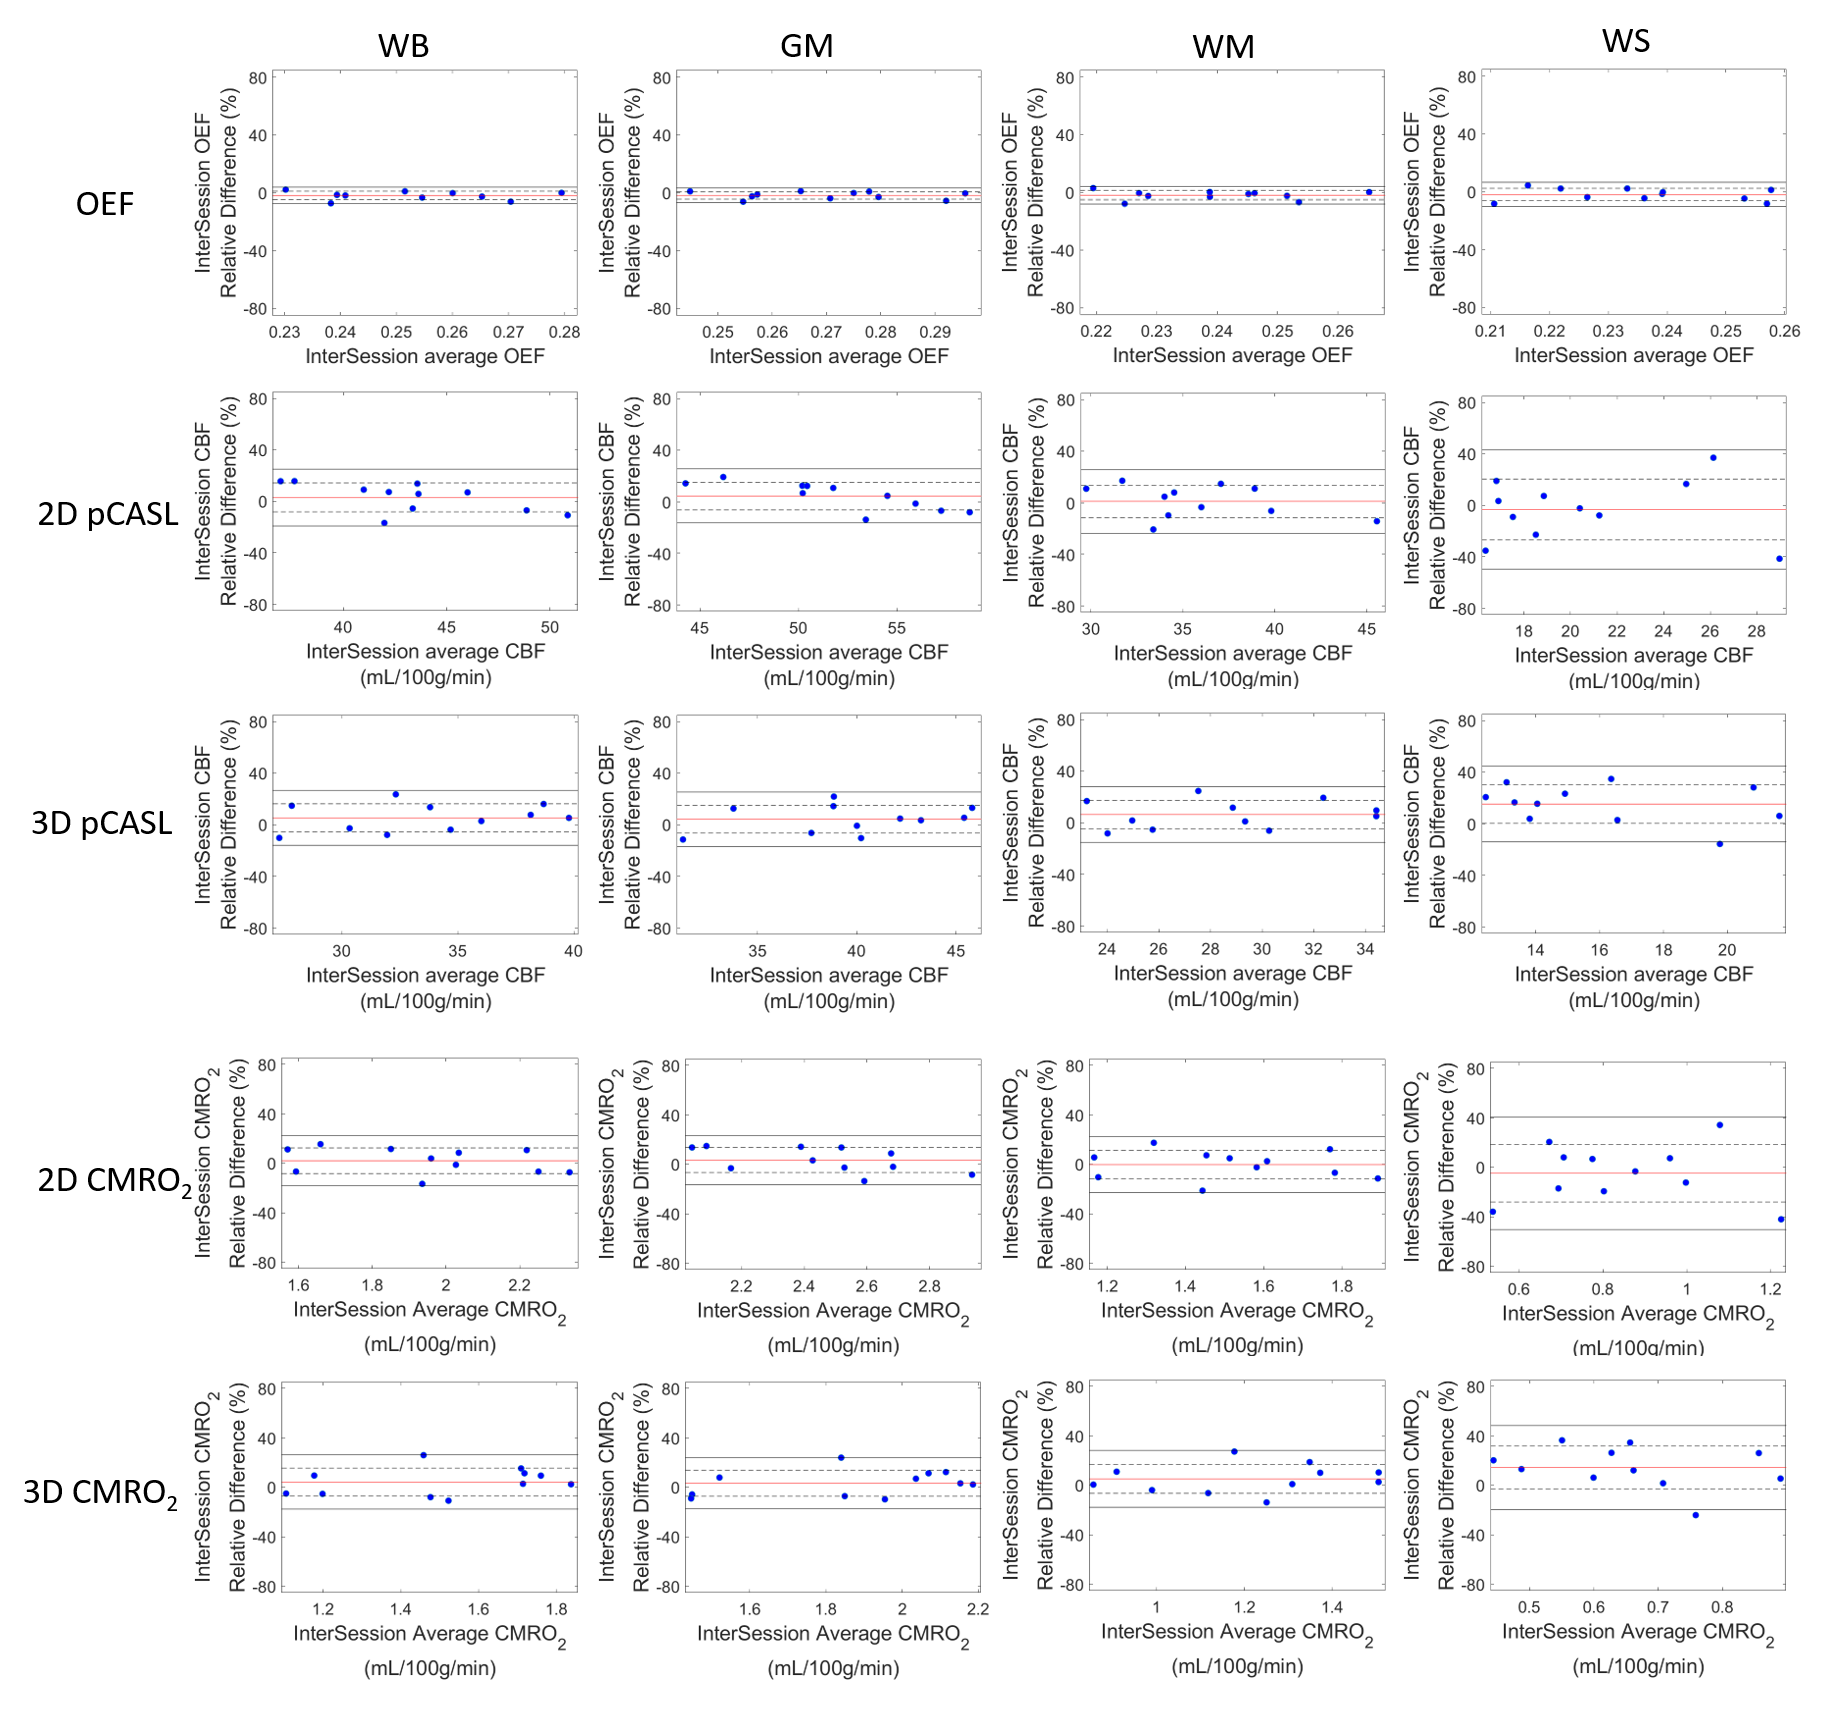
Figure 2 shows the brain tissue segmentation, OEF, CBF and CMRO2 maps from a representative subject. The intra-session and inter-session repeatability of regional OEF, CBF and CMRO2 are demonstrated in Bland-Altman plots in Figure 3 and Figure 4, respectively. The intra-session and inter-session wCV of regional OEF, CBF and CMRO2 are summarized in Table 1. The inter-session wCV were higher than intra-session wCV for all measurements. The intra-session variability might be primarily due to measurement noise, while the inter-session variability includes both methodology and day-to-day physiological variabilities.Discussion
The test-retest repeatability of CBF measured by pCASL was consistent with previous reports10,11. As expected, 3D pCASL had better inter-session repeatability compared to 2D pCASL especially in the WS region, possibly because that the background suppression is beneficial for regions with low SNR10. Using 3D pCASL, our results suggested that a longitudinal CBF change greater than 22.9% in WB, 20.7% in GM, 25.2% in WM and 47.5% in WS indicates a true pathophysiological change. The large variation in pCASL CBF measurement may explain the conflicting findings in literature on whether regional CBF may predict CSVD progression3-6.The test-retest variation of OEF measured with ASE was smaller than that using O-15 PET (intra-session wCV: 1.18% for MRI and 5.7±4.4% for PET12; inter-session wCV: 2.17% for MRI and 9.3% for PET13 in WB). Moreover, the test-retest variation of OEF was smaller than CBF in all regions, suggesting that OEF may be a more reliable imaging biomarker than pCASL CBF. Our results demonstrated that a longitudinal OEF change greater than 6.0% in WB, 5.8% in GM, 6.1% in WM and 7.7% in WS indicates a true pathophysiological change.
CMRO2 had similar test-retest repeatability to CBF, suggesting the variation in CBF measurement is the major contributor to the variation in CMRO2 measurement. Using 3D pCASL for CBF measurement, the test-retest variation of MR-measured CMRO2 was similar to that using O-15 PET (intra-session wCV: 6.47% for MRI and 5.3±3.9% for PET12; inter-session wCV: 8.43% for MRI and 9.3% for PET13 in WB). Our results indicated that a longitudinal CMRO2 change greater than 23.4% in WB, 21.0% in GM, 25.3% in WM and 48.4 % in WS indicates a true pathophysiological change.
Conclusion
We evaluated the test-retest repeatability of MR-measured regional CBF, OEF and CMRO2 in young health subjects. We found that background suppressed 3D pCASL had better repeatability than 2D pCASL, especially in watershed region. The OEF measured with ASE had better repeatability than pCASL CBF. The variation in CBF measurement is the major contributor to the variation in CMRO2 measurement.Acknowledgements
This study was supported by NIH 1R01NS082561 and 1RF1NS116565.References
1. Wang DJ, Alger JR, Qiao JX, Hao Q, Hou S, Fiaz R, Gunther M, Pope WB, Saver JL, Salamon N. The value of arterial spin-labeled perfusion imaging in acute ischemic stroke: comparison with dynamic susceptibility contrast-enhanced MRI. Stroke 2012;43(4):1018-1024.
2. An H, Lin W. Impact of intravascular signal on quantitative measures of cerebral oxygen extraction and blood volume under normo‐and hypercapnic conditions using an asymmetric spin echo approach. Magnetic Resonance in Medicine: An Official Journal of the International Society for Magnetic Resonance in Medicine 2003;50(4):708-716.
3. Nezu T, Yokota C, Uehara T, Yamauchi M, Fukushima K, Toyoda K, Matsumoto M, Iida H, Minematsu K. Preserved acetazolamide reactivity in lacunar patients with severe white-matter lesions: 15O-labeled gas and H2O positron emission tomography studies. J Cereb Blood Flow Metab 2012;32(5):844-850.
4. Ying C, Ford AL, Kang P, Al-Habib A, Fellah S, Chen Y, Lee J-M, An H. Elevated oxygen extraction fraction is a tissue biomarker of chronic ischemia for cerebral small vessel disease. ISMRM 2019; Montreal, Canada.
5. Bahrani AA, Powell DK, Yu G, Johnson ES, Jicha GA, Smith CD. White Matter Hyperintensity Associations with Cerebral Blood Flow in Elderly Subjects Stratified by Cerebrovascular Risk. J Stroke Cerebrovasc Dis 2017;26(4):779-786.
6. Shi Y, Thrippleton MJ, Makin SD, Marshall I, Geerlings MI, de Craen AJM, van Buchem MA, Wardlaw JM. Cerebral blood flow in small vessel disease: A systematic review and meta-analysis. J Cereb Blood Flow Metab 2016;36(10):1653-1667.
7. Ying C, Ford AL, Kang P, Al-Habib A, Fellah S, Chen Y, Lee J-M, An H. Intrinsic vulnerability of low blood flow watershed to white matter hyperintensities in cerebral small vessel disease. ISMRM 2019; Montreal, Canada.
8. Tibby S, Hatherill M, Marsh M, Morrison G, Anderson D, Murdoch I. Clinical validation of cardiac output measurements using femoral artery thermodilution with direct Fick in ventilated children and infants. Intensive care medicine 1997;23(9):987-991.
9. Kinahan PE, Perlman ES, Sunderland JJ, Subramaniam R, Wollenweber SD, Turkington TG, Lodge MA, Boellaard R, Obuchowski NA, Wahl RL. The QIBA profile for FDG PET/CT as an imaging biomarker measuring response to cancer therapy. Radiology 2020;294(3):647-657.
10. Chen Y, Wang DJ, Detre JA. Test–retest reliability of arterial spin labeling with common labeling strategies. Journal of Magnetic Resonance Imaging 2011;33(4):940-949.
11. Wu B, Lou X, Wu X, Ma L. Intra‐and interscanner reliability and reproducibility of 3D whole‐brain pseudo‐continuous arterial spin‐labeling MR perfusion at 3T. Journal of Magnetic Resonance Imaging 2014;39(2):402-409.
12. Coles JP, Fryer TD, Bradley PG, Nortje J, Smielewski P, Rice K, Clark JC, Pickard JD, Menon DK. Intersubject variability and reproducibility of 15O PET studies. Journal of Cerebral Blood Flow & Metabolism 2006;26(1):48-57.
13. Bremmer JP, van Berckel BN, Persoon S, Kappelle LJ, Lammertsma AA, Kloet R, Luurtsema G, Rijbroek A, Klijn CJ, Boellaard R. Day-to-day test–retest variability of CBF, CMRO 2, and OEF measurements using dynamic 15 O PET studies. Molecular imaging and biology 2011;13(4):759-768.
Figures