4334
Quantification of Relative Blood Volume in Squirrel Monkey Brain in vivo using an MRI-based template1Institute of Imaging Science, Vanderbilt University, Nashiville, TN, United States, 2Biomedical Engineering, Vanderbilt University, Nashiville, TN, United States, 3Department of Radiology and Radiological Science, Vanderbilt University, Nashiville, TN, United States
Synopsis
Cerebral blood volume (CBV) is a fundamental hemodynamic characteristic of brain related to blood flow and metabolism. High resolution (sub-millimeter) maps of relative values of CBV (rCBV) provide important information for studies of brain function and changes that occur in brain structure and organization. In this study, by using an intravascular superparamagnetic contrast agent in non-human primates, we quantified high-resolution rCBV maps across subjects, identified alterations of rCBV across regions, and created an rCBV atlas using a brain template.
Introduction
Ultra-high field fMRI has the potential to map neural activity-associated changes at the level of neuronal clusters, tissue laminae, and cortical columns that form the fundamental computational units of the central nervous system. Cerebral blood volume (CBV) is a physiological indicator of changes in the blood and tissue related to flow, metabolism and underlying function. The stability and spatial specificity of relative blood volume (rCBV) are important determinants of our ability to detect structural and functional changes in the brain tissues at millimeter and submillimeter scales. Squirrel monkey (Saimiri sciureus) is a commonly used non-human primate animal model that shares functional and structural similarity to the central nervous system of humans [1]. Monocrystalline iron oxide nanoparticles (MION), with long blood plasma half-life [2] , has been widely used as the intravascular superparamagnetic contrast agent to acquire high-resolution steady-state measures of tissue blood volume. The purpose of this study is to assess rCBV values across regions, lamina and cortical columns based on creation of a squirrel monkey atlas. The atlas provides detailed information of vascular distributions in brain and may help interpret fMRI findings.Materials and Methods
Animal preparation and MRI data acquisitionSix healthy squirrel monkeys were included in this study. Each animal was initially sedated and then anesthetized with isoflurane (0.8–1.0%) delivered with N2O:O2 (70:30) mixture during the entire imaging session. Vital physiological signals such as SpO2, heart rate (Nonin, Plymouth, MN), core temperature, respiratory pattern, and ETCO2 were monitored and maintained at appropriate levels during the scan. All procedures were in compliance with the Institutional Animal Care and Use Committee at Vanderbilt University.
MRI scans were performed on a horizontal Agilent-Varian 9.4T 21-cm bore MRI system. Twenty-four axial images were acquired using a gradient echo sequence (TR/TE = 480/10 ms; FOV = 64×64 mm2; Matrix size = 512×512, 0.125 mm×0.125 mm in plane resolution; Slice thickness = 1 mm). Images were acquired before and after MION contrast agent injection (12 mg/kg). Monkeys were at resting state during the scan.
Data analysis
A customized processing program was implemented in Matlab (The Mathworks Inc., USA). Pre- and post-contrast images were registered using a rigid registration algorithm based on the FSL software package (http://www.fmrib.ox.ac.uk/fsl). The rCBV maps were computed as[3][4]:
$$rCBV=-\frac{1}{TE}ln\frac{S_{post}}{S_{pre}} \ \ \ (1) $$
where Spost and Spre are the post- and pre-contrast signals, respectively.
Registration of VALiDATe29 atlas
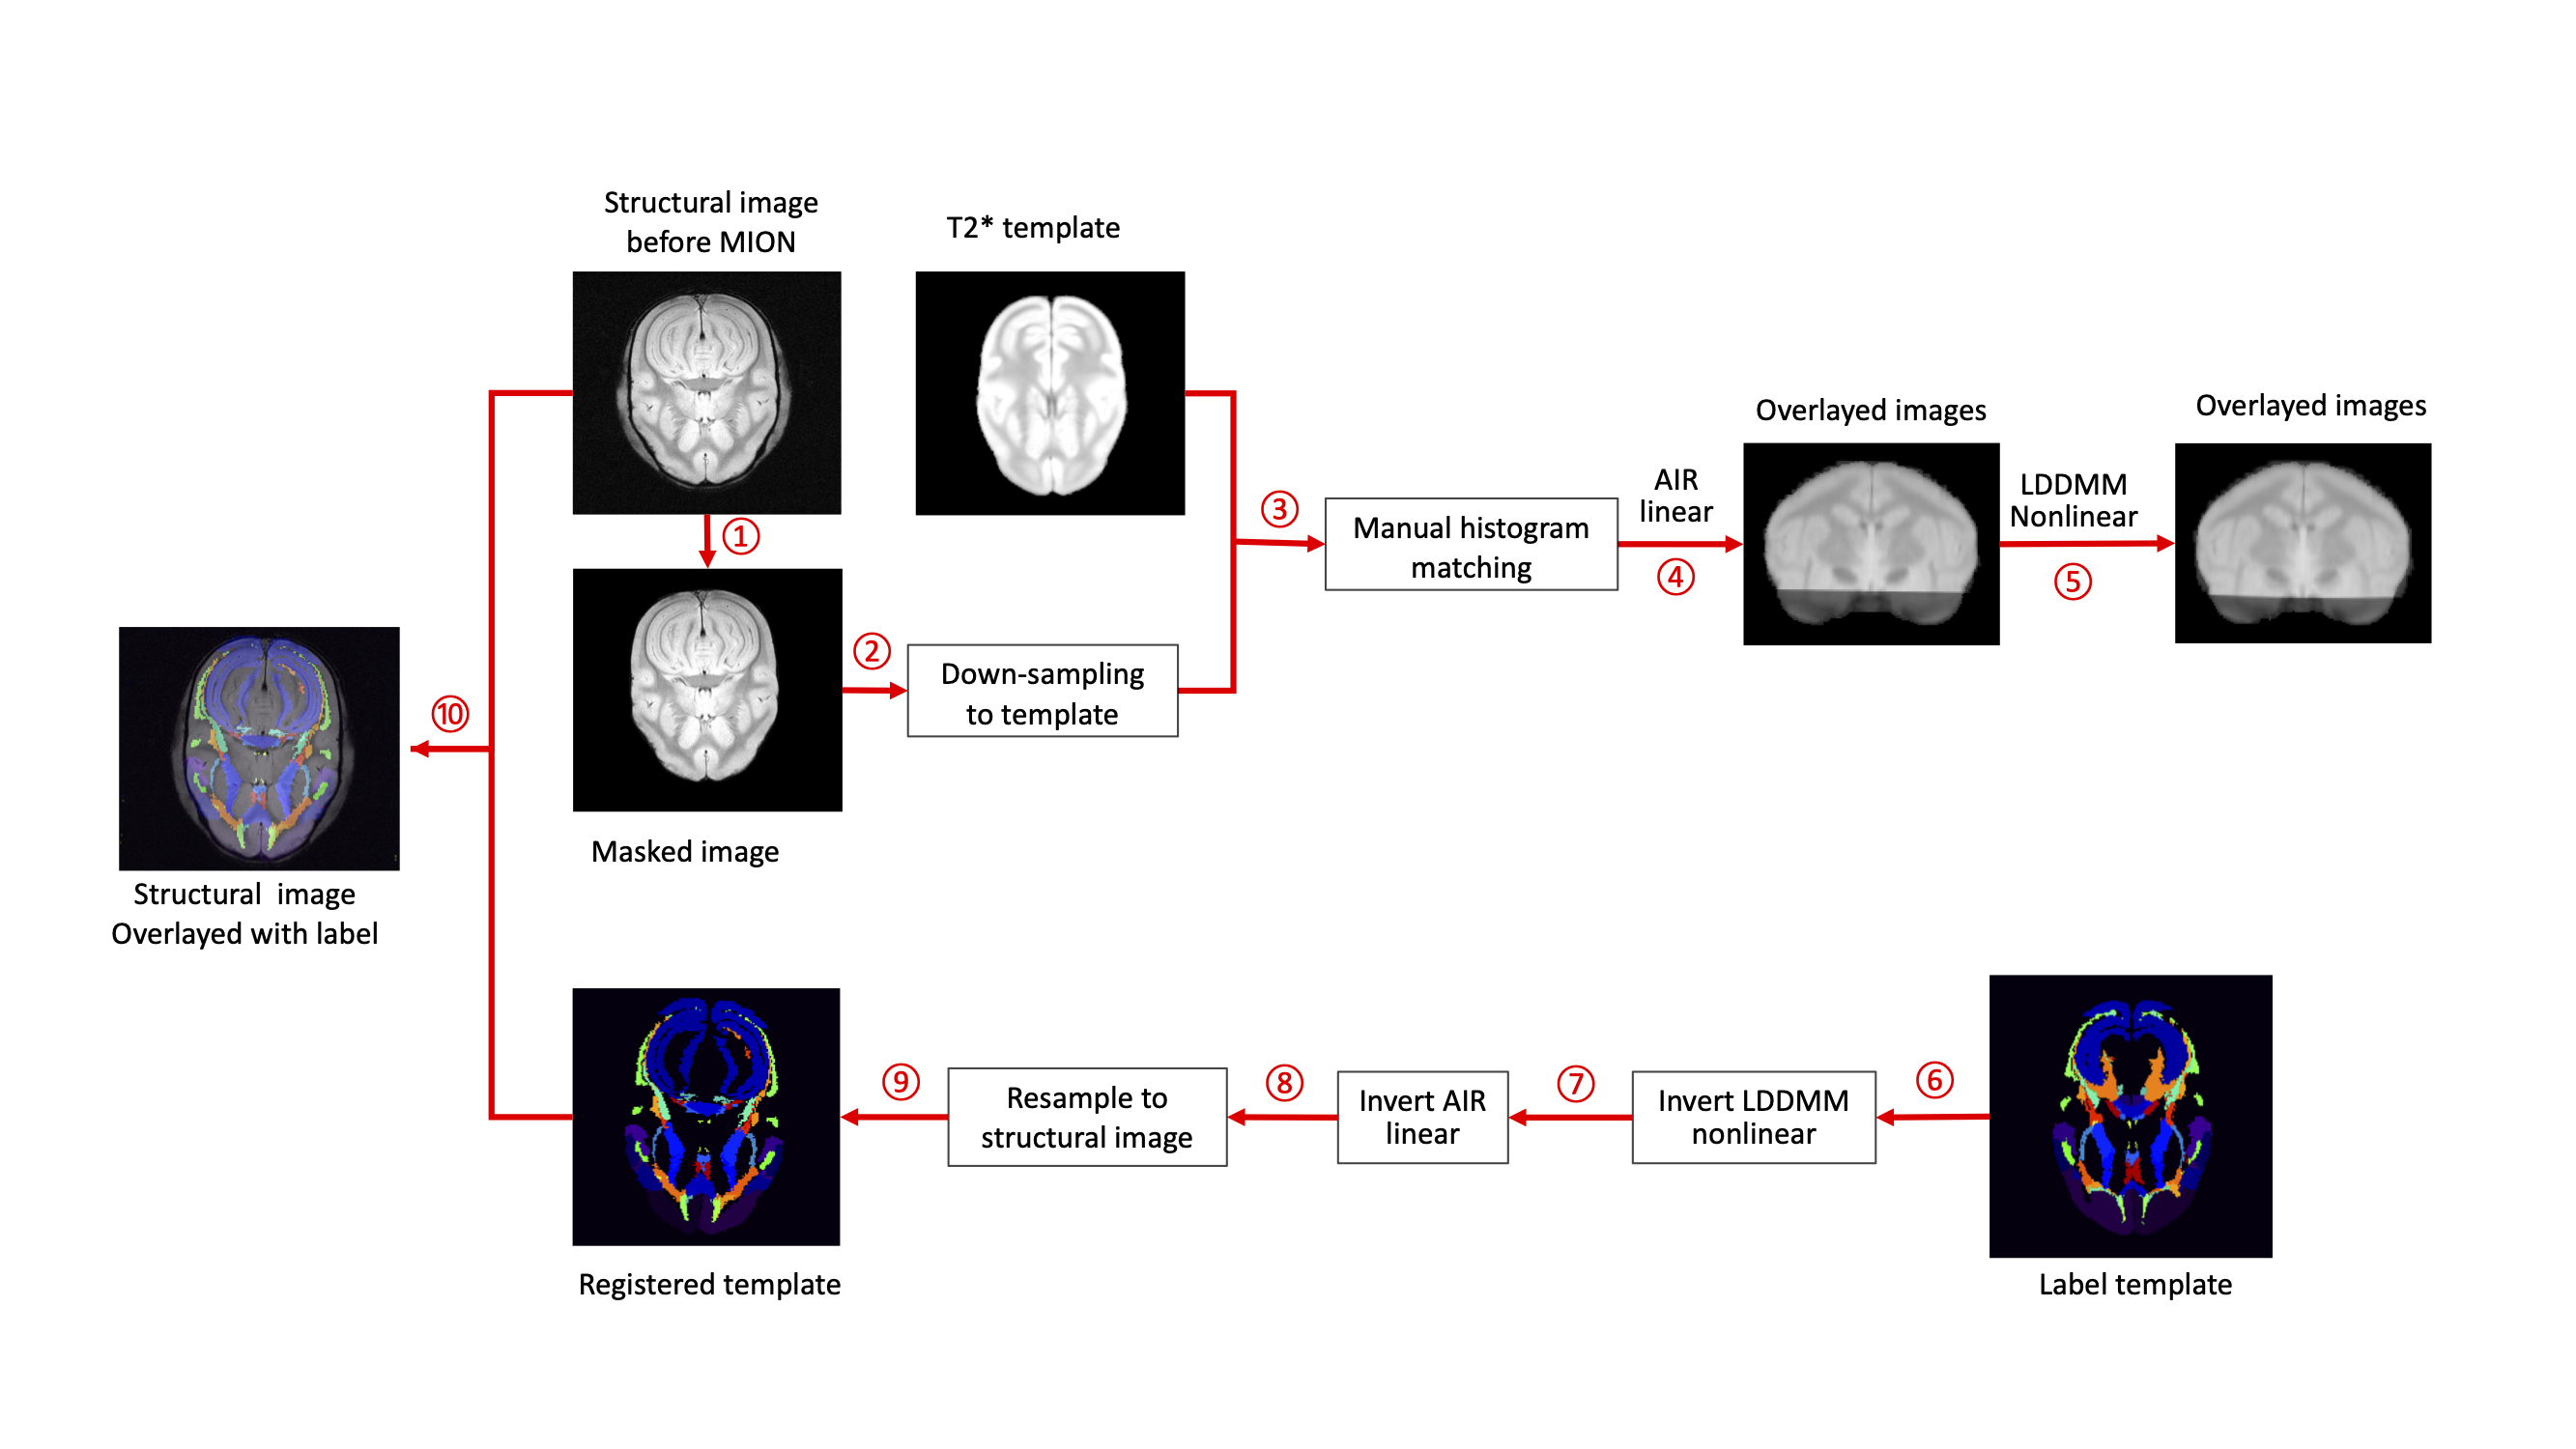
In this study, the the T2*-weighted template image and labels (Matrix size = 212×212; FOV = 63.6×63.6 mm2; Slice thickness = 0.3 mm) from VALiDATe29 atlas [5] were used for registration. T2* images acquired before MION were manually skull stripped using MATLAB. The co-registration of template and acquired images were performed in the DiffeoMap module of the MRI Studio platform (Li, X.; Johns Hopkins University, http://www.mristudio.org). 3D registrations were performed using an affine linear automatic registration (AIR) [6] and non-linear registration via intensity based large deformation diffeomorphic metric (LDDMM) image matching algorithm [7]. Inverses of these transformations were applied to the template labels [8]. Figure 1 shows this processing pipeline. Two tailed parametric Welch’s t-test was used for comparison of different regions. This analysis was conducted using GraphPad Prism (v9, GraphPad Software Inc.).
Results
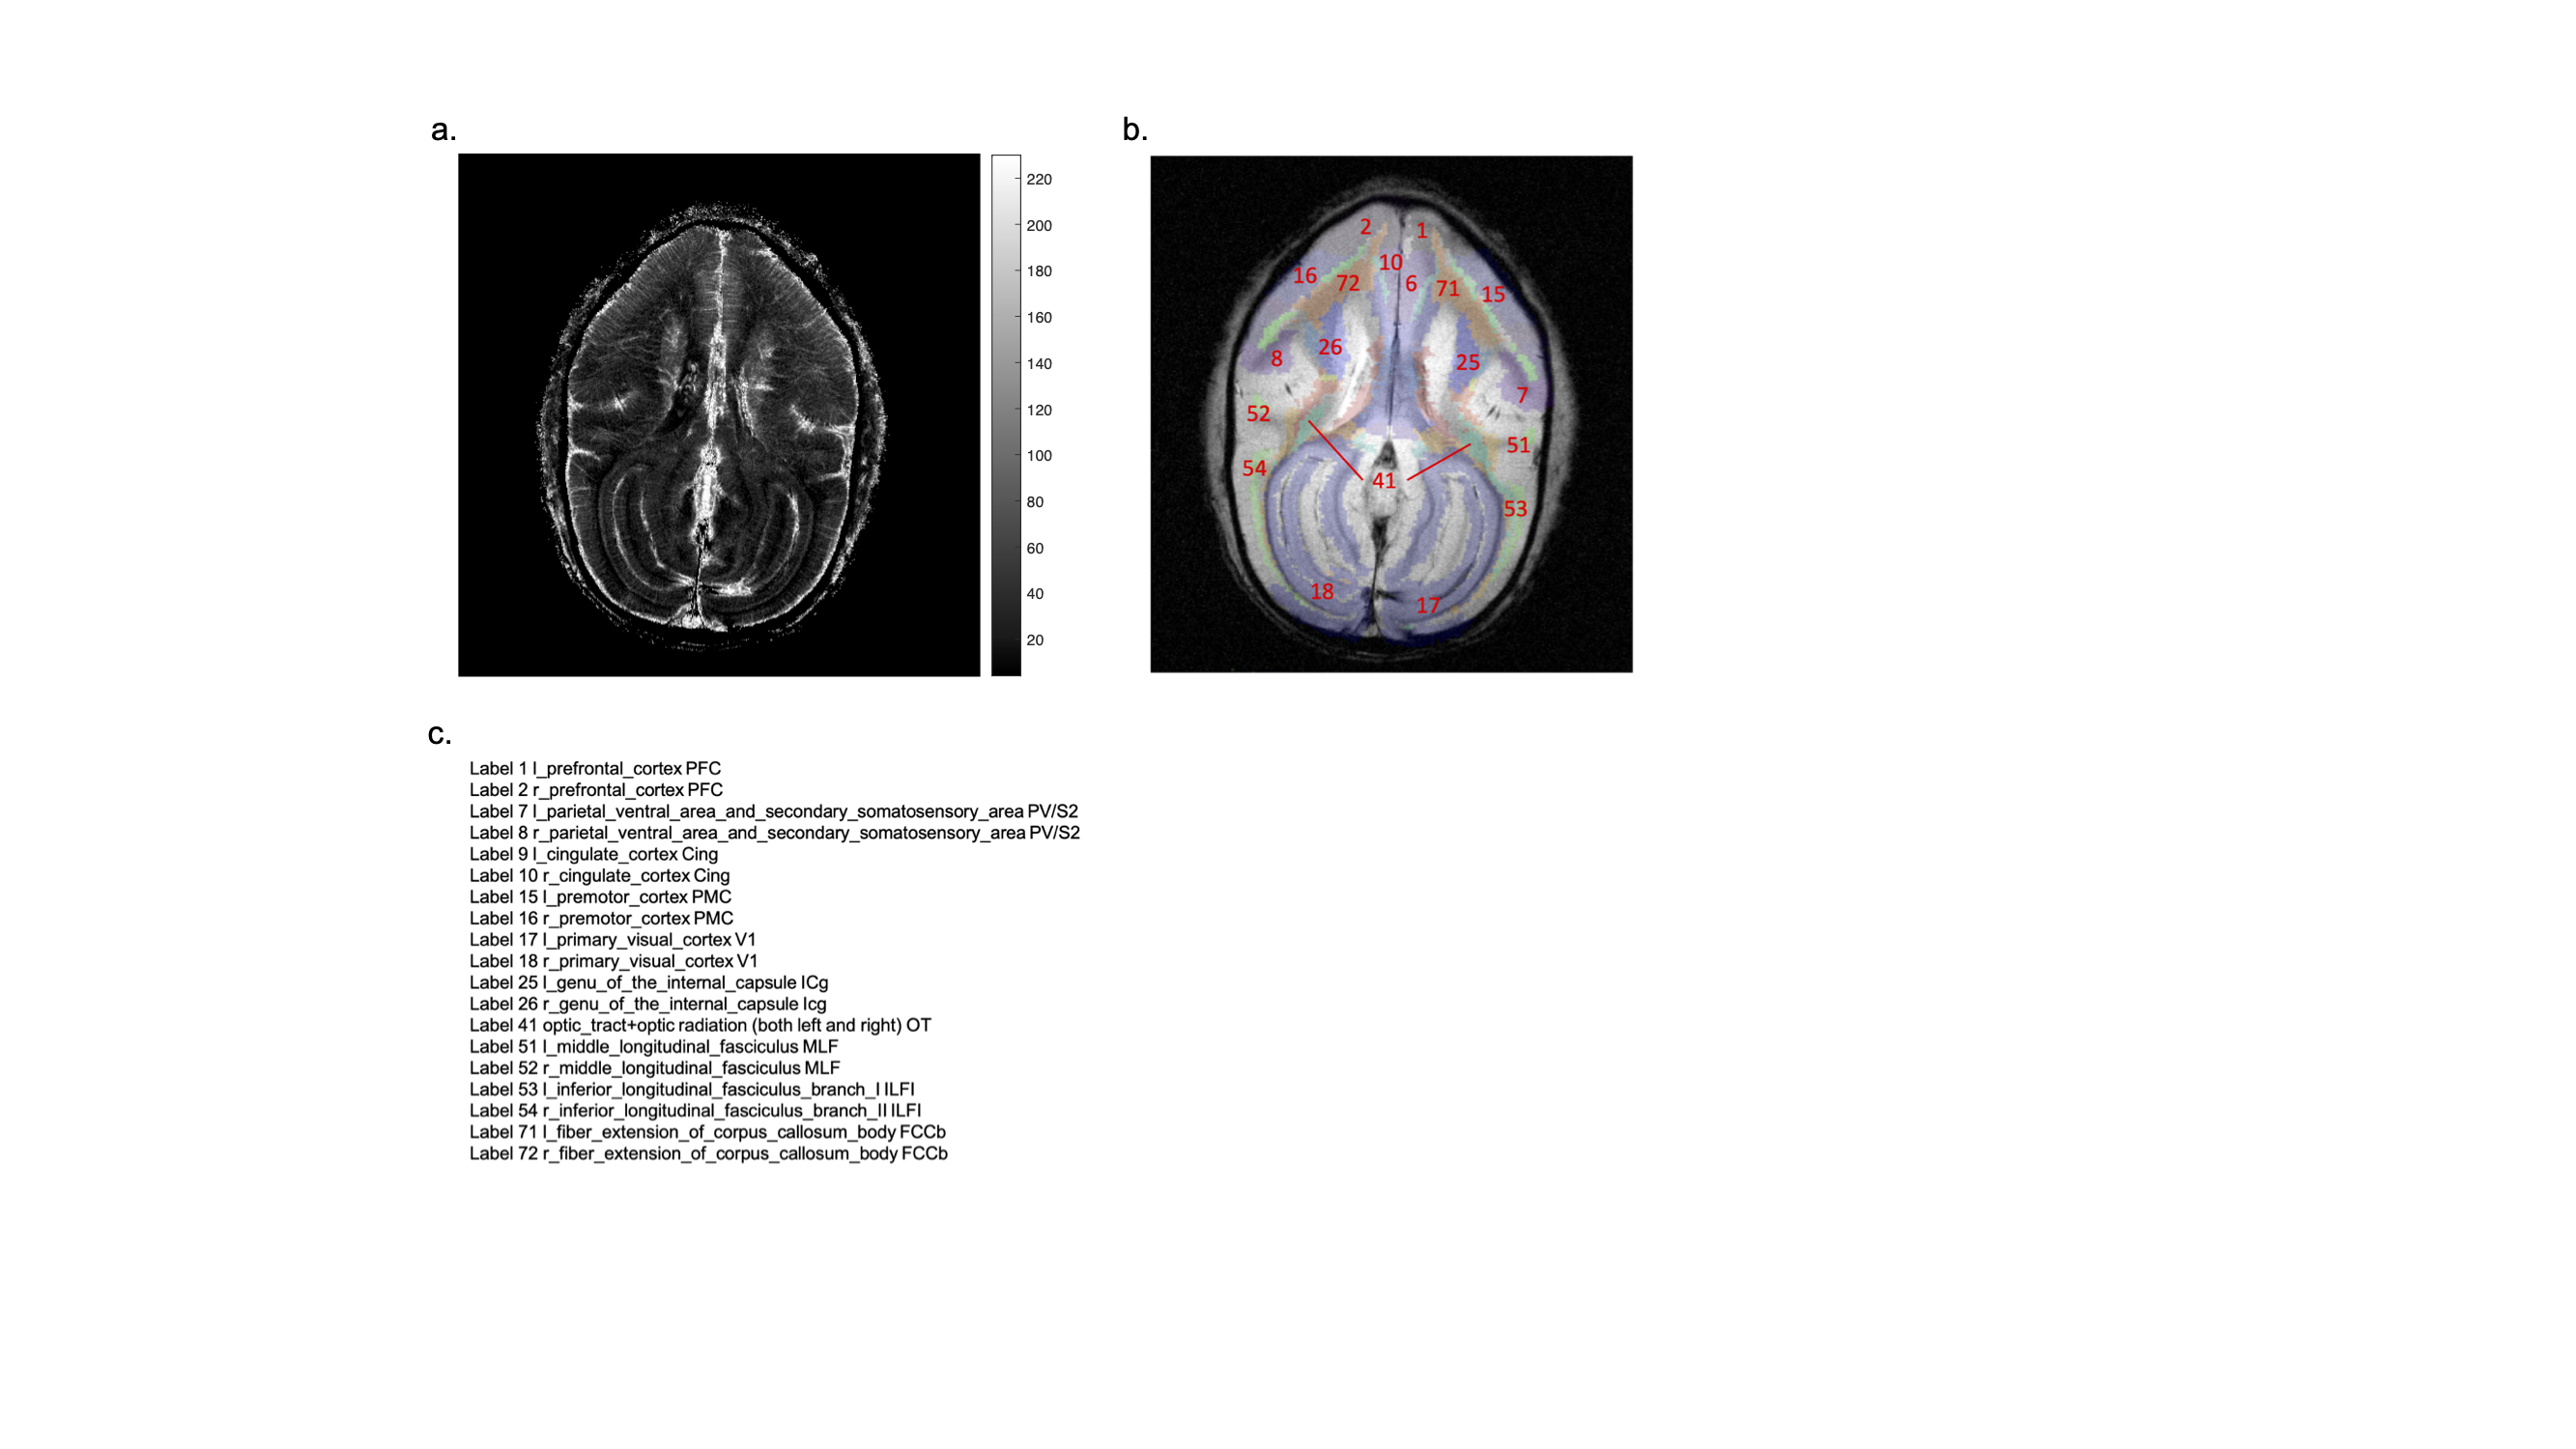
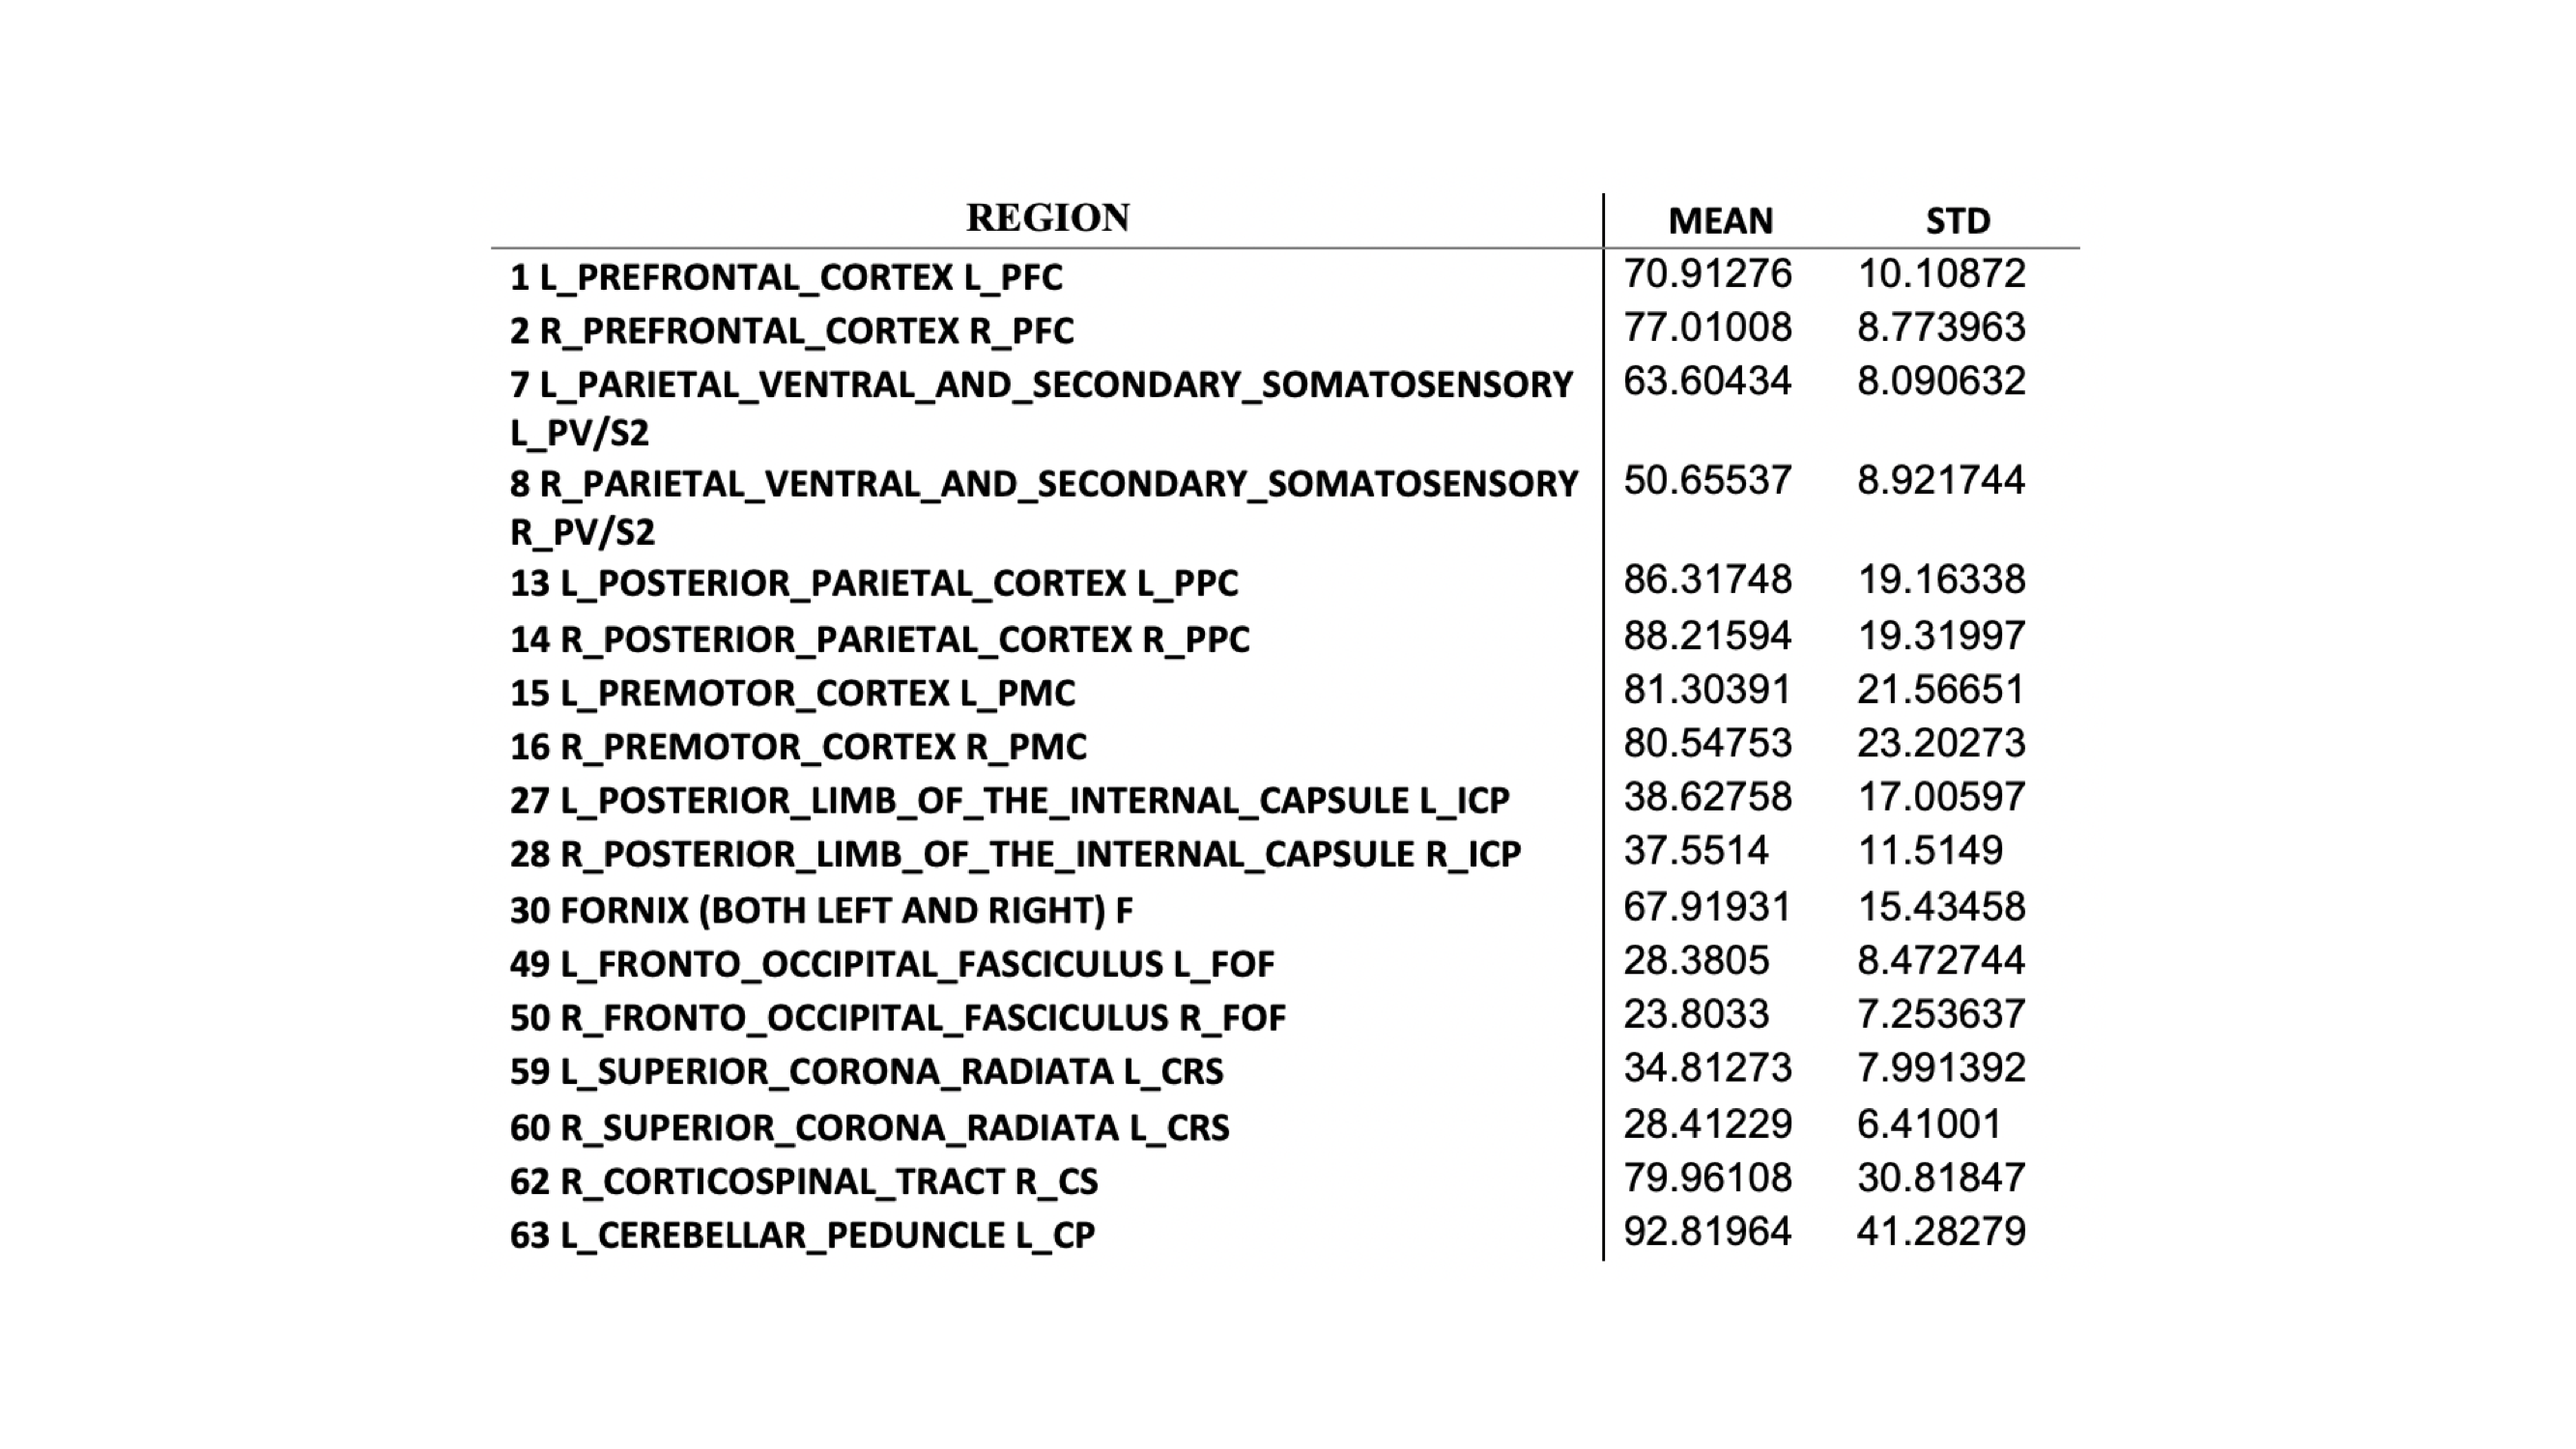
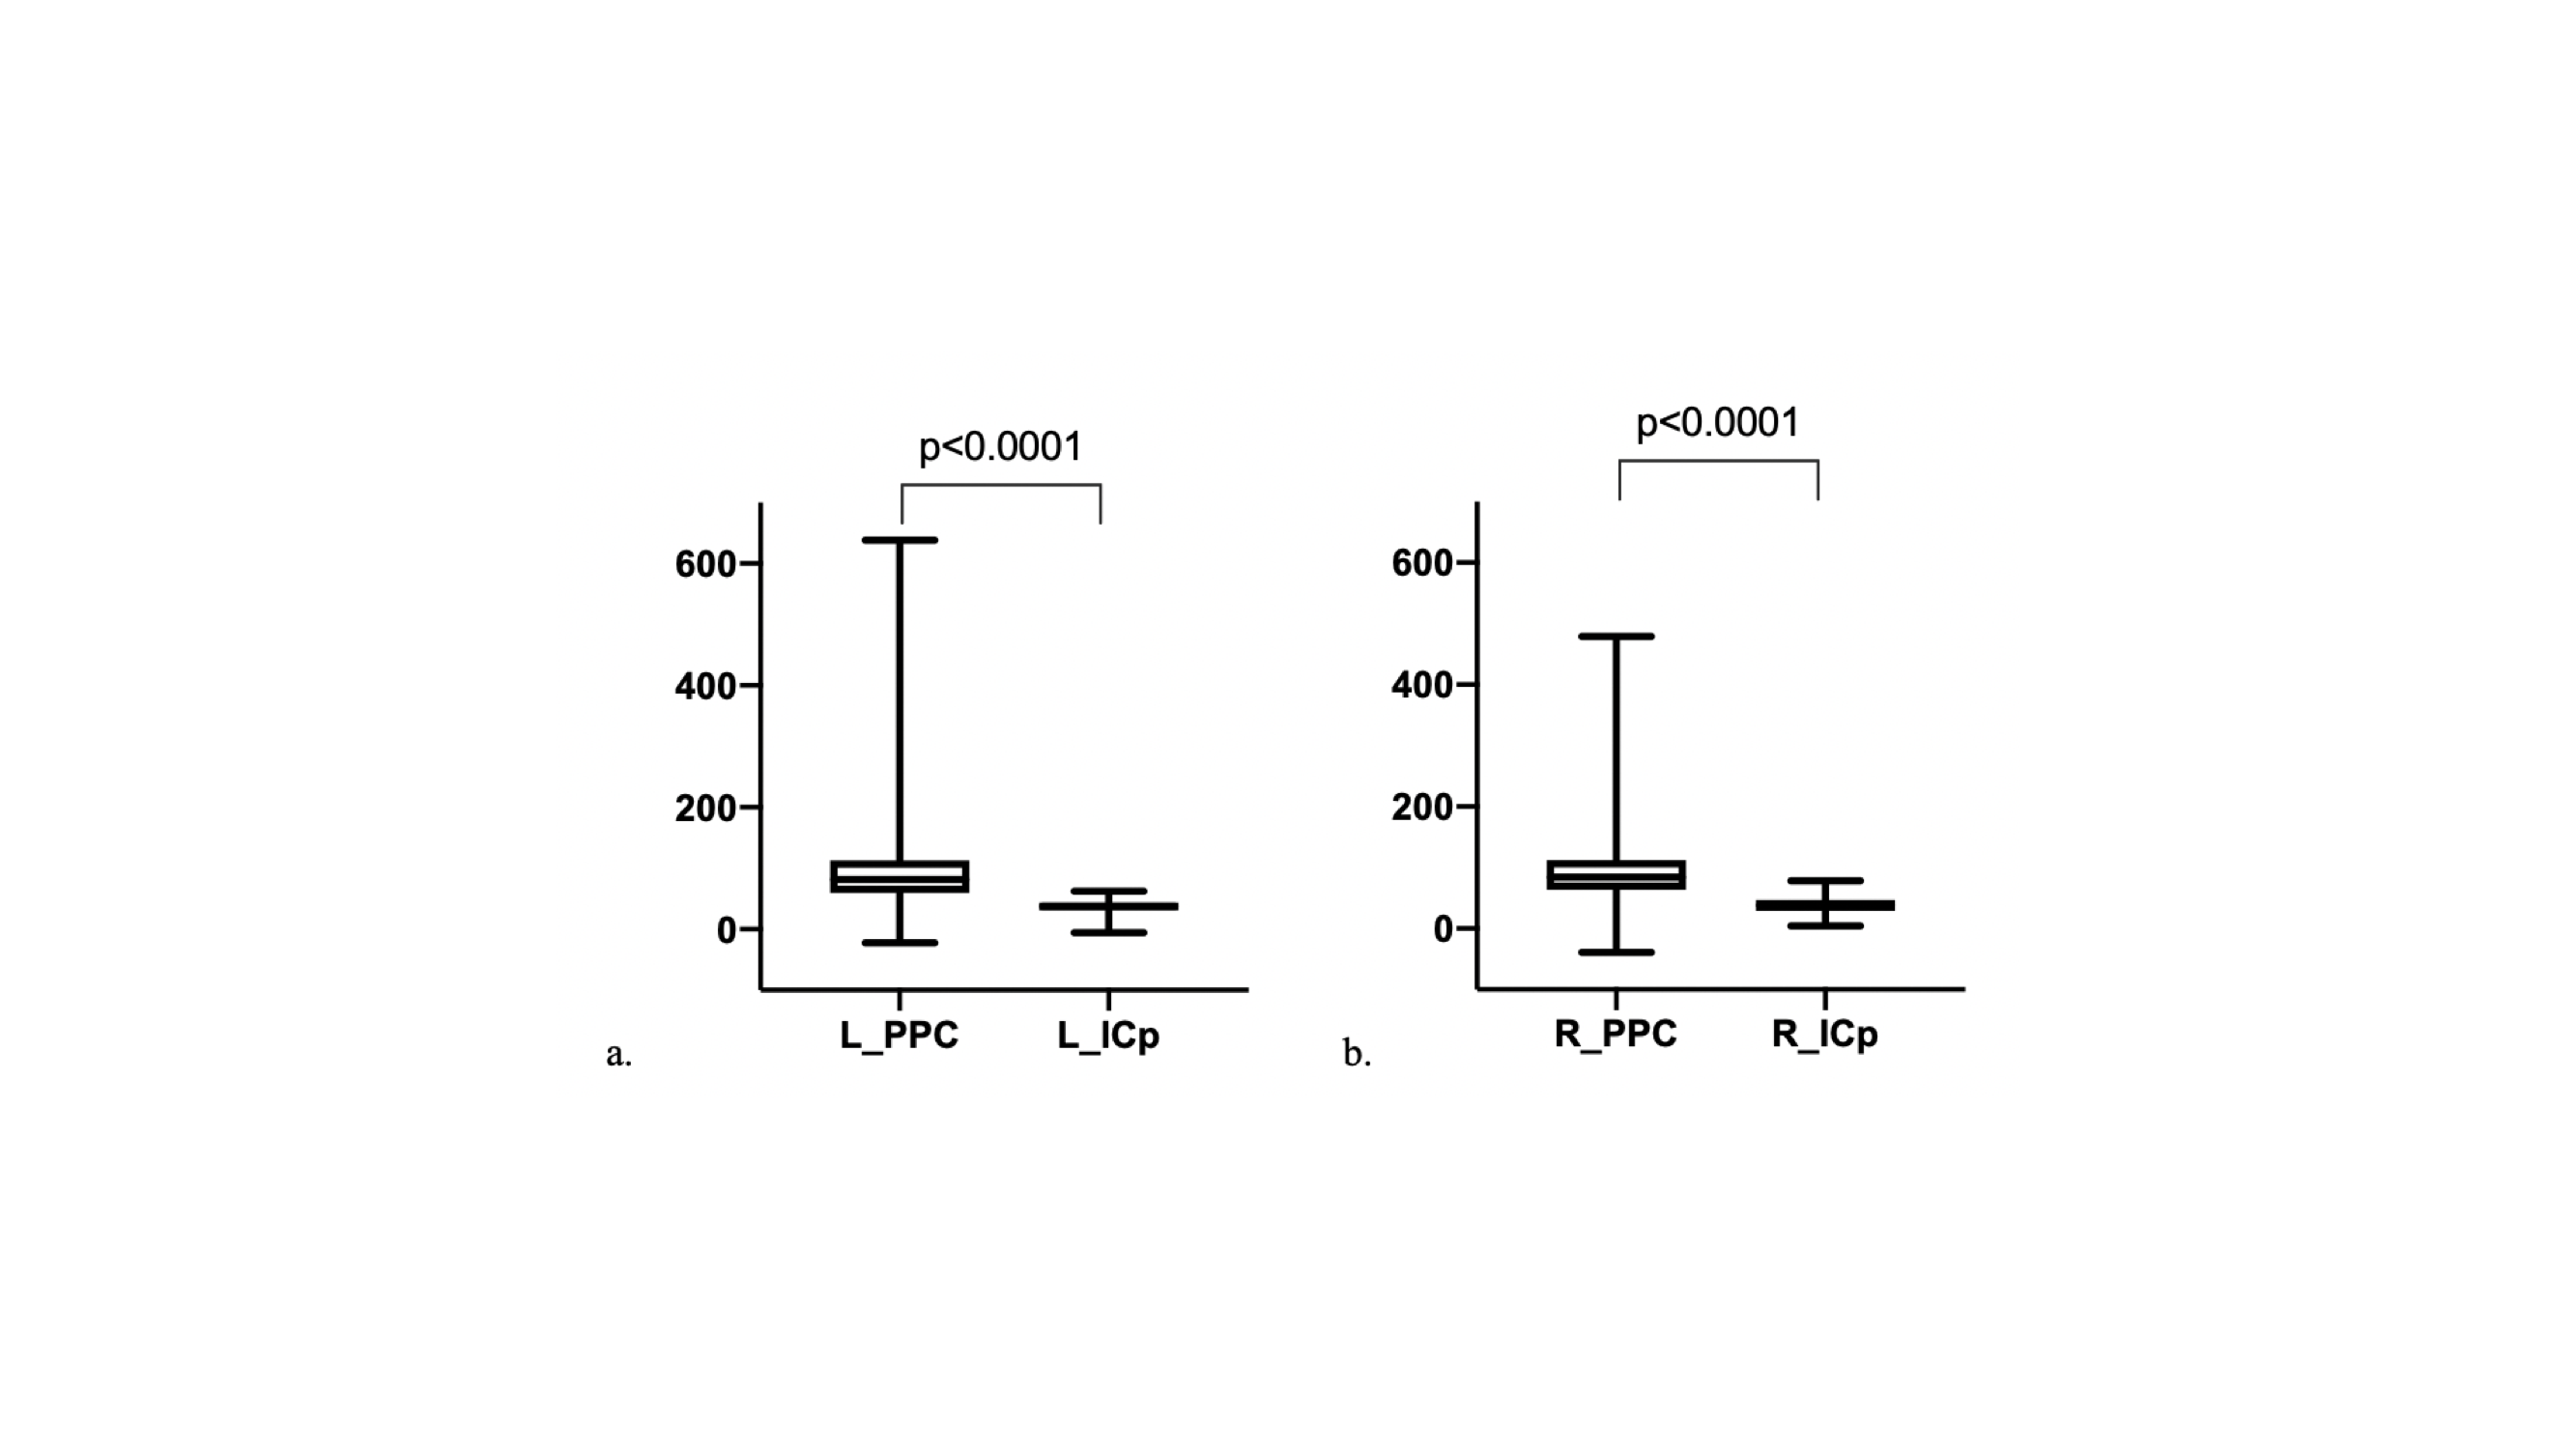
Fig. 2a shows the distribution of vasculature and regional blood volume in a representative brain. In general, gray matter shows higher rCBV than white matter. Transcortical vessels are very dense in the cortex, and rCBV reduces along the cortical depth from the surface. Labels after transform were checked and visually overlaid with structural images before MION using MRICroN. The VALiDATe29 atlas contains a total of 81 regions of interest, comprised of 18 gray matter parcels and 57 white matter tracks (6 additional regions are ventricles). The mean of rCBV was quantified in each ROI for individual squirrel monkeys. Outliers were removed using a 0.1 threshold on both sides from the median value as cut off. Finally, 78 labels were kept for further statistical analysis. Mean and standard deviation of example labels are listed in Table 1. An example of unpaired Welch’s t-test results between posterior parietal cortex (PPC) and posterior limb of the internal capsule (ICp) is shown in Figure 3.Discussion and Conclusion
This study is a first step towards the quantification of rCBV distributions in healthy squirrel monkey brains. For further studies, a larger sample size and combination with other neuropsychological indicators (such as T2* values) will be used to determine the reliability of the measures and confirm signals underlying neuronal origin. The derivation of rCBV values assumes the effective relativity of the intravascular agent is constant everywhere, whereas it is predicted that the ratio of CBV and the change in relaxation rate may depend on the size and geometry of the vasculature [9]. The atlas, combined with subsequent histological measurements, will allow this assumption to be tested.Acknowledgements
This work is supported by National Institutes of Health grant NS078680 (J.C.G). Special thanks to Chaoqi Mu, for his help with the statistics.References
1. Heffner, R. S. & Masterton, R. B. The role of the corticospinal tract in the evolution of human digital dexterity. Brain. Behav. Evol. 23, 165–183 (1983).
2. Shen, T., Weissleder, R., Papisov, M., Bogdanov, A. & Brady, T. J. Monocrystalline iron oxide nanocompounds (MION): Physicochemical properties. Magn. Reson. Med. 29, 599–604 (1993).
3. Kim, S. G. et al. Cerebral blood volume MRI with intravascular superparamagnetic iron oxide nanoparticles. NMR Biomed. 26, 949–962 (2013).
4. Wang, F. et al. Repeatability and sensitivity of high resolution blood volume mapping in mouse kidney disease. J. Magn. Reson. Imaging 39, 866–871 (2014).
5. Schilling, K. G. et al. The VALiDATe29 MRI Based Multi-Channel Atlas of the Squirrel Monkey Brain HHS Public Access. Neuroinformatics 15, 321–331 (2017).
6. Woods, R. P., Grafton, S. T., Holmes, C. J., Cherry, S. R. & Mazziotta, J. C. Automated image registration: I. General methods and intrasubject, intramodality validation. J. Comput. Assist. Tomogr. 22, 139–152 (1998).
7. Beg, M. F., Miller, M. I., Trouvé, A. & Younes, L. Computing large deformation metric mappings via geodesic flows of diffeomorphisms. Int. J. Comput. Vis. 61, 139–157 (2005).
8. Wu, T. L. et al. Resting-state white matter-cortical connectivity in non-human primate brain. Neuroimage 184, 45–55 (2019).
9. Kennan, R. P., Zhong, J. & Gore, J. C. Intravascular susceptibility contrast mechanisms in tissues. Magn. Reson. Med. 31, 9–21 (1994).
Figures