4331
Agreement of CVR maps acquired using hypocapnic and hypercapnic breathing tasks
Kristina M. Zvolanek1,2, Rachael C. Stickland2, Stefano Moia3,4, Apoorva Ayyagari1,2, César Caballero-Gaudes3, and Molly G. Bright1,2
1Biomedical Engineering, Northwestern University, Evanston, IL, United States, 2Physical Therapy and Human Movement Sciences, Northwestern University, Chicago, IL, United States, 3Basque Center on Cognition, Brain and Language, Donostia, [Gipuzkoa], Spain, 4University of the Basque Country EHU/UPV, Donostia, [Gipuzkoa], Spain
1Biomedical Engineering, Northwestern University, Evanston, IL, United States, 2Physical Therapy and Human Movement Sciences, Northwestern University, Chicago, IL, United States, 3Basque Center on Cognition, Brain and Language, Donostia, [Gipuzkoa], Spain, 4University of the Basque Country EHU/UPV, Donostia, [Gipuzkoa], Spain
Synopsis
The addition of a breath-hold or deep breathing task to the beginning of a resting state fMRI scan is a feasible method for cerebrovascular reactivity (CVR) mapping. However, these two tasks rely on different physiological mechanisms with different temporal properties. We used a bespoke analysis method to account for voxelwise hemodynamic lag and assessed its impact on agreement between CVR measurements from each breathing task. Good agreement was observed both across the brain and across subjects, regardless of hemodynamic lag correction, indicating both tasks are comparable options for BOLD CVR measurements in healthy subjects.
Introduction
Cerebrovascular reactivity (CVR) mapping with MRI is an emerging metric of vascular health1,2. Current research efforts are developing a CVR mapping protocol that is feasible to incorporate into fMRI studies, enabling characterization of vascular factors that may confound neural fMRI signals3–5. Previous work demonstrated the addition of a short breathing task, either breath-holding (BH) or cued-deep-breathing (CDB), to the beginning of a resting-state fMRI scan improves modeling of CVR in BOLD fMRI data6. Furthermore, adding simple breathing tasks improves voxelwise characterization of hemodynamic delay (lag)6,7, which may be important for denoising in resting-state connectivity analyses8. Building on this work, we assess the spatial agreement of CVR and lag estimates modelled in these data, and determine the impact of lag optimization on CVR map consistency between the two breathing tasks. We predict CVR estimates derived from hypercapnic BH and hypocapnic CDB tasks will show good spatial and inter-subject agreement, and that correcting for hemodynamic lag will further improve this. Previous comparisons of the two tasks identified comparable CVR maps9,10, but these studies did not account for voxelwise variations in offset between end-tidal CO2 (PETCO2) and BOLD changes, which can mis-estimate CVR. In this study, we seek to determine the impact of breathing task choice with more refined CVR and lag mapping analyses and to ascertain whether BH and CDB tasks can be used interchangeably or provide distinct physiological information.Methods
Data: Imaging data were collected in 9 healthy participants (6 F; 26±4 years) on a 3T Siemens PrismaFit scanner with 64-channel head coil. BOLD-weighted sequences were gradient-echo EPI (TR/TE=1200/34ms, 60 slices, multiband factor=4, resolution=2mm3). All participants completed BH and CDB tasks followed by 8-minutes of rest (Fig1). PETCO2 was sampled continuously via nasal cannula and gas analyzer (ADInstruments).BOLD CVR Analysis: PETCO2 values, convolved with a canonical HRF, were shifted ±15s in 0.3s increments. Both BOLD fMRI datasets (registered to the same SBref image) were modelled by polynomial drift terms, 6 motion parameters, and the PETCO2 timeseries in a generalized linear model framework. CVR maps (No-Opt CVR, %BOLD/mmHg) were obtained by dividing the unshifted PETCO2 regressor fit coefficient by the fitted timeseries mean. This was repeated for shifted variants of the PETCO2 regressor, with lag (seconds) determined as the shift with highest model R2 in each voxel. Lag-optimized CVR maps (Opt-CVR, %BOLD/mmHg) were generated with the fit of this shifted regressor7. Fig1 shows No-Opt-CVR, Opt-CVR, and lag maps for an example subject.
Spatial Analysis: For each subject, voxelwise correlations were performed between BH and CDB data for No-Opt-CVR, Opt-CVR, and lag measures. Only voxels with positive, significant (p<0.05) No-Opt-CVR and positive Opt-CVR in BH and CDB maps were included. Negative CVR values were excluded as they represent different physiological mechanisms (e.g. CSF mechanisms)11. The strength of a linear fit (R2) between each measure was converted to a Fisher’s Z (ZF).
Across-Subject Analysis: CVR and lag were averaged across voxels included in the spatial correlation analysis for each subject. Bland-Altman analysis quantified agreement between BH and CDB measures and identified outliers. Correlation analyses were performed to compare mean BH and CDB CVR (both No-Opt and Opt) and lag measurements across subjects. Finally, to assess regional bias, subject CVR maps were transformed to MNI space and group-mean differences in BH and CDB CVR were computed.
Results
BH-CDB Agreement Across the Brain: Fig2 shows ZF values for each subject and group averages. In all subjects, there is a positive, significant relationship between BH and CDB CVR, both with and without lag optimization. Group average ZF values are comparable for No-Opt and Opt CVR (both=1.1). Associations between BH and CDB lag are smaller, but still positive and significant for all subjects (group average=0.26). BH-CDB Agreement Across Subjects: Mean differences between BH and CDB metrics in the Bland-Altman analysis were not significant based on a one-sample t-test, indicating no significant bias in these whole-brain measurements (Fig3). Two subjects outside the limits of agreement were removed from the respective across-subject correlation analyses. In the voxelwise Bland-Altman analysis (Fig4), the majority of voxels with significant bias were in white matter or CSF (~82%), where CVR is not typically assessed. Mean CVR differences across gray matter were small for both No-Opt and Opt (-0.0002 %BOLD/mmHg). Fig5 shows average CVR and lag for each subject, taken within voxels included in the correlation analysis. Correlations between BH and CDB measurements across subjects were significant for No-Opt CVR (r=0.92,p=0.0012), Opt-CVR (r=0.97,p=7.2E-5), and lag (r=0.75,p=0.033).Discussion
BH and CDB CVR estimates show good agreement across the brain and across subjects. Contrary to our hypothesis, hemodynamic lag correction does not appear to significantly improve this agreement. One explanation for this observation is that lag-optimization changes CVR values in the same direction for both mechanisms (i.e. under-estimation of CVR is equivalently corrected in both BH and CDB). Hemodynamic lag likely reflects regional arterial transit delays, which would be spatially similar for both breathing tasks. The spatial and across-subject agreement indicate that BH and CDB tasks, within the levels of hypercapnia and hypocapnia achieved here, could provide comparable assessments of vascular physiology in healthy participants. Future work should determine the relationship between BH and CDB CVR in vascular pathologies.Acknowledgements
M.G.B. was supported by the Eunice Kennedy Shriver National Institute of Child Health and Human Development of the National Institutes of Health (NIH) under award number K12HD073945. K.Z. was supported by an NIH-funded training program (T32EB025766). S.M. was supported by the European Union’s Horizon 2020 research and innovation program (Marie Skłodowska-Curie grant agreement No. 713673) and a fellowship from La Caixa Foundation (ID 100010434, fellowship code LCF/BQ/IN17/11620063). C.C.G was supported by the Spanish Ministry of Economy and Competitiveness (Ramon y Cajal Fellowship, RYC-2017- 21845), the Basque Government (BERC 2018-2021 and PIBA_2019_104) and the Spanish Ministry of Science, Innovation and Universities (MICINN; PID2019-105520GB-100). The authors would like to thank the staff at Northwestern University’s Center for Translational Imaging for their support in acquiring these data.References
1. Pillai, J. J. & Mikulis, D. J. Cerebrovascular reactivity mapping: An evolving standard for clinical functional imaging. American Journal of Neuroradiology 36, 7–13 (2015).2. Urback, A. L., MacIntosh, B. J. & Goldstein, B. I. Cerebrovascular reactivity measured by functional magnetic resonance imaging during breath-hold challenge: A systematic review. Neuroscience and Biobehavioral Reviews 79, 27–47 (2017).
3. Liu, P. et al. Cerebrovascular reactivity mapping using intermittent breath modulation. Neuroimage 215, 116787 (2020).
4. Chu, P. P. W., Golestani, A. M., Kwinta, J. B., Khatamian, Y. B. & Chen, J. J. Characterizing the modulation of resting-state fMRI metrics by baseline physiology. Neuroimage 173, 72–87 (2018).
5. Bright, M. G., Whittaker, J. R., Driver, I. D. & Murphy, K. Vascular physiology drives functional brain networks. Neuroimage 217, 116907 (2020).
6. Stickland, R., Ayyagari, A., Zvolanek, K. & Bright, M. Short breathing tasks at the start of a resting state fMRI scan: feasible measures of cerebrovascular reactivity and hemodynamic lag (ISMRM2020: Oral Power Pitch, #1112). in ISMRM & SMRT Virtual Conference & Exhibition 08-14 August (2020). doi:10.13140/RG.2.2.23894.88644/1
7. Moia, S. et al. Voxelwise optimization of hemodynamic lags to improve regional CVR estimates in breath-hold fMRI. (2020).
8. Bright, M. G., Tench, C. R. & Murphy, K. Potential pitfalls when denoising resting state fMRI data using nuisance regression. Neuroimage (2017). doi:10.1016/j.neuroimage.2016.12.027
9. Bright, M. G., Bulte, D. P., Jezzard, P. & Duyn, J. H. Characterization of regional heterogeneity in cerebrovascular reactivity dynamics using novel hypocapnia task and BOLD fMRI. Neuroimage 48, 166–175 (2009).
10. Bright, M. G., Donahue, M. J., Duyn, J. H., Jezzard, P. & Bulte, D. P. The effect of basal vasodilation on hypercapnic and hypocapnic reactivity measured using magnetic resonance imaging. J. Cereb. Blood Flow Metab. 31, 426–438 (2011).
11. Thomas, B. P. et al. Physiologic underpinnings of negative BOLD cerebrovascular reactivity in brain ventricles. Neuroimage 83, 505–512 (2013).
Figures
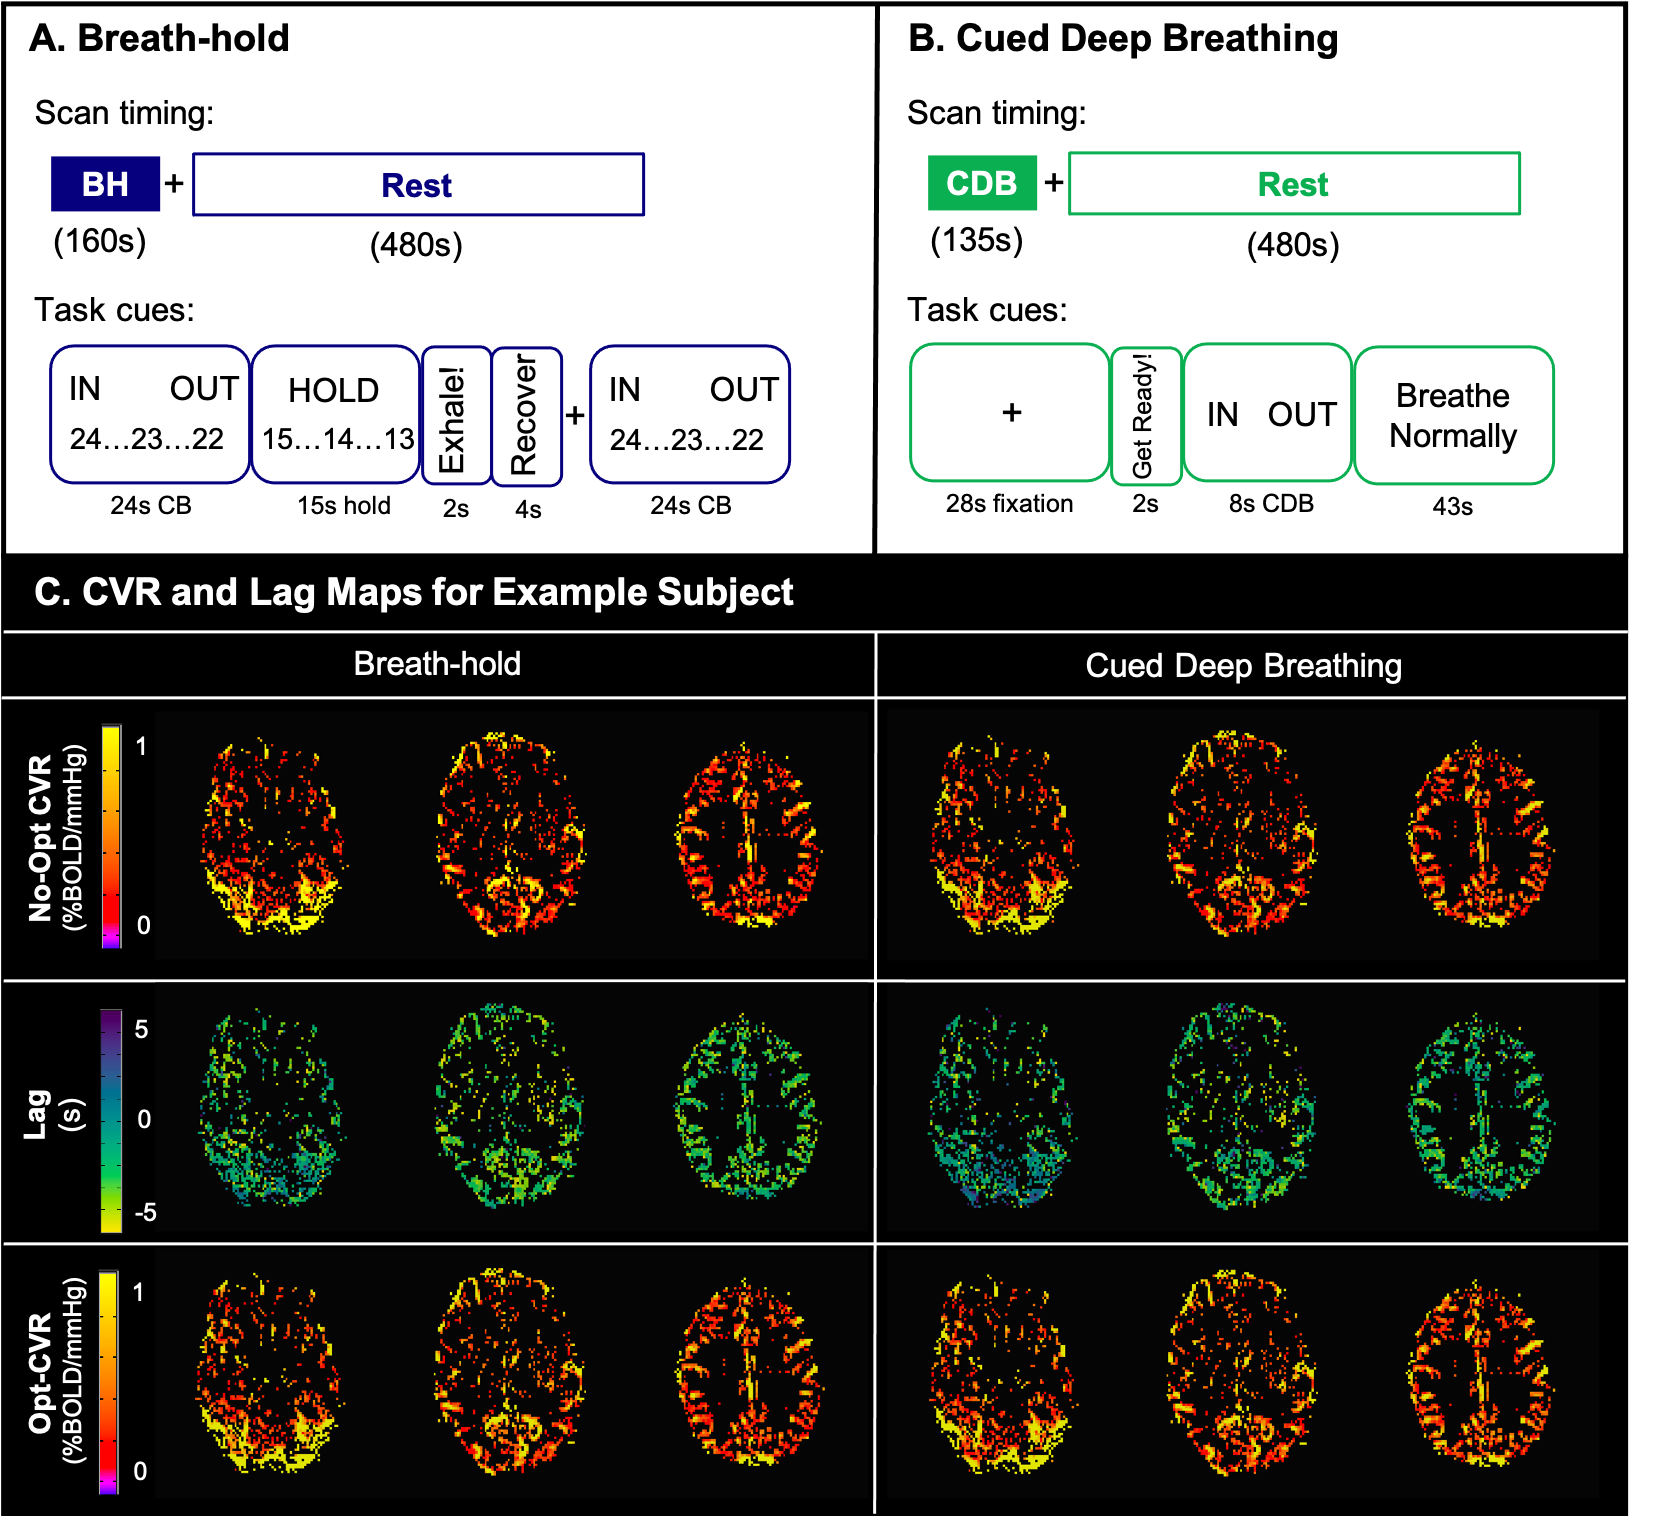
Scan protocols and visual instructions for A) breath-holding and B) cued deep breathing tasks. C) Cerebrovascular reactivity (CVR) and lag maps for an example subject using breath-hold (left) and cued deep breathing (right). The top row shows CVR without correction for lag (No-Opt CVR), the middle row shows lag maps, and the bottom row shows CVR after lap optimization (Opt-CVR). Maps are thresholded to voxels included in the correlation analysis.
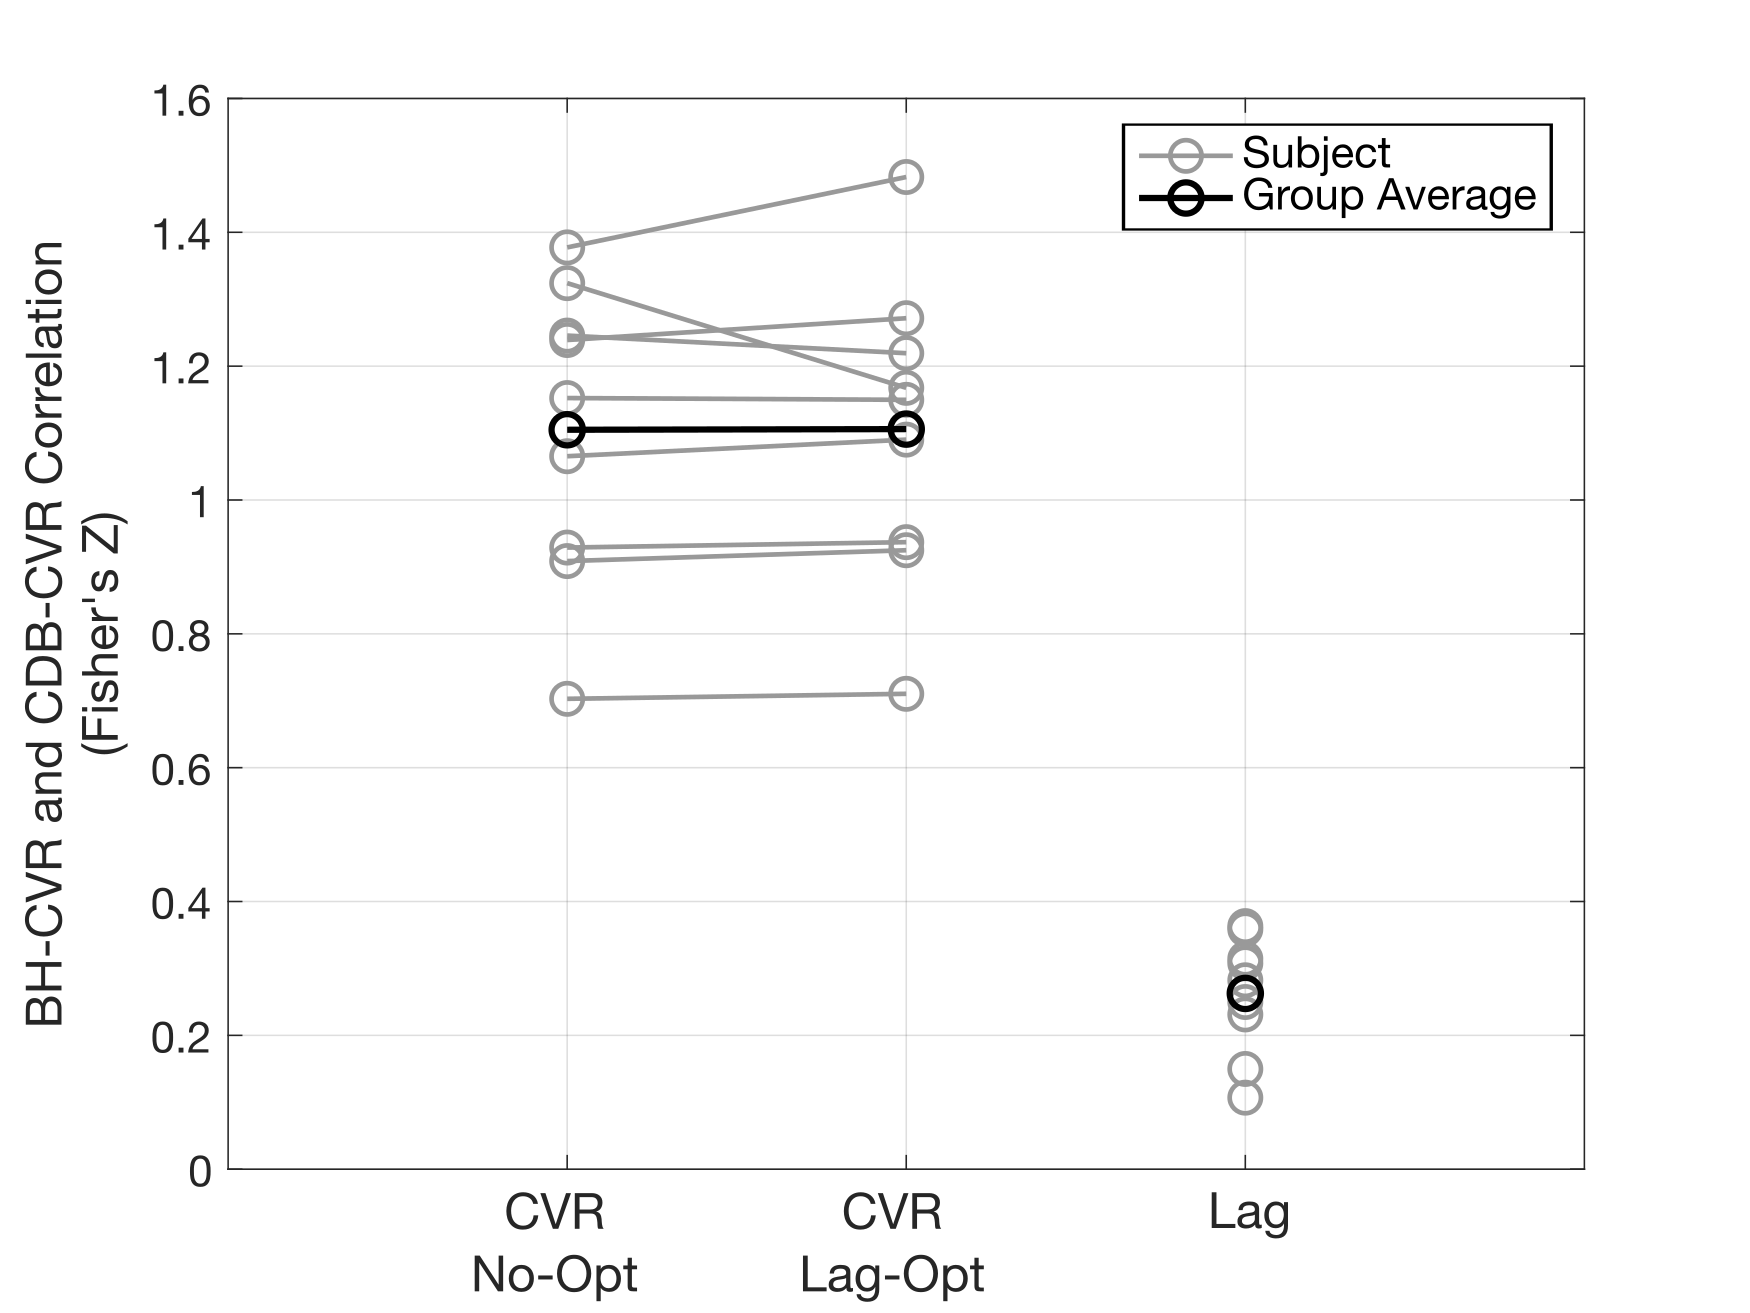
Voxelwise correlations between breath-hold (BH) and cued deep breathing (CDB) cerebrovascular reactivity (CVR) before lag optimization (No-Opt), lag-optimized CVR (Lag-Opt), and lag. A Fisher's Z transform was performed on individual subject correlations to calculate a group average. All single subject Fisher’s Z values are significantly different from 0 at an alpha-level of 0.05 (Z>0.0232).
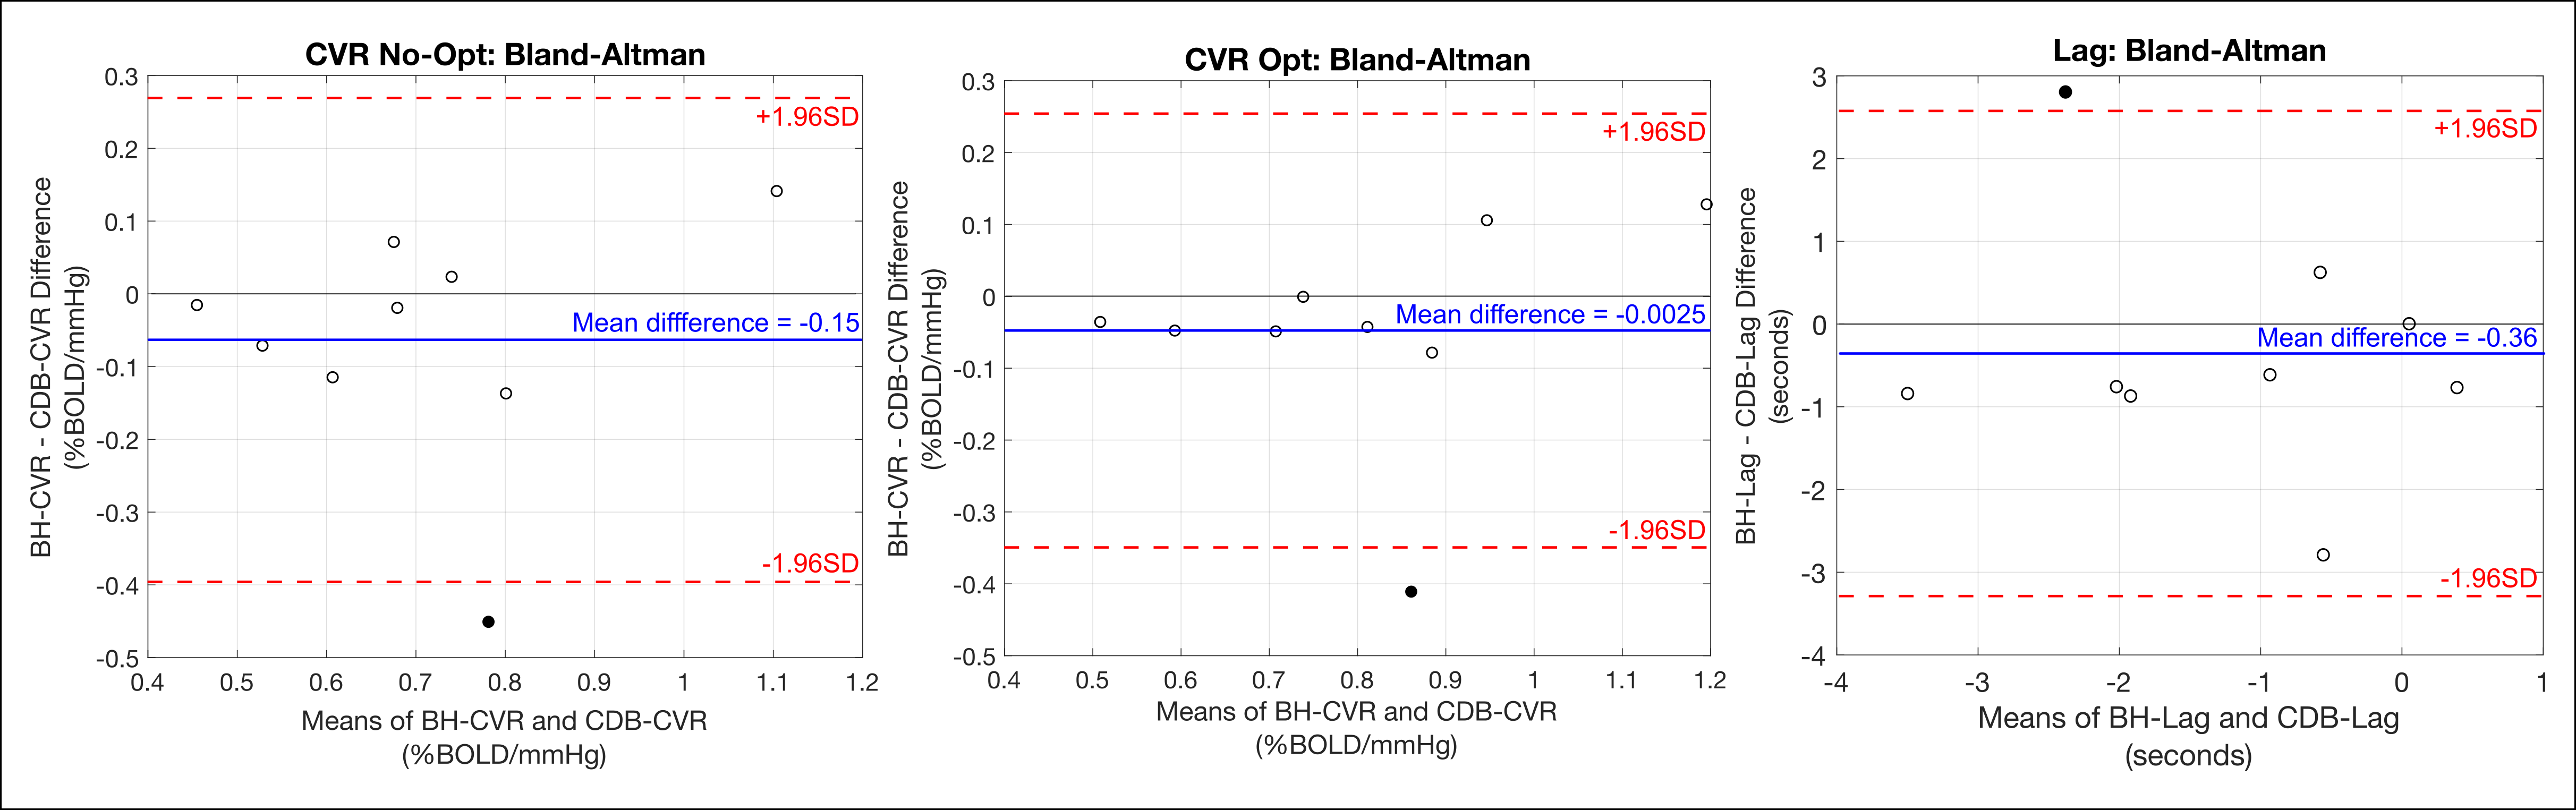
Bland-Altman plots for the agreement between average breath-hold (BH) and cued deep breathing (CDB) cerebrovascular reactivity (CVR) and lag. Averages were calculated for each subject, across voxels included in the spatial correlation analysis. Mean differences in non-optimized CVR (left), lag optimized CVR (middle), and lag (right) were not significantly different from 0 (p<0.05). Subjects (filled circles) outside the limits of agreement were removed from across-subject correlations.
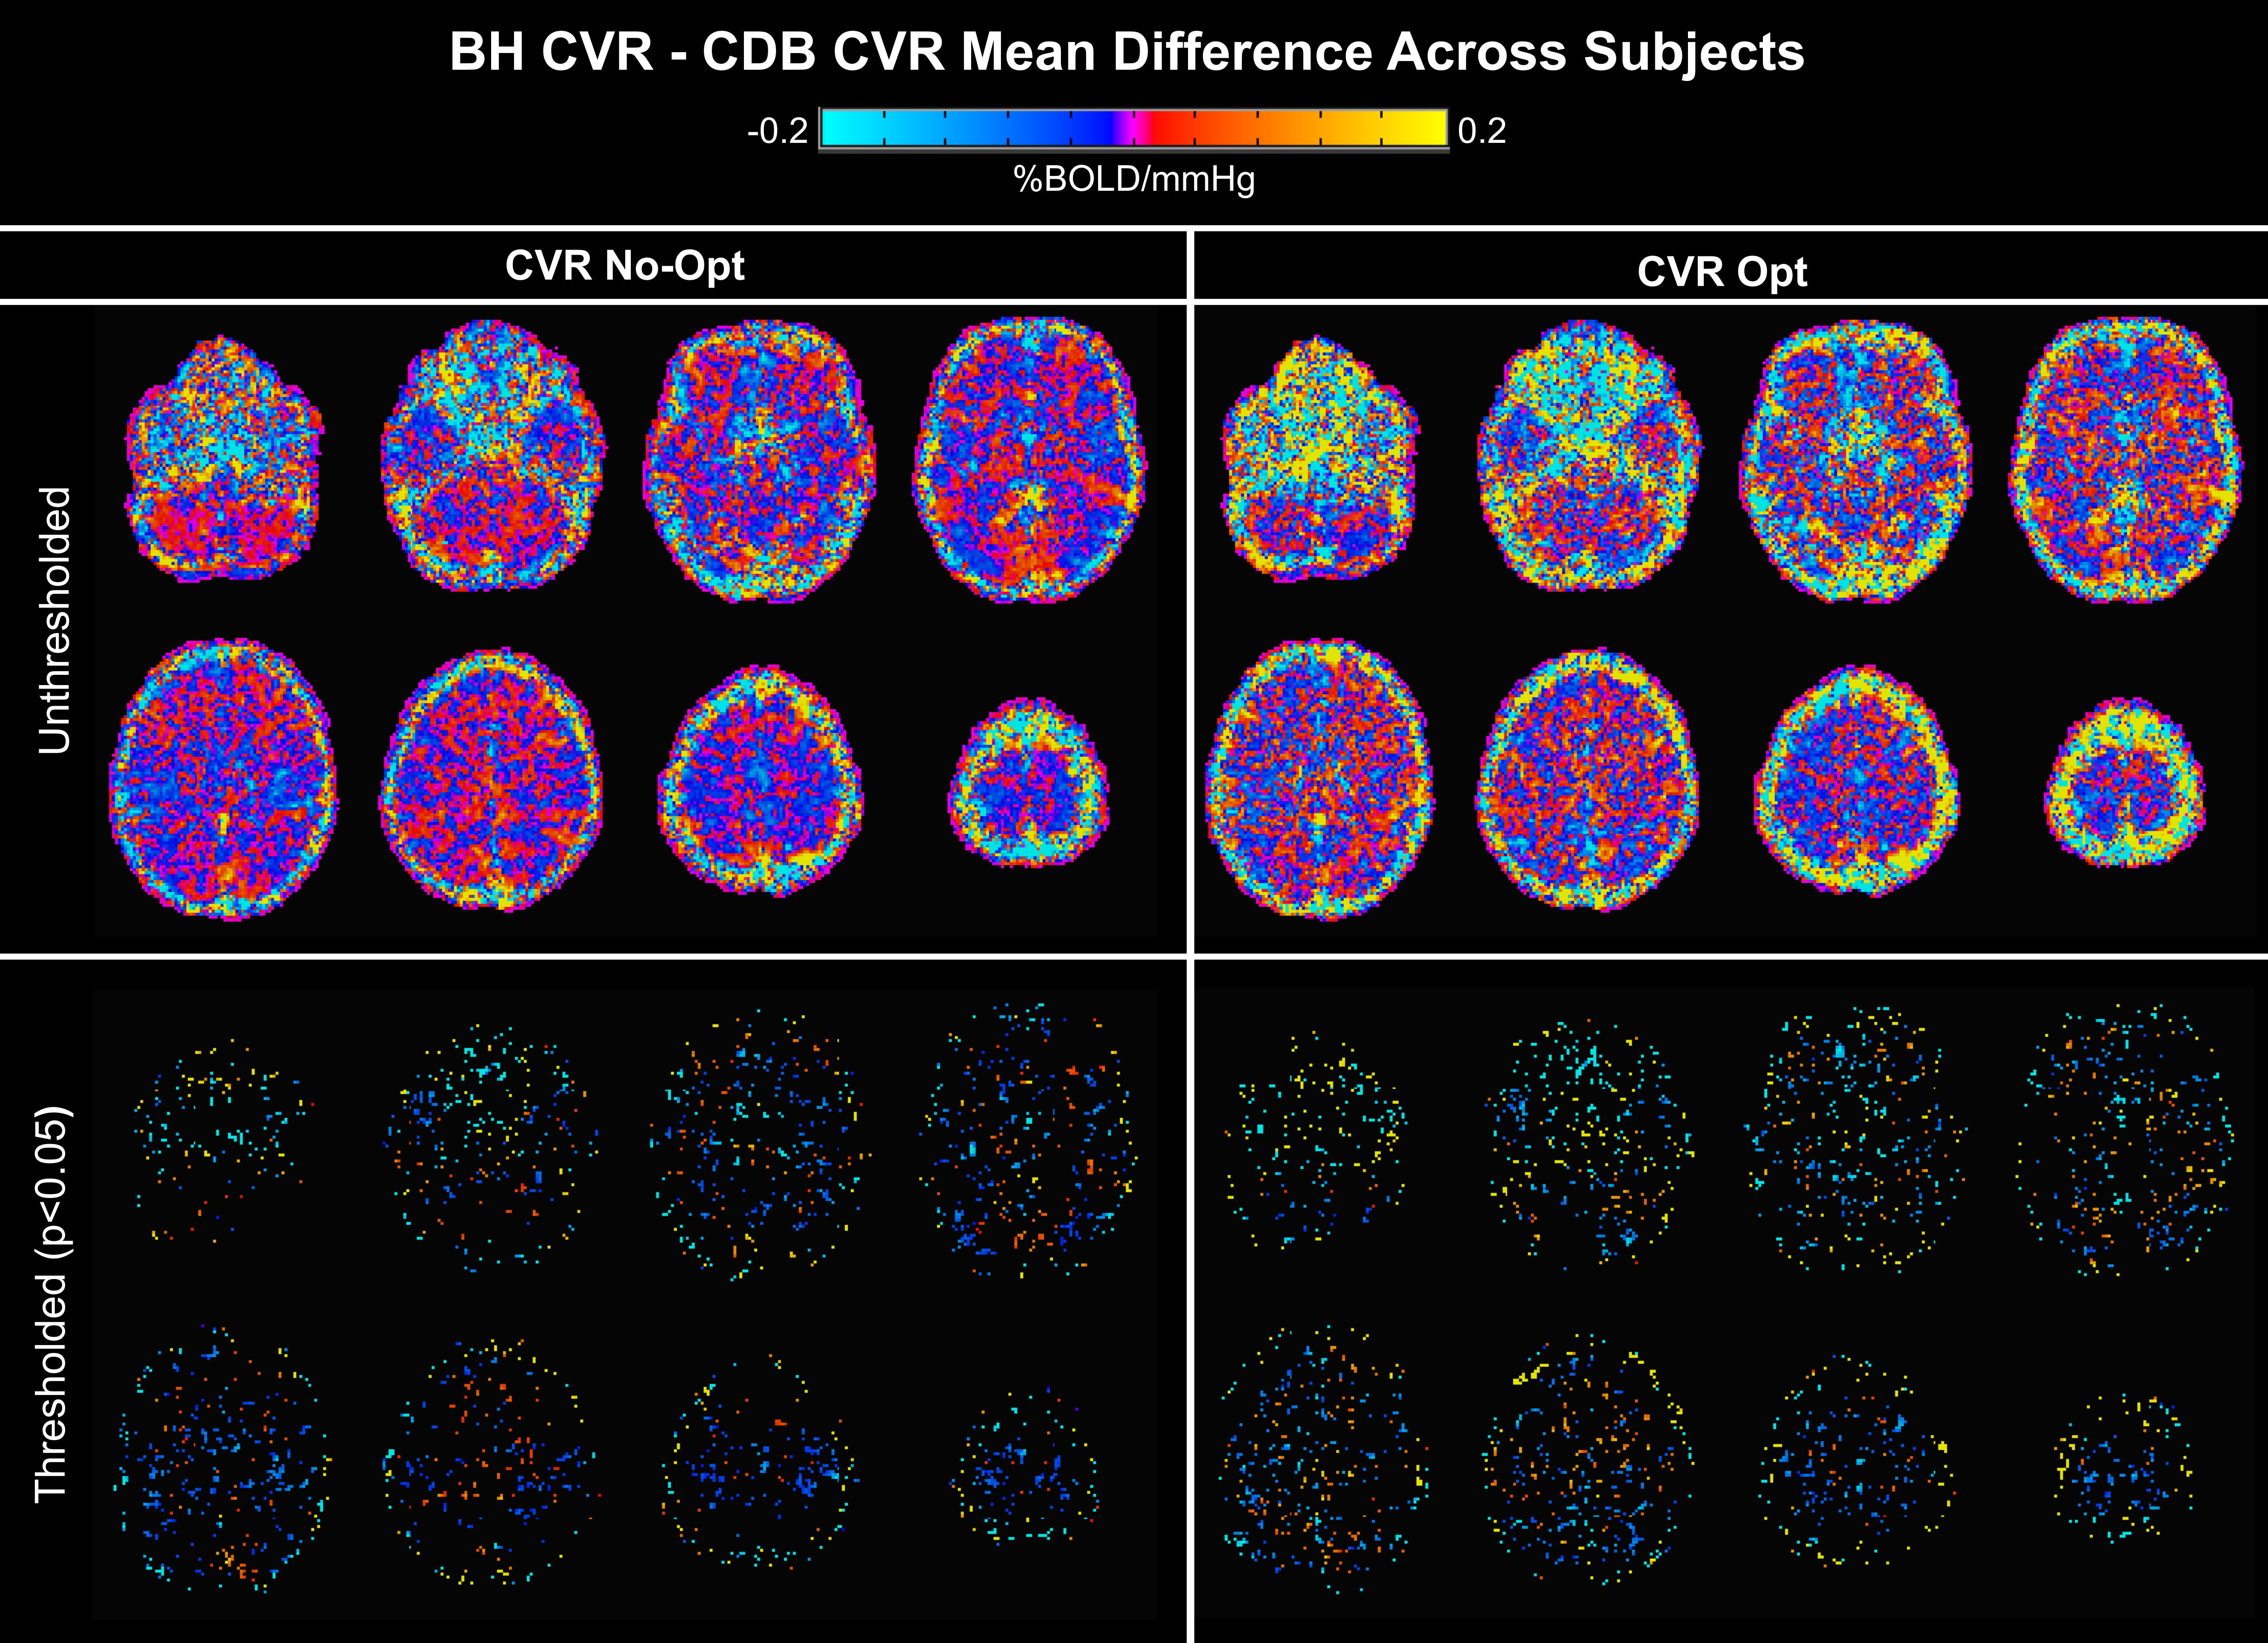
Voxelwise maps of the Bland-Altman analysis showing mean difference between breath-hold (BH) and cued deep breathing (CDB) cerebrovascular reactivity (CVR) across all subjects. Differences in non-optimized CVR (No-Opt) are shown on the left, lag-optimized on the right, with thresholded maps for each in the bottom row (p<0.05). Negative values represent voxels with greater BH CVR than CDB CVR, and vice versa. Significant differences appear primarily at brain edges and in white matter.
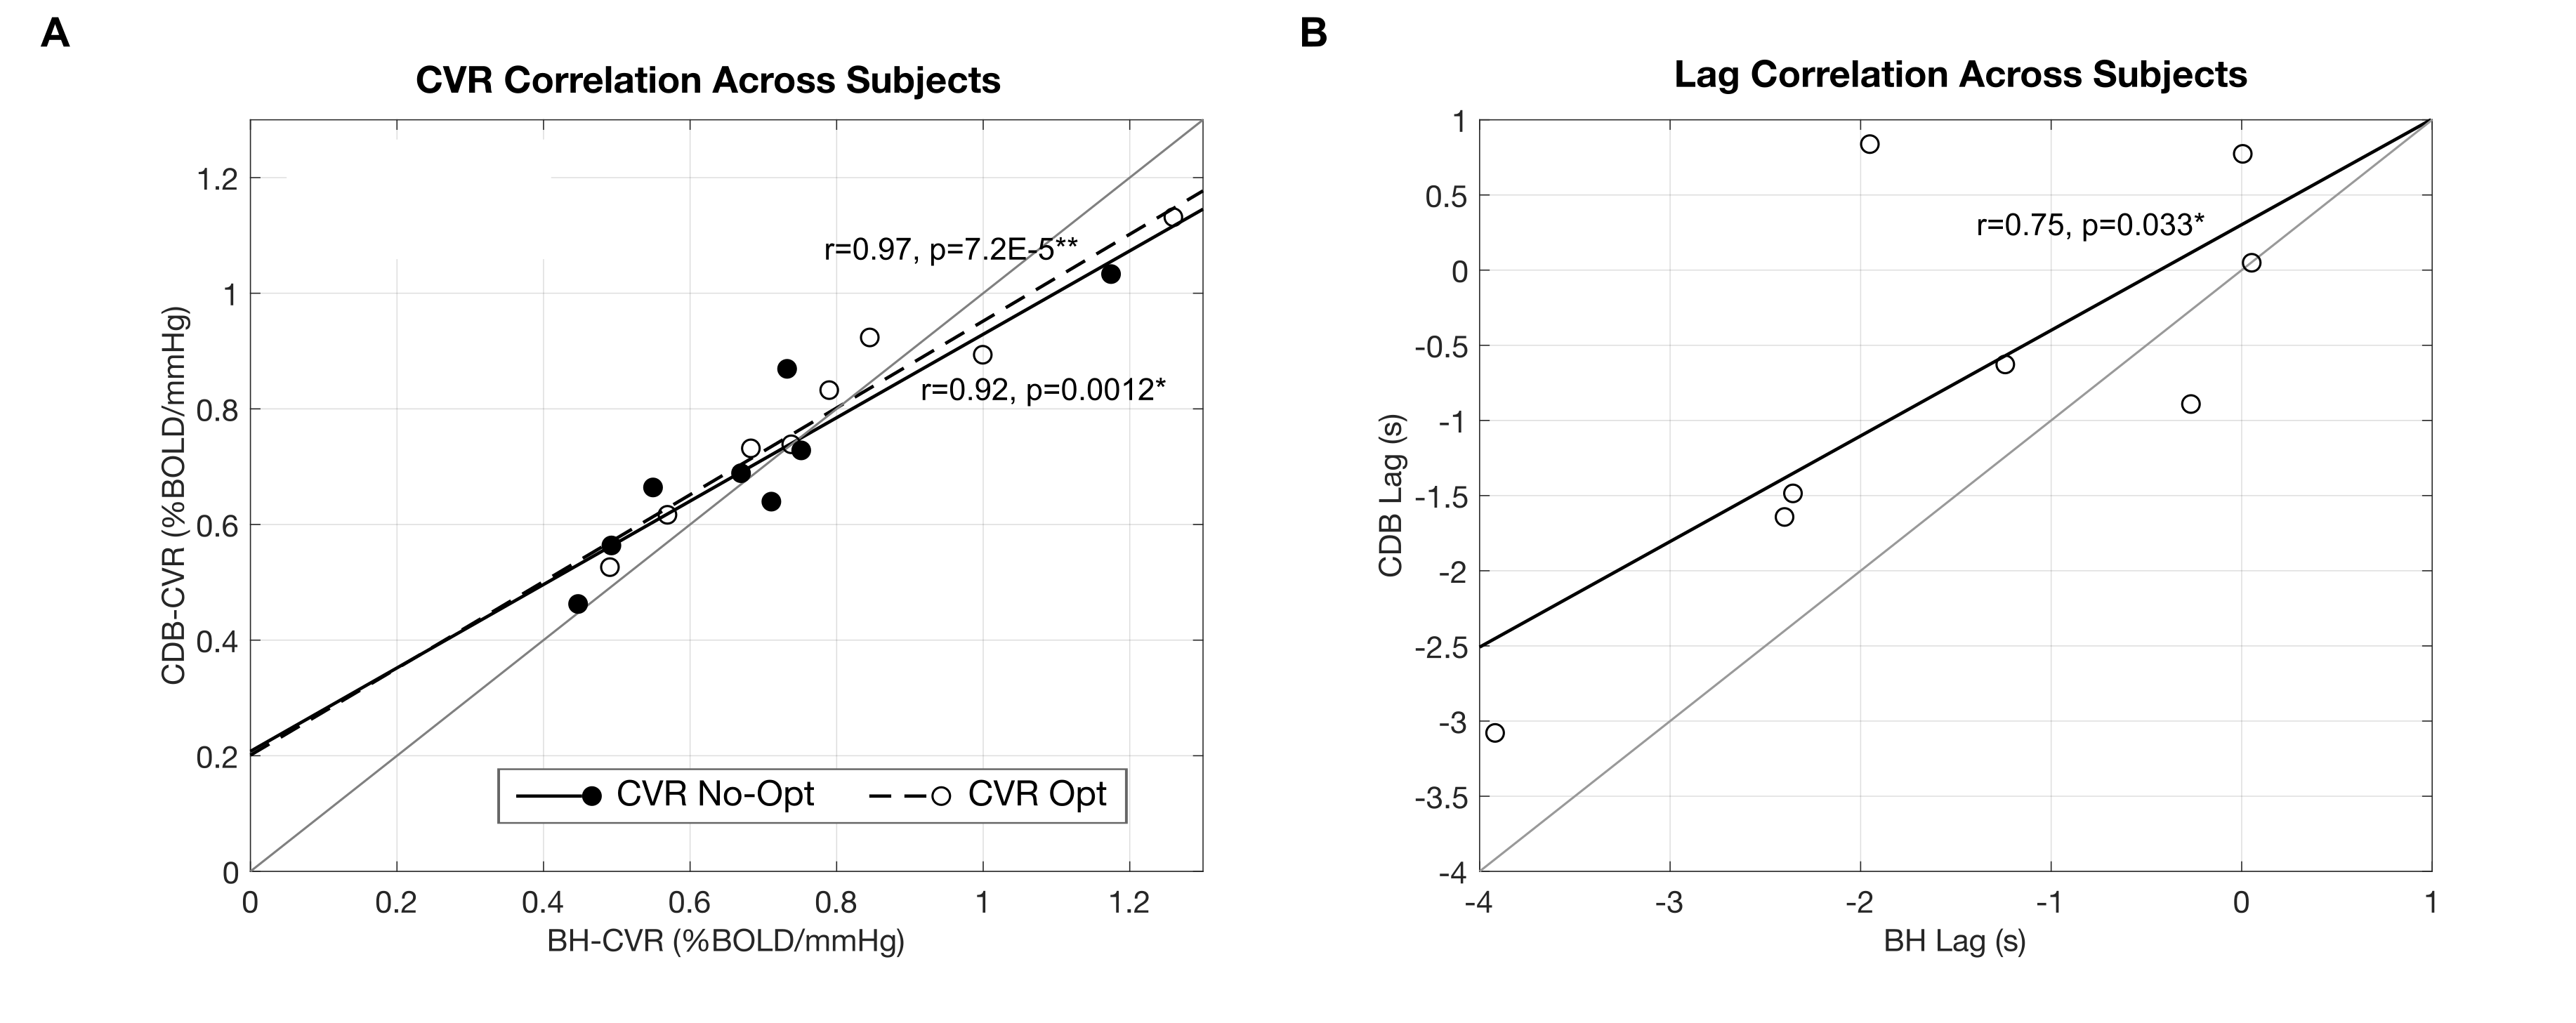
Relationship between average breath-hold (BH) and cued deep breathing (CDB) A) CVR, before and after lag optimization and B) lag, for each subject. Averages calculated from voxels included in the spatial correlation. Subjects identified as outliers in the Bland-Altman analysis were removed from respective across-subject correlations. Pearson correlation coefficients and associated p-values are indicated next to the best-fit lines (*p<0.05, **p<0.001). A unity line is also plotted for reference.