4329
Revisit on the cerebrovascular responses to end-tidal CO2 fluctuations during spontaneous breathing as a surrogate of regional cerebrovascular reactivity assessment under hypercapnic challenge1Athinoula A. Martinos Center for Biomedical Imaging, Department of Radiology, Massachusetts General Hospital, Charlestown, MA, United States, 2Biogen, Inc., Cambridge, MA, United States, 3Department of Biomedical Engineering, Hong Kong Polytechnic University, Kowloon, Hong Kong
Synopsis
Regional cerebraovascular reactivity (CVR) to endogenous carbon dioxide (CO2) during spontaneous breathing (i.e. end-tidal partial pressure of CO2 (PETCO2) measured at rest), was substantially different from that obtained under externally applied CO2 challenge. Individual maps of CVR to endogenous CO2 showed significant inter-subject variability while CVR maps under hypercapnic challenge did not. Such inter-subject variability was not reduced by correction of respiratory effects. In addition, the CVR to end-tidal partial pressure of oxygen (PETO2) during spontaneous breathing shows less inter-subject variability. Our findings question the compatibility of using CVR during spontaneous breathing as a surrogate of CVR under hypercapnic challenge.
Introduction
Externally administered carbon dioxide (CO2) has been commonly used as a vasoactive stimulus together with the cerebrovascular responses measured with BOLD signal changes using functional magnetic resonance imaging (fMRI) to assess the regional cerebrovascular reactivity (CVR) (1). However, such assessment procedures require a complicated set-up of gas administration facilities and proper breathing circuit. Recently, the cerebrovascular responses to endogenous CO2 which is defined as the end-tidal partial pressure of CO2 (PETCO2) measured during spontaneous breathing, has been proposed to be a surrogate of CVR assessment under hypercapnic challenge (2,3). Here, we investigated whether the cerebrovascular responses to endogenous CO2 are compatible with those under the effect of externally administered CO2. The responses to endogenous O2 during spontaneous breathing were also measured for comparison.Subjects and Methods
Participants: Eleven healthy volunteers aged 22- 48 years who were screened to exclude neurological disorders were included. Each of the subjects participated in the fMRI scans during spontaneous breathing and under external CO2 challenge. All MRI scanning was performed at the Athinoula A. Martinos Center for Biomedical Imaging at the Massachusetts General Hospital. The signed informed consent was obtained prior to participation in the study. All procedures were approved by the Institutional Review Board at MGH. Methods: MRI was performed on a 3-Tesla (Siemens Medical, Erlangen, Germany). Whole brain BOLD-fMRI datasets were acquired on each volunteer for 10 minutes (TR=1450ms, TE=30ms) when the subjects were 1) breathing spontaneously, and 2) under external CO2 challenge. During external CO2 challenge, subjects wore nose-clip and breathed through a mouth-piece on a MRI-compatible circuit designed to maintain the PETCO2 within ± 1-2 mmHg of target PETCO2. The external CO2 challenge paradigm consisted of 2 consecutive phases (normocapnia and mild hypercapnia) repeating 6 times with 3 epochs of 4 mmHg increase and 3 epochs of 8 mmHg increase of PETCO2 above the subject’s resting PETCO2. The normocapnia phase lasted 60-90 seconds, while the mild hypercapnia phase lasted 30 seconds. Physiological changes including respiration, plethysmography and the partial pressure of O2 (PO2) and CO2 (PCO2) were measured by respiratory bellow, pulse oximeter and calibrated gas analyzers simultaneously with MRI acquisition. Data analysis: BOLD-fMRI data were imported into the software AFNI (4). The pre-processing of BOLD-fMRI data included time-shift correction, motion correction, normalization and detrending. Technical delay of PCO2 and PO2 was corrected. Time series of PETCO2 and PETO2 were derived at end expiration. CVR values were derived by regressing BOLD signal changes (∆BOLD) on PETCO2 for the data acquired under external CO2 challenge and during spontaneous breathing. Regression of ∆BOLD on PETO2 during spontaneous breathing was also included. Regression coefficient beta (β) value was defined as ∆BOLD per unit change of the regressor (PETCO2). Individual subject brain volumes with b magnitudes were registered onto their own anatomical scans and transformed to the standardized space of Talairach and Tournoux (5). Monte Carlo simulation was used to correct for multiple comparisons (6). The BOLD-fMRI data acquired during spontaneous breathing were analyzed again using the same procedures above by incorporating RETROICOR (7) before pre-processing to remove the respiratory and cardiac phases.Results
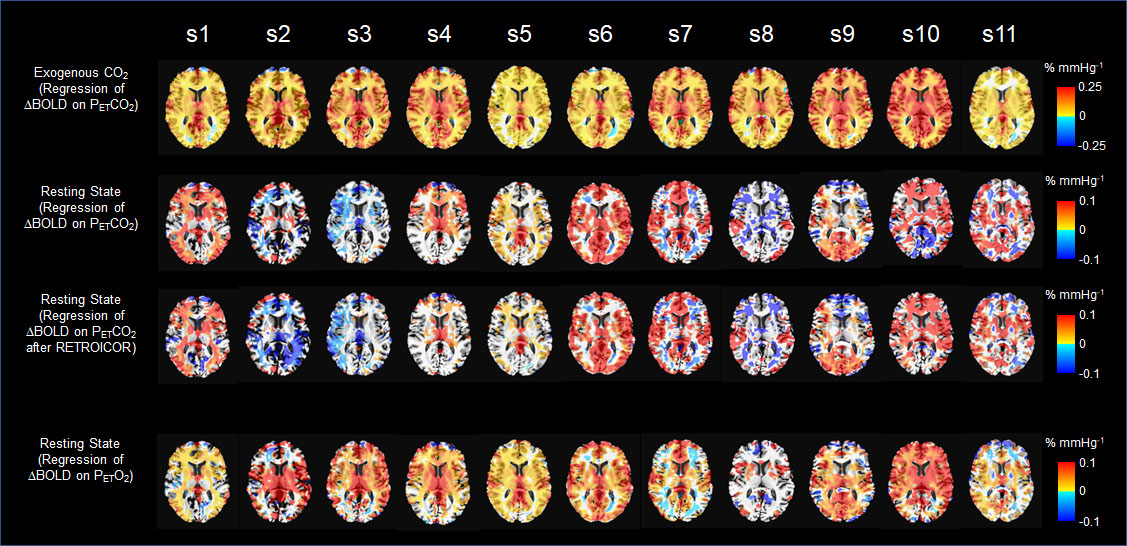
Under external CO2 challenge, most of the brain regions showed increased CVR throughout the gray and white matter symmetrically on both sides of the brain (Fig 1). For the same group of subjects during spontaneous breathing, we found that regional CVR in response to PETCO2 obtained from spontaneous breathing was substantially different from CVR in response to external CO2 challenge. The difference, demonstrated in individual CVR maps, was manifested in the significant inter-subject variability. CVR obtained from external CO2 challenge did not show any significant inter-subject variability. Such inter-subject variability was not reduced by individual correction of physiological motion effects using RETROICOR (7). Additionally, we found that for most individuals, CVR maps in response to PETO2 during spontaneous breathing showed significantly less inter-subject variability than CVR maps to PETCO2 of endogenous CO2.Discussion
The inter-subject variability of CVR to endogenous CO2 was not reduced by individual correction of physiological motion effects using a method like RETROICOR. Golestani et al (8) also showed that such inter-subject variability in CVR to endogenous CO2 persisted even after the application of the respiratory response function (RRF) (8-10) for BOLD data. Therefore, neither motion effects of respiration nor RRF have significant effect on inter-subject variability. Different from our work, Golestani et al (8) did not present CVR from external CO2 challenge from the same subjects for comparison. Since RRF is expected to be equally applied to O2 and CO2 to modulate their variations, our result of individual CVR maps showing different inter-subject variability for O2 and CO2 was a further indication that RRF could not be used to modulate inter-subject variability. The reduced inter-subject variability for individual CVR results of endogenous O2 is consistent with the group averaged result (11) of O2 variation being superior to CO2 variation in correlation with cerebral BOLD signal variation.Conclusion
There is a significant inter-subject variability in maps of CVR to endogenous CO2. The consequence is that PETCO2 obtained from external CO2 challenge and endogenous PETCO2 cannot be expected to generate the same kind of regional CVR maps.Acknowledgements
This research was carried out in whole at the Athinoula A. Martinos Center for Biomedical Imaging at the Massachusetts General Hospital, using resources provided by the Center for Functional Neuroimaging Technologies, P41EB015896, a P41 Biotechnology Resource Grant supported by the National Institute of Biomedical Imaging and Bioengineering (NIBIB), National Institutes of Health, as well as the Shared Instrumentation Grant S10RR023043. This study was also supported, in part, by National Center for Complementary and Integrative Health (NCCIH) grant (R21AT010955).References
1. Mikulis DJ, Krolczyk G, Desal H, Logan W, Deveber G, Dirks P, Tymianski M, Crawley A, Vesely A, Kassner A, Preiss D, Somogyi R, Fisher JA. Preoperative and postoperative mapping of cerebrovascular reactivity in moyamoya disease by using blood oxygen level-dependent magnetic resonance imaging. J Neurosurg 2005;103(2):347-355.
2. Golestani AM, Wei LL, Chen JJ. Quantitative mapping of cerebrovascular reactivity using resting-state BOLD fMRI: Validation in healthy adults. NeuroImage 2016;138:147-163.
3. Liu P, Li Y, Pinho M, Park DC, Welch BG, Lu H. Cerebrovascular reactivity mapping without gas challenges. NeuroImage 2017;146:320-326.
4. Cox RW. AFNI: software for analysis and visualization of functional magnetic resonance neuroimages. Comput Biomed Res 1996;29(3):162-173.
5. Talairach J, Tournoux P. Co-planar stereotaxic atlas of the human brain : 3-dimensional proportional system : an approach to cerebral imaging. Stuttgart ; New York: Georg Thieme; 1988.
6. Gold S, Christian B, Arndt S, Zeien G, Cizadlo T, Johnson DL, Flaum M, Andreasen NC. Functional MRI statistical software packages: a comparative analysis. Hum Brain Mapp 1998;6(2):73-84.
7. Glover GH, Li TQ, Ress D. Image-based method for retrospective correction of physiological motion effects in fMRI: RETROICOR. Magn Reson Med 2000;44(1):162-167.
8. Golestani AM, Chang C, Kwinta JB, Khatamian YB, Jean Chen J. Mapping the end-tidal CO2 response function in the resting-state BOLD fMRI signal: spatial specificity, test-retest reliability and effect of fMRI sampling rate. NeuroImage 2015;104:266-277.
9. Birn RM, Smith MA, Jones TB, Bandettini PA. The respiration response function: the temporal dynamics of fMRI signal fluctuations related to changes in respiration. NeuroImage 2008;40(2):644-654.
10. Chang C, Glover GH. Relationship between respiration, end-tidal CO2, and BOLD signals in resting-state fMRI. NeuroImage 2009;47(4):1381-1393.
11. Chan ST, Evans KC, Song TY, Selb J, van der Kouwe A, Rosen BR, Zheng YP, Ahn AC, Kwong KK. Dynamic brain-body coupling of breath-by-breath O2-CO2 exchange ratio with resting state cerebral hemodynamic fluctuations. PLoS One 2020;15(9):e0238946.
Figures