4327
A Local Linear Regression Algorithm for Partial Volume Correction in Brain Oxygen Extraction Fraction Estimation1Neurology, Washington University School of Medicine, St. Louis, MO, United States, 2Biomedical Engineering, Washington University in St. Louis, St. Louis, MO, United States, 3Pediatrics Hematology, Washington University School of Medicine, St. Louis, MO, United States, 4Washington University School of Medicine, St. Louis, MO, United States
Synopsis
Measurement of oxygen extraction fraction (OEF) provides important information about tissue oxygen utilization. OEF maps can be obtained using a double echo asymmetric spin echo (ASE) sequence. Partial volume effect may lead to inaccurate OEF measurements in regions with mixed tissue types. We introduced a local linear regression algorithm to correct for partial volume effect. The PVC OEF method reduced model fitting errors and signal contamination of CSF, and it improved the association between OEF and WMH lesion burden.
Introduction
Abnormal oxygen metabolism has been found in various neurological diseases such as ischemic stroke, sickle cell disease, and cerebral small vessel disease (CSVD). We developed a double echo asymmetric spin echo (ASE) sequence to measure oxygen extraction fraction (OEF) using deoxyhemoglobin as an endogenous paramagnetic contrast (1). We have found that OEF was elevated in white matter and low-flow watershed regions in patients with CSVD (2). The elevated OEF is associated with white matter hyperintensity lesion burden. The ASE OEF sequence usually has a low spatial resolution. Gray matter (GM), white matter (WM), and cerebrospinal fluid (CSF) have distinct ASE signal evolutions. The brain regions neighboring different tissue interfaces are subjected to large partial volume effects. For instance, voxels in the cortical regions and periventricular white matter may contain a substantial portion of CSF beside the brain tissue, and the mixture of tissue signal with that of CSF will lead to inaccurate OEF estimation.Methods
MR images were acquired from 29 CSVD patients (median age [IQR]: 70 [64 76.5], 10 female). T1 MPRAGE (1x1x1 mm3) and FLAIR (0.86x0.86x3 mm3) images were acquired with IRB approval and written consent. A double echo ASE sequence (1.72x1.72x3 mm3 resolution) was acquired for OEF measurement (1). White matter hyper-intensity (WMH) lesions were manually segmented by a board-certified vascular neurologist on FLAIR images to measure lesion volumes (VWMH).Asllani et al. proposed a partial volume correction (PVC) method for arterial spin labeling imaging (3). We further developed this method for OEF PVC. T1 images were segmented into GM, WM, and CSF probability maps using SPM. To estimate the partial volume effect, we first increased the ASE image size by Nx, Ny, and Nz times in the x, y, and z dimensions with Nx, Ny, and Nz as the ceiling integers of the voxel size (Nx=2, Ny=2, and Nz=3) resulting in the super-resolution ASE images with a similar resolution to T1 MPRAGE. The T1 MPRAGE was registered to this super-resolution ASE using ANTS to align the CSF/GM/WM probability maps towards the super-resolution ASE. Afterward, each block of Nx*Ny*Nz voxels in the super-resolution ASE was averaged into one voxel to estimate the CSF/GM/WM probability maps in the original ASE voxel. It is worth mentioning that in the previous work by Asllani et al, the tissue volume fractions were estimated using a direct registration of down-sampled T1 to the low-resolution pCASL images. The tissue composition within a voxel in the low-resolution pCASL was determined by its central location on the registered low-resolution T1, which may be a less accurate estimation. WMH lesions are often observed in the FLAIR images of patients with cerebrovascular disease. Some WMH lesions may appear hypointense in T1 weighted images, leading to misclassification of WMH lesions as GM or CSF with inaccurate tissue probability maps. In this study, we used the WMH segmentation to correct for this misclassification by assigning these regions as white matter.
After deriving the local tissue probability maps, we fitted the ASE signal within a local neighborhood (such as a 5x5x3 window) through linear regression to estimate the signal contribution from different tissues to the center voxel. Assuming that signal from the same tissue type within a small neighborhood is constant, the ASE signal in each voxel is a linear combination of the signals from GM, WM and CSF by their probabilities (S = Scsf*Probcsf + Sgm*Probgm + Swm*Probwm and Probcsf+Probgm+Probwm=1). Scsf, Sgm and Swm were obtained by solving 5*5*3 linear equations within a neighborhood of 5x5x3 voxels. GM and WM OEF were then computed using the partial volume corrected signals Sgm and Swm, respectively. A combined OEF map was generated as the weighted sum of the GM and WM OEF with their volume fractions as the weights (after removing CSF).
Results
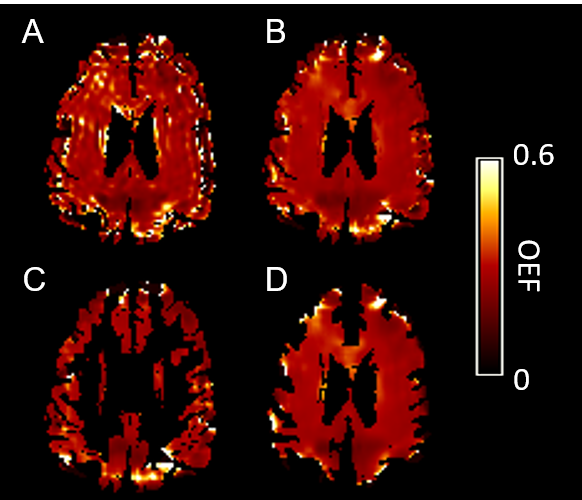
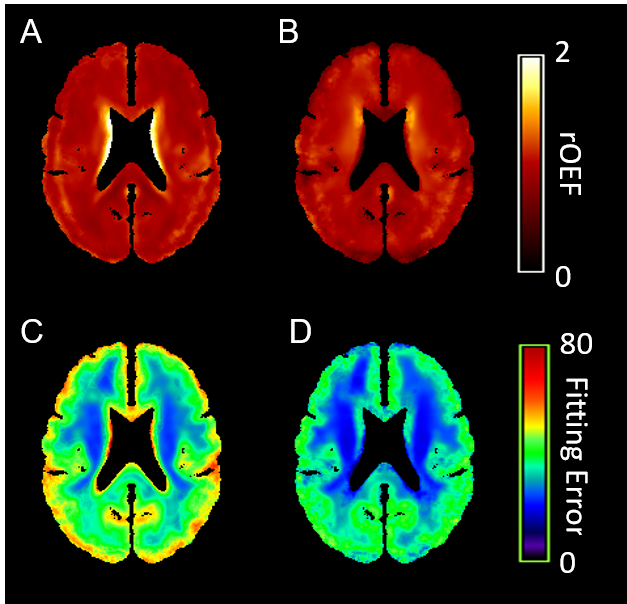
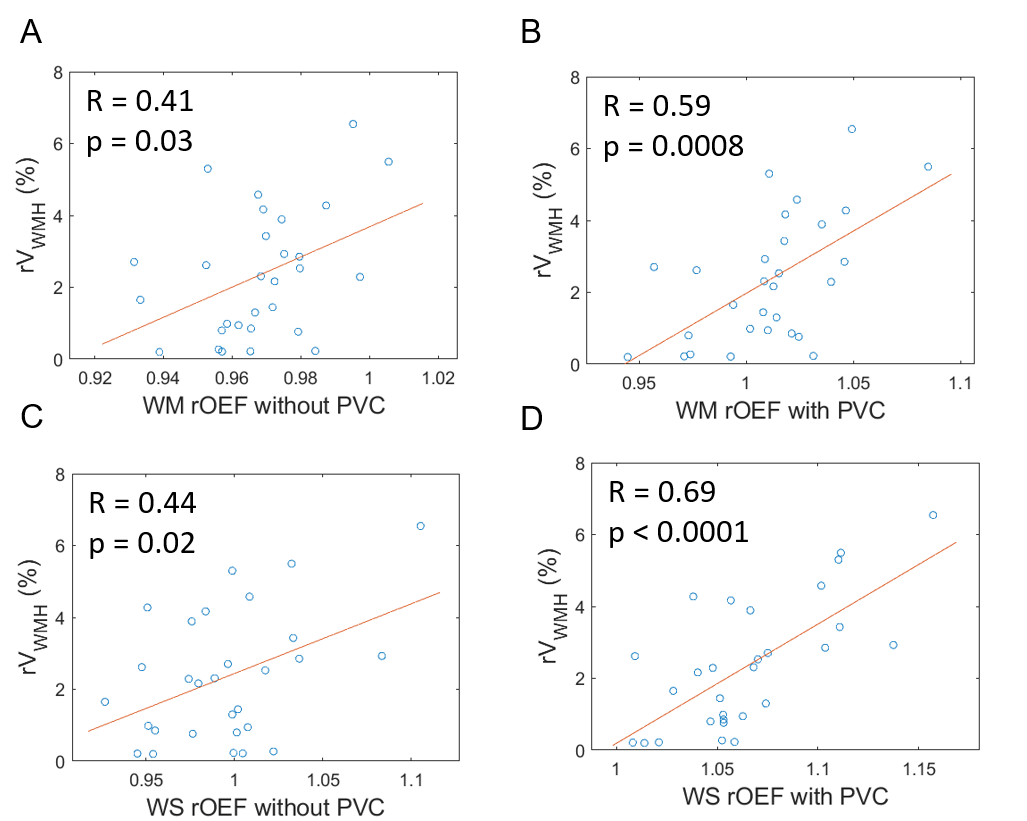
One example OEF map without (Figure 1A) and with PVC (Figure 1B), OEF in GM (Figure 1C) and WM (Figure 1D) were demonstrated in Figure 1. The group average rOEF (normalized by the whole-brain average) and fitting error were given in Figure 2. The elevated OEF along the lateral edge of the ventricle (Figure 2A) was due to CSF contamination and it was reduced after PVC. ASE signal fitting errors were also reduced after PVC. Moreover, PVC also improved the association between rOEF and rVWMH (relative WMH volume normalized by brain volume) in both WM and watershed regions in CSVD patients (Figure 3).Conclusion and Discussion
In summary, we have developed an algorithm to correct for partial volume effect in OEF calculation, which is critical to regional OEF quantification because the partial volume effect varies from region to region. To the best of our knowledge, this work may be the first effort towards this direction. The effectiveness of the proposed PVC approach is especially apparent in reducing the over-all ASE signal fitting error and removal of the CSF contamination in OEF calculation. In addition, this local linear regression is also able to smooth the OEF maps according to the tissue composition without introducing further mixture between different tissues caused by some naïve smoothing techniques not preserving tissue boundaries such as Gaussian smoothing.Acknowledgements
This study was supported by NIH 1R01NS082561, 1RF1NS116565, and 2R01HL129241.References
1. An H, Lin W. Impact of intravascular signal on quantitative measures of cerebral oxygen extraction and blood volume under normo and hypercapnic conditions using an asymmetric spin echo approach. Magnetic Resonance in Medicine 50(4):708-716 (2003).
2. Ying C, Ford AL, Kang P, Al-Habib A, Fellah S, Chen Y, Lee J-M, An H. Elevated oxygen extraction fraction is a tissue biomarker of chronic ischemia for cerebral small vessel disease ISMRM 2019; Montreal, Canada.
3. Asllani I, Borogovac A, Brown T. Regression algorithm correcting for partial volume effects in arterial spin labeling MRI. Magnetic Resonance in Medicine 60, 1362–1371 (2008).
Figures