4325
A Flexible Computational Framework for Characterization of Dynamic Cerebrovascular Response to Global Hemodynamic Stimuli1Radiology, New York University Langone Health, New York, NY, United States, 2Weill Cornell, New York, NY, United States, 3New York University Langone Health, New York, NY, United States, 4Emory University, Atlanta, GA, United States
Synopsis
Cerebrovascular reactivity (CVR) is conventionally assessed by comparing discrete cerebral blood flow measurements obtained prior to and following a hemodynamic stimulus. Blood-oxygen-level-dependent (BOLD)-MRI provides potentially continuous, dynamic CVR characterization when coupled to stimuli such as acetazolamide (ACZ), but poor signal-to-noise generally limits its analysis to an analogous comparison of arbitrarily defined terminal BOLD signals relative to baseline. We present a novel framework incorporating temporal and spatial denoising to pre-condition the dynamic time-signal course for robust voxel-level maximal and terminal CVR, and novel CVR time-to-peak and related kinetic features, disambiguating confounders related to potentially non-optimal terminal CVR assignment in conventional use.
Introduction
Cerebrovascular reactivity (CVR) underlies adaptive autoregulation of the cerebral circulation to falling perfusion pressures, mediated through dilatation of resistance vessels augmenting blood volume to preserve cerebral blood flow.1 CVR exhaustion portends elevated stroke risks in chronic steno-occlusive disease.2,3CVR historically is assessed through paired blood flow measurements preceding and following hemodynamic stimuli such as acetazolamide (ACZ).1,4 Low SNR conditions generally relegate the technique to characterization of terminal (CVRend) responses relative to a pre-ACZ baseline, requiring arbitrary assignment of a single post-ACZ timepoint from which to assess CVR across potentially hemodynamically/pathologically variegated territories,5 and the presumption of a strictly monotonically increasing hemodynamic response.
We test a robust, flexible computational framework to pre-condition BOLD time-signal courses for dynamic analysis, including frame-by-frame, voxel-specific CVR maxima (CVRmax), time-to-maxima, and related kinetic analysis, as well as preliminary development of CVR signatures previously unattainable from the stimulus response. We hypothesize hidden CVRmax can be extracted to uncover unique attributes of tissues under hemodynamic stress.
Methods
22 patients with unilateral chronic steno-occlusive disease (mean age 52.5±12.5 years, 10 females) underwent 31 ACZ-challenge MRI examinations.Subjects were scanned in a 3T whole-body system (Siemens Prisma, Siemens Healthineers, Erlangen, Germany) with a 64-channel head coil to include: i.1mm isotropic T1-weighted MPRAGE; ii.~20-minute BOLD imaging performed with a gradient-echo EPI sequence (TR=2.15-2.37 seconds, voxel size=2x2x5mm3, whole-brain coverage); iii.Gradient echo magnitude and phase field maps to correct spatial distortion. 1-gram ACZ in 10 mL normal saline was infused over 3-5 minutes, following 4-5 minutes baseline scanning, without interruption of BOLD imaging.
For each individual subject, the T1-MPRAGE was reconstructed using Freesurfer for automatic segmentation of the cortical gray matter, white matter, subcortical gray matter and cerebellum.6 Thermal noise in BOLD images was suppressed with a custom PCA-based denoising strategy differentiating between signal and noise in the eigenspectrum using universal properties of the Random Matrix Theory, thereby eliminating user dependency.7 Denoised BOLD images and field maps were processed in FSL Melodic for motion correction, unwarping, slice timing correction, and spatial smoothing.8 0.01Hz temporal low-pass filtering was applied to pre-processed BOLD without detrending. The first and last 30 frames were discarded.
Conventional CVRend maps were produced from the first and last one-minute BOLD data and averaged respectively as BOLDpre and BOLDpost. CVR was calculated as %CVR=100*(BOLDpost–BOLDpre)/BOLDpre. A linear boundary-based coregistration was used to align CVR maps with Freesurfer-processed T1-MPRAGE.9 CVR values in pre-assigned areas were compared using paired t-tests.
Results
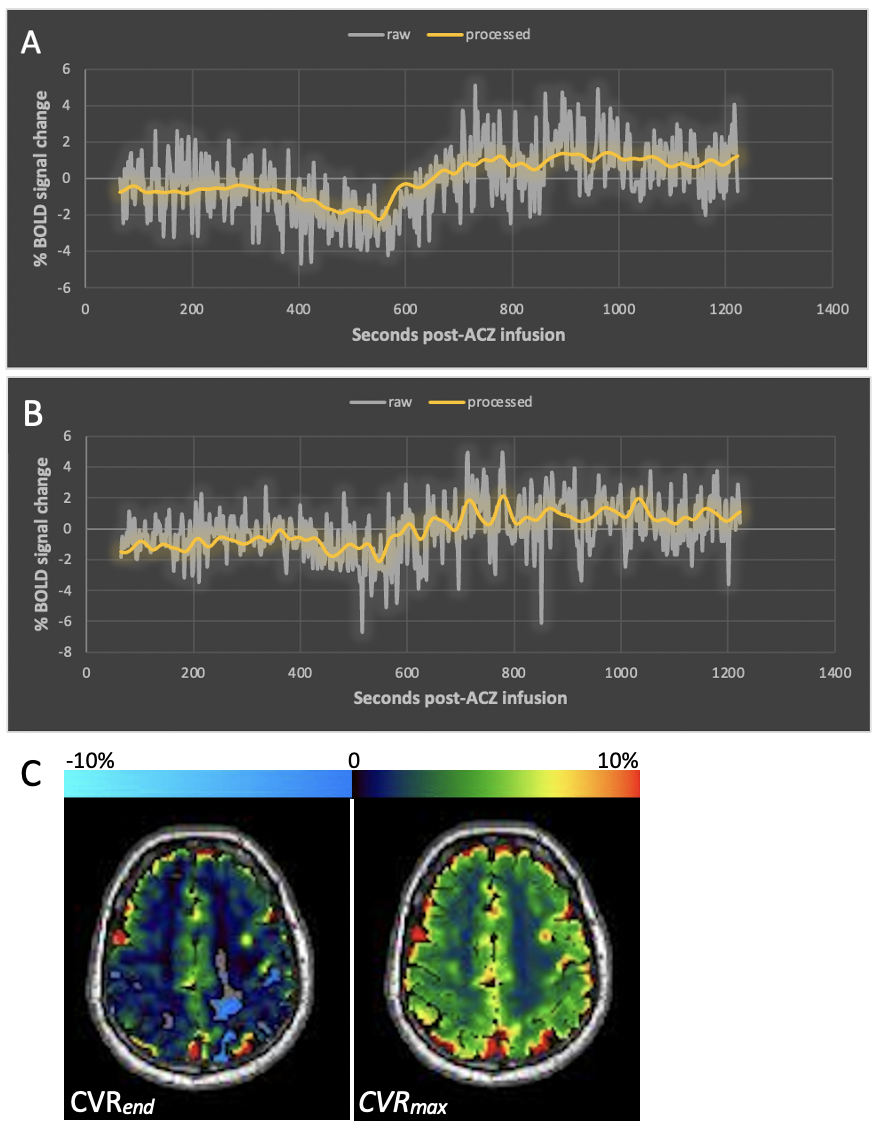
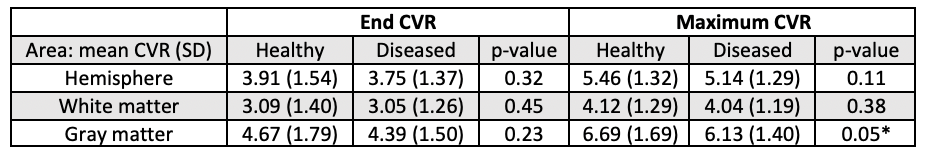
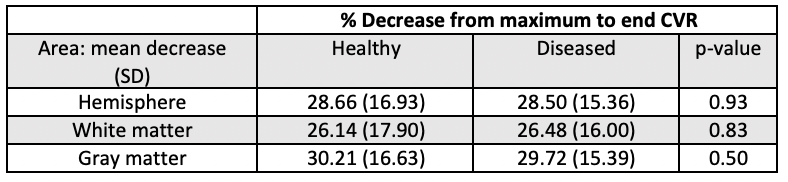
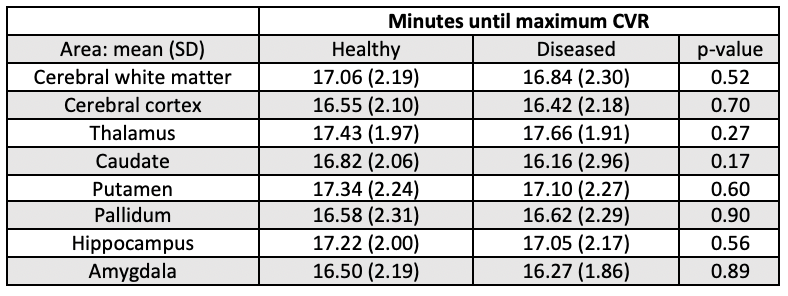
Figure 1 demonstrates native BOLD time-signal course superimposed upon post-processed raw data using the proposed algorithm as well as representative CVRend and CVRmax maps. Improved signal characteristics condition processed data for sliding window CVRmax analysis, unattainable from native or model fit native (not shown) BOLD.Post-processed data was used to calculate total hemispheric, hemispheric gray matter, and hemispheric white matter CVRmax and CVRend in the healthy and diseased hemispheres (Table 1). Both CVR measures trended higher in healthy tissue in all comparisons although inconsistently reaching statistical significance, likely reflecting anatomic heterogeneity of diseased vascular territories across subjects relative to predefined regions-of-interest.
Percentage decrease between CVRmax and CVRend was calculated and averaged across all exams (Table 2), exhibiting similar decrements in healthy and diseased tissues.
Time to CVRmax (i.e., CVR time-to-maximum) is reported in Table 3, generally trending shorter in diseased tissue though not significantly, reflecting potential for an earlier time-to-maximum of strong, sustained CVR in healthy tissues, as well as early time-to-maximum in diseased tissues exhibiting weak and either sustained or gradually declining CVR following an initial peak.
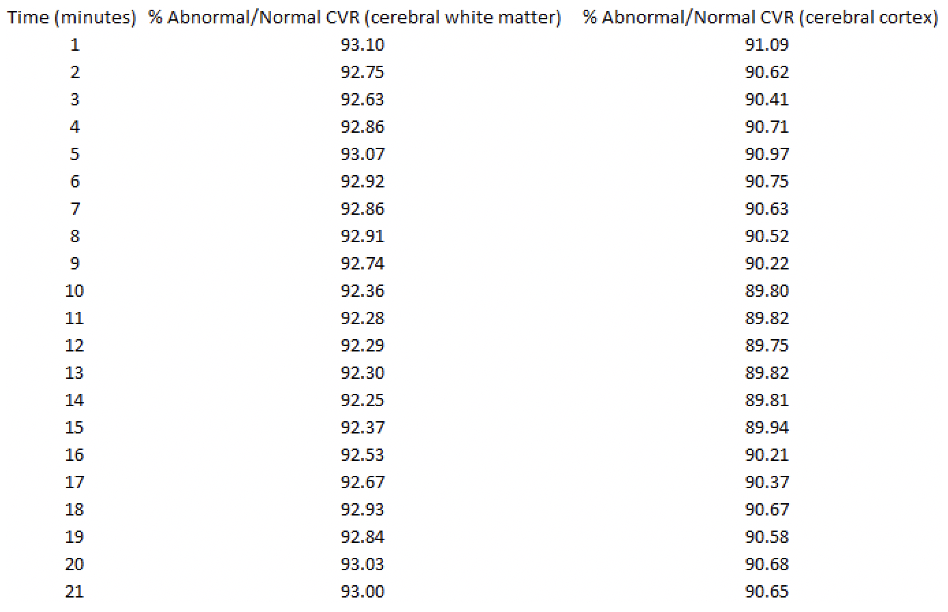
Figure 2 demonstrates a patient with right supraclinoid internal carotid artery stenosis also affecting M1 and A1 segments. Diseased hemisphere cerebral white matter and cortical CVR are expressed as percentages of corresponding structures in the contralateral, normal hemisphere at various timepoints post-ACZ. Minimum ratios occurred in the 11-14-minute range in both areas.
Discussion
We report development of a custom computational pipeline for enhanced time-signal analysis of BOLD response to a global hemodynamic stimulus. We confirm that arbitrarily selected CVRend measurements may fail to capture voxel-level CVR maxima in the presence of fluctuating or non-monotonic BOLD-ACZ responses, as may occur under influence of varying perfusion pressures, resistance, and pharmacologic stimulus delivery.We observed a trend toward higher healthy tissue CVRmax. Healthy and diseased hemispheres exhibited similar drops from maximal to terminal CVR. Diseased tissue generally, but not significantly, reached maximum CVR earlier, possibly reflecting earlier exhaustion of CVR which may be sustained or decline beyond an early time-to-maximum. Further analysis of diseased tissue CVRmax and formal CVR signature classification may inform new paradigms relating BOLD-CVR to hemodynamic stress and stroke risk. Healthy and diseased tissue CVR differed most between 11-14 minutes, consistent with peak cerebral blood flow response between 10-15 minutes.4,5
We did not find consistently significant differences between healthy and diseased hemispheres, even in CVRend as has been reported, which may reflect relatively mild disease in our patients; however, the distribution of diseased vessels and involved vascular territories relative to the regions-of-interest, together with the small study population, may conceal significant territorial differences.
Conclusion
An optimized computational pipeline for dynamic BOLD-CVR analysis allows for disambiguation of CVRmax and other potential biomarkers of hemodynamic stress following a global vascular stimulus.Acknowledgements
No acknowledgement found.References
1. Liu, P., De Vis, J. B. & Lu, H. Cerebrovascular reactivity (CVR) MRI with CO2 challenge: A technical review. Neuroimage 187, 104–115 (2019).
2. Reinhard, M. et al. Cerebrovascular reactivity predicts stroke in high-grade carotid artery disease. Neurology 83, 1424–1431 (2014).
3. Gupta, A. et al. Cerebrovascular reserve and stroke risk in patients with carotid stenosis or occlusion: a systematic review and meta-analysis. Stroke 43, 2884–2891 (2012).
4. Vagal, A. S., Leach, J. L., Fernandez-Ulloa, M. & Zuccarello, M. The acetazolamide challenge: techniques and applications in the evaluation of chronic cerebral ischemia. AJNR. Am. J. Neuroradiol. 30, 876–884 (2009).
5. Wu, J., Dehkharghani, S., Nahab, F. & Qiu, D. Acetazolamide-augmented dynamic BOLD (aczBOLD) imaging for assessing cerebrovascular reactivity in chronic steno-occlusive disease of the anterior circulation: An initial experience. NeuroImage. Clin. 13, 116–122 (2017).
6. Dale, A. M., Fischl, B. & Sereno, M. I. Cortical surface-based analysis. I. Segmentation and surface reconstruction. Neuroimage 9, 179–194 (1999).
7. Veraart, J., Fieremans, E. & Novikov, D. S. Diffusion MRI noise mapping using random matrix theory. Magn. Reson. Med. 76, 1582–1593 (2016).
8. Beckmann, C. F. & Smith, S. M. Probabilistic independent component analysis for functional magnetic resonance imaging. IEEE Trans. Med. Imaging 23, 137–152 (2004).
9. Greve, D. N. & Fischl, B. Accurate and robust brain image alignment using boundary-based registration. Neuroimage 48, 63–72 (2009).
Figures