4324
A Shearlet-based whole brain vein segmentation algorithm and its application for the detection of regional differences in venous oxygenation1Division of Medical Physics in Radiology, German Cancer Research Center (DKFZ), Heidelberg, Germany, 2Faculty of Physics and Astronomy, University of Heidelberg, Heidelberg, Germany, 3Division of Radiology, German Cancer Research Center (DKFZ), Heidelberg, Germany, 44Department of Neuroradiology, University of Heidelberg, Heidelberg, Germany
Synopsis
Generating whole-brain vein segmentations can be very time-consuming. In this abstract, a method is proposed that can segment brain veins from a single-echo or multi-echo gradient echo scan. The segmentation algorithm combines classical vessel enhancement filtering and local thresholding methods with a shearlet-based multi-scale approach. Compared with a ground truth, the algorithm performs better for multi-echo data when R2* information is included in the segmentation. Moreover, the combination of venous segmentation with masks for deep and superficial venous territories yields higher susceptibility values for the superficial venous vasculature which is in accordance with a higher oxygen consumption of the cortex.
Introduction
Cerebral venous oxygenation is related to cerebral oxygen extraction and an important biomarker for neurological diseases1-5. Applications such as the generation of oxygen extraction fraction maps6 rely on an accurate regional quantification of venous oxygenation requiring an accurate segmentation of brain veins. Here, an automated whole brain vein segmentation algorithm based on single or multi-echo gradient echo data and combining classical vessel enhancement filtering and local thresholding methods with a shearlet-based multi-scale approach is proposed to avoid time-consuming manual segmentation.Theory: The proposed algorithm
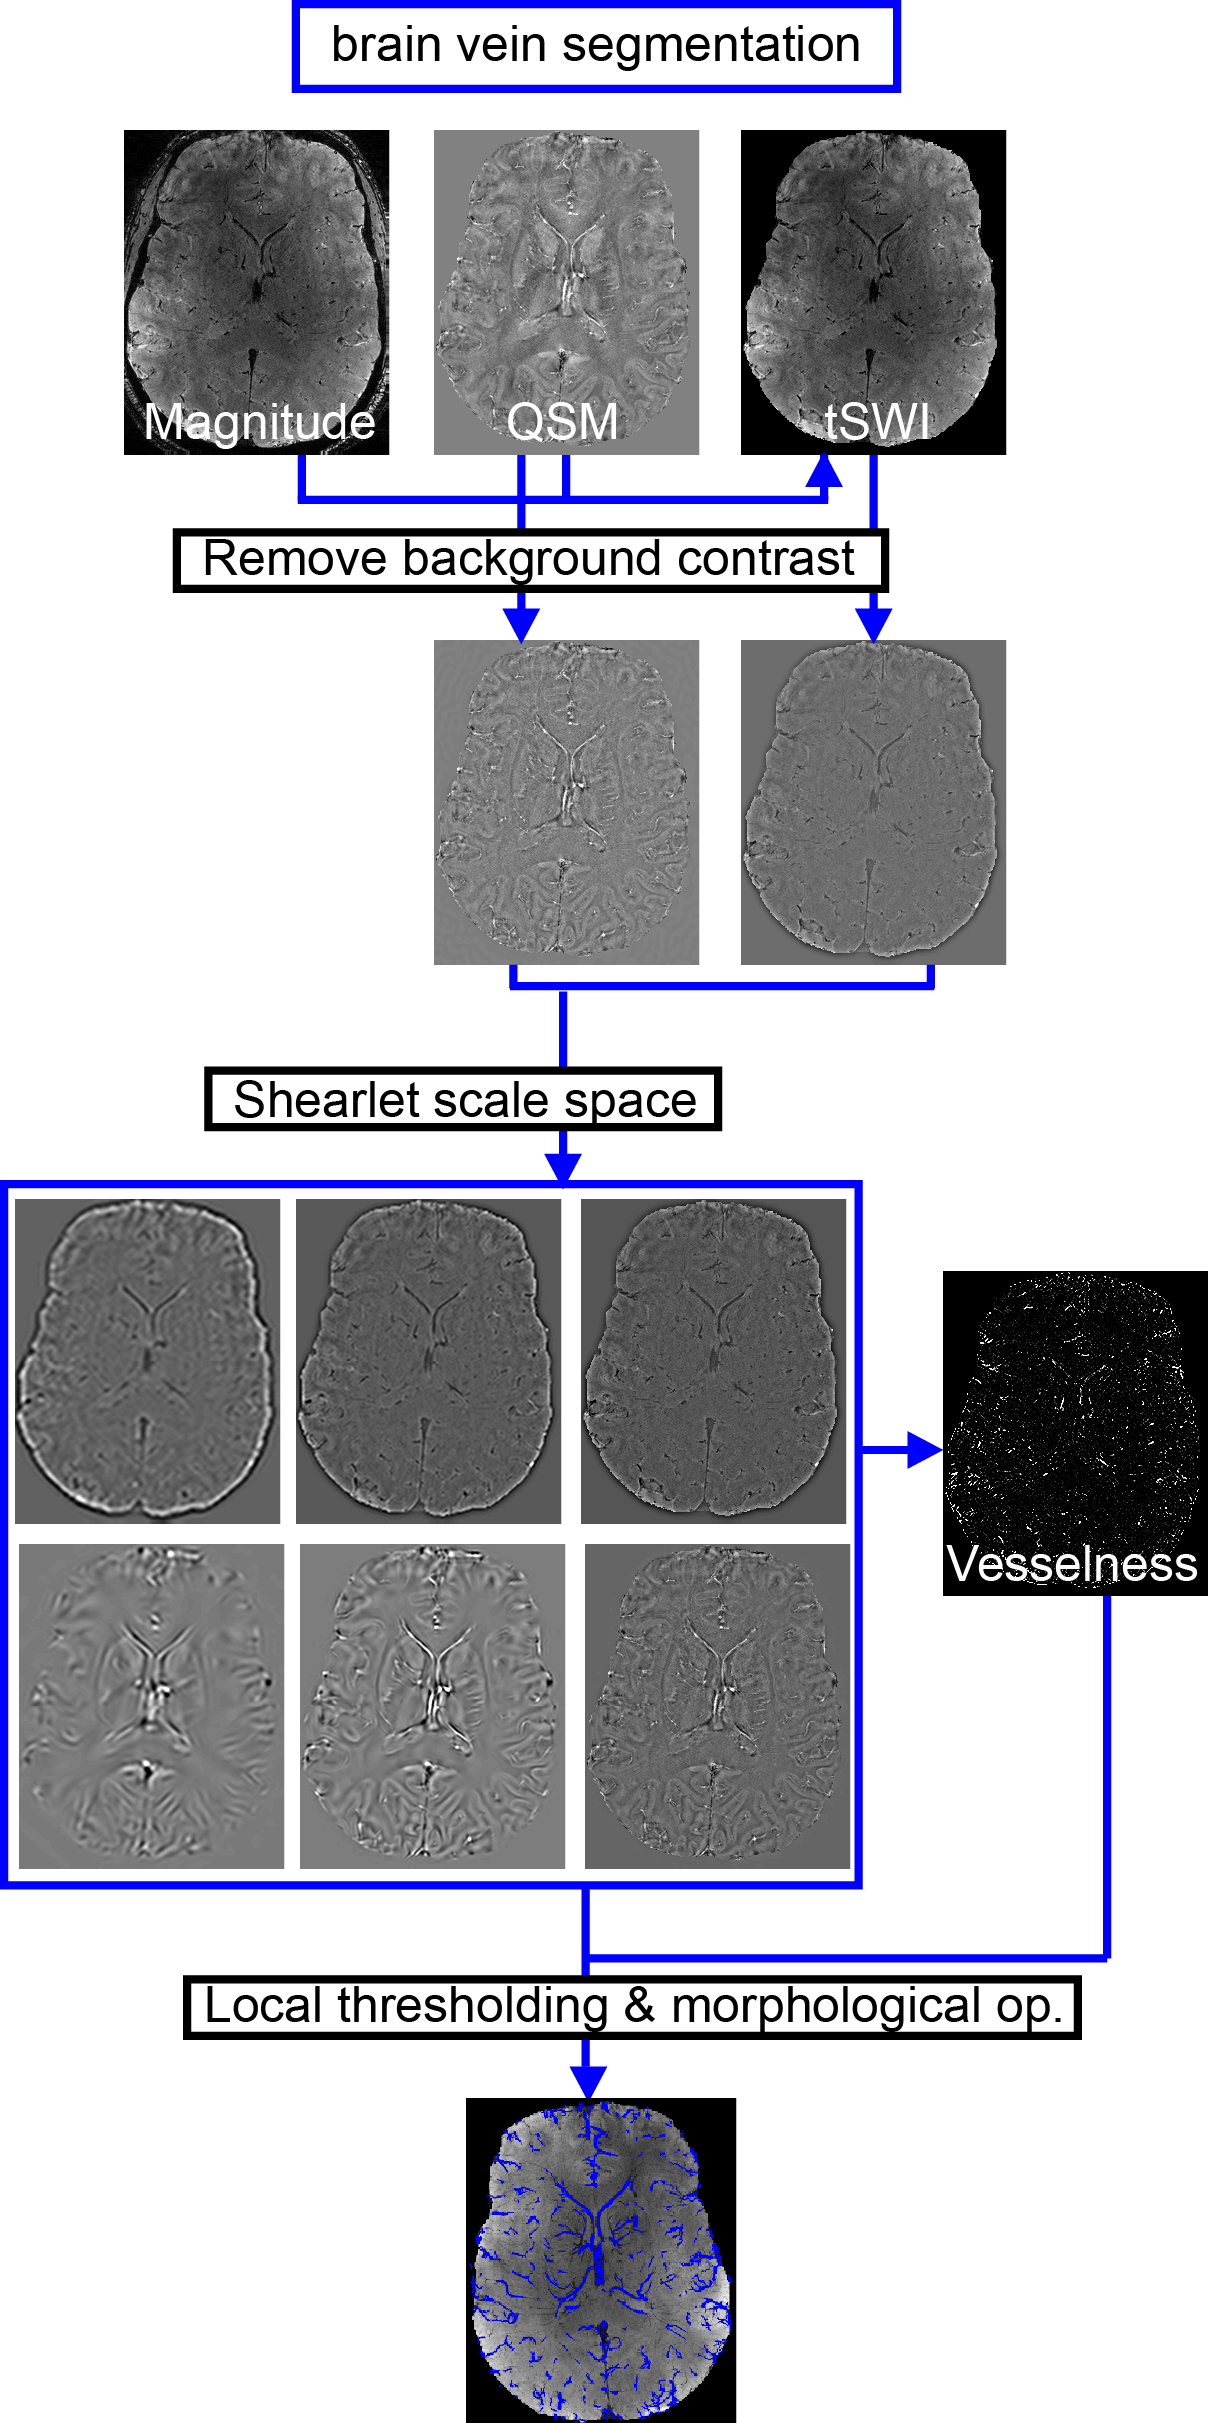
Input data for the algorithm are gradient echo magnitude, susceptibility, $$$R_2^*$$$ data if available, and a brain mask (Figure 1):1. All input data is multiplied with the brain mask and tSWI7 is computed from QSM and magnitude data.
2. Background contrast suppression with inverse Hamming filter8 is applied to QSM, ($$$R_2^*$$$), and tSWI, followed by a normalization step to normalize the background suppressed data and to obtain $$$QSM_{BG}^{n}$$$, $$$tSWI_{BG}^{n}$$$, ($$$R_{2,BG}^{*,n}$$$).
3. From the denoised shearlet coefficients9 of $$$QSM_{BG}^{n}$$$, $$$tSWI_{BG}^{n}$$$, ($$$R_{2,BG}^{*,n}$$$), the imaging data is reconstructed scale-wise (two to the highest) including all coefficients of the lower scales.
4. Using the shearlet representations of the data computed in the previous step, the vesselness fractional anisotropy tensor10 is computed for each scale for the $$$tSWI_{BG}^{n}$$$ (for dark vessel contrast), and $$$QSM_{BG}^{n}$$$ data (for bright vessel contrast), or if $$$R_{2,BG}^{*,n}$$$ is available, for $$$R_{2,BG}^{*,n}$$$ multiplied by $$$QSM_{BG}^{n}$$$ instead. Before local thresholding, the maximum of the $$$tSWI_{BG}^{n}$$$-based and the $$$QSM_{BG}^{n}$$$/$$$R_{2,BG}^{*,n}$$$-based vesselness function is taken for each scale and multiplied with the regularization function to suppress artifacts from field inhomogeneities11. The local vesselness segmentations for several scales are then combined into one binary mask $$$seg_{vesselness}$$$ that is one for any voxel for which at least one segmentation equals one.
5. Several local thresholding steps ensure that both small and large venous vessels are included in the final segmentation and that calcified structures are excluded:
a. For the lowest scale only $$$QSM_{BG}^{n}$$$, (and $$$R_{2, BG}^{*,n}$$$) are thresholded locally, clusters of size smaller than two voxels in a 26-connected neighborhood are removed, and holes between connected pixels are filled (6-connected). This step is iterated. In each iteration, voxels that are already included in the segmentation are set to the mean values of the masked brain.
b. To remove missegmenations, e.g, along the falx cerebri, local thresholding to segment structures that appear dark both on SWI and QSM is performed, and $$$seg_{remove}$$$ is obtained.
c. For all, except the highest, scales, only $$$tSWI_{BG}^{n}$$$ and $$$QSM_{BG}^{n}$$$ are thresholded locally. For the highest scale, $$$R_{2,BG}^{*,n}$$$ is used as well if available.
6. Finally, voxels are included if $$$seg_{vesselness}$$$ is one, any segmentation from 5c equals one, and $$$seg_{remove}$$$ is zero. Then, all voxels that were segmented in 5a are added. Clusters of voxels samller than two voxels are removed.
Methods
Data acquisitionData were acquired in accordance with the Declaration of Helsinki from five healthy volunteers (mean age 44.2±10.1 years , one female) who provided written informed consent at a 7 Tesla whole-body system (Magnetom 7 Tesla, Siemens Healthinieers) with a 8Tx/32Rx-channel head coil (Nova Medical Inc., Wakefield, MA, USA) using an in-house-constructed butler matrix. A three-dimensional bipolar multi-echo gradient echo (ME-GRE) sequence was acquired in strictly transversal orientation with sequence parameter: TR=36ms, TE1-12=3.14/ 6.28/9.42/11.99/14.56/17.13/19.7/22.27/24.84/27.41/29.98/32.55ms, voxelsize=0.5×0.5×0.6mm3, FA=10°, pixel bandwidths=490Hz/px, slice/ phase partial Fourier=6/8, GRAPPA factor/reference lines=3/48.
Data processing
Single-channel data were combined on the scanner using ASPIRE12. QSM was computed from the second echo only with Laplacian-based phase unwrapping13-15, V-SHARP14,15 with a brain mask computed in FSL Brain Extraction Tool16, and the STAR-QSM algorithm17. R2* maps were calculated with the ARLO algorithm18 from the magnitude data of all echoes.
Data evaluation
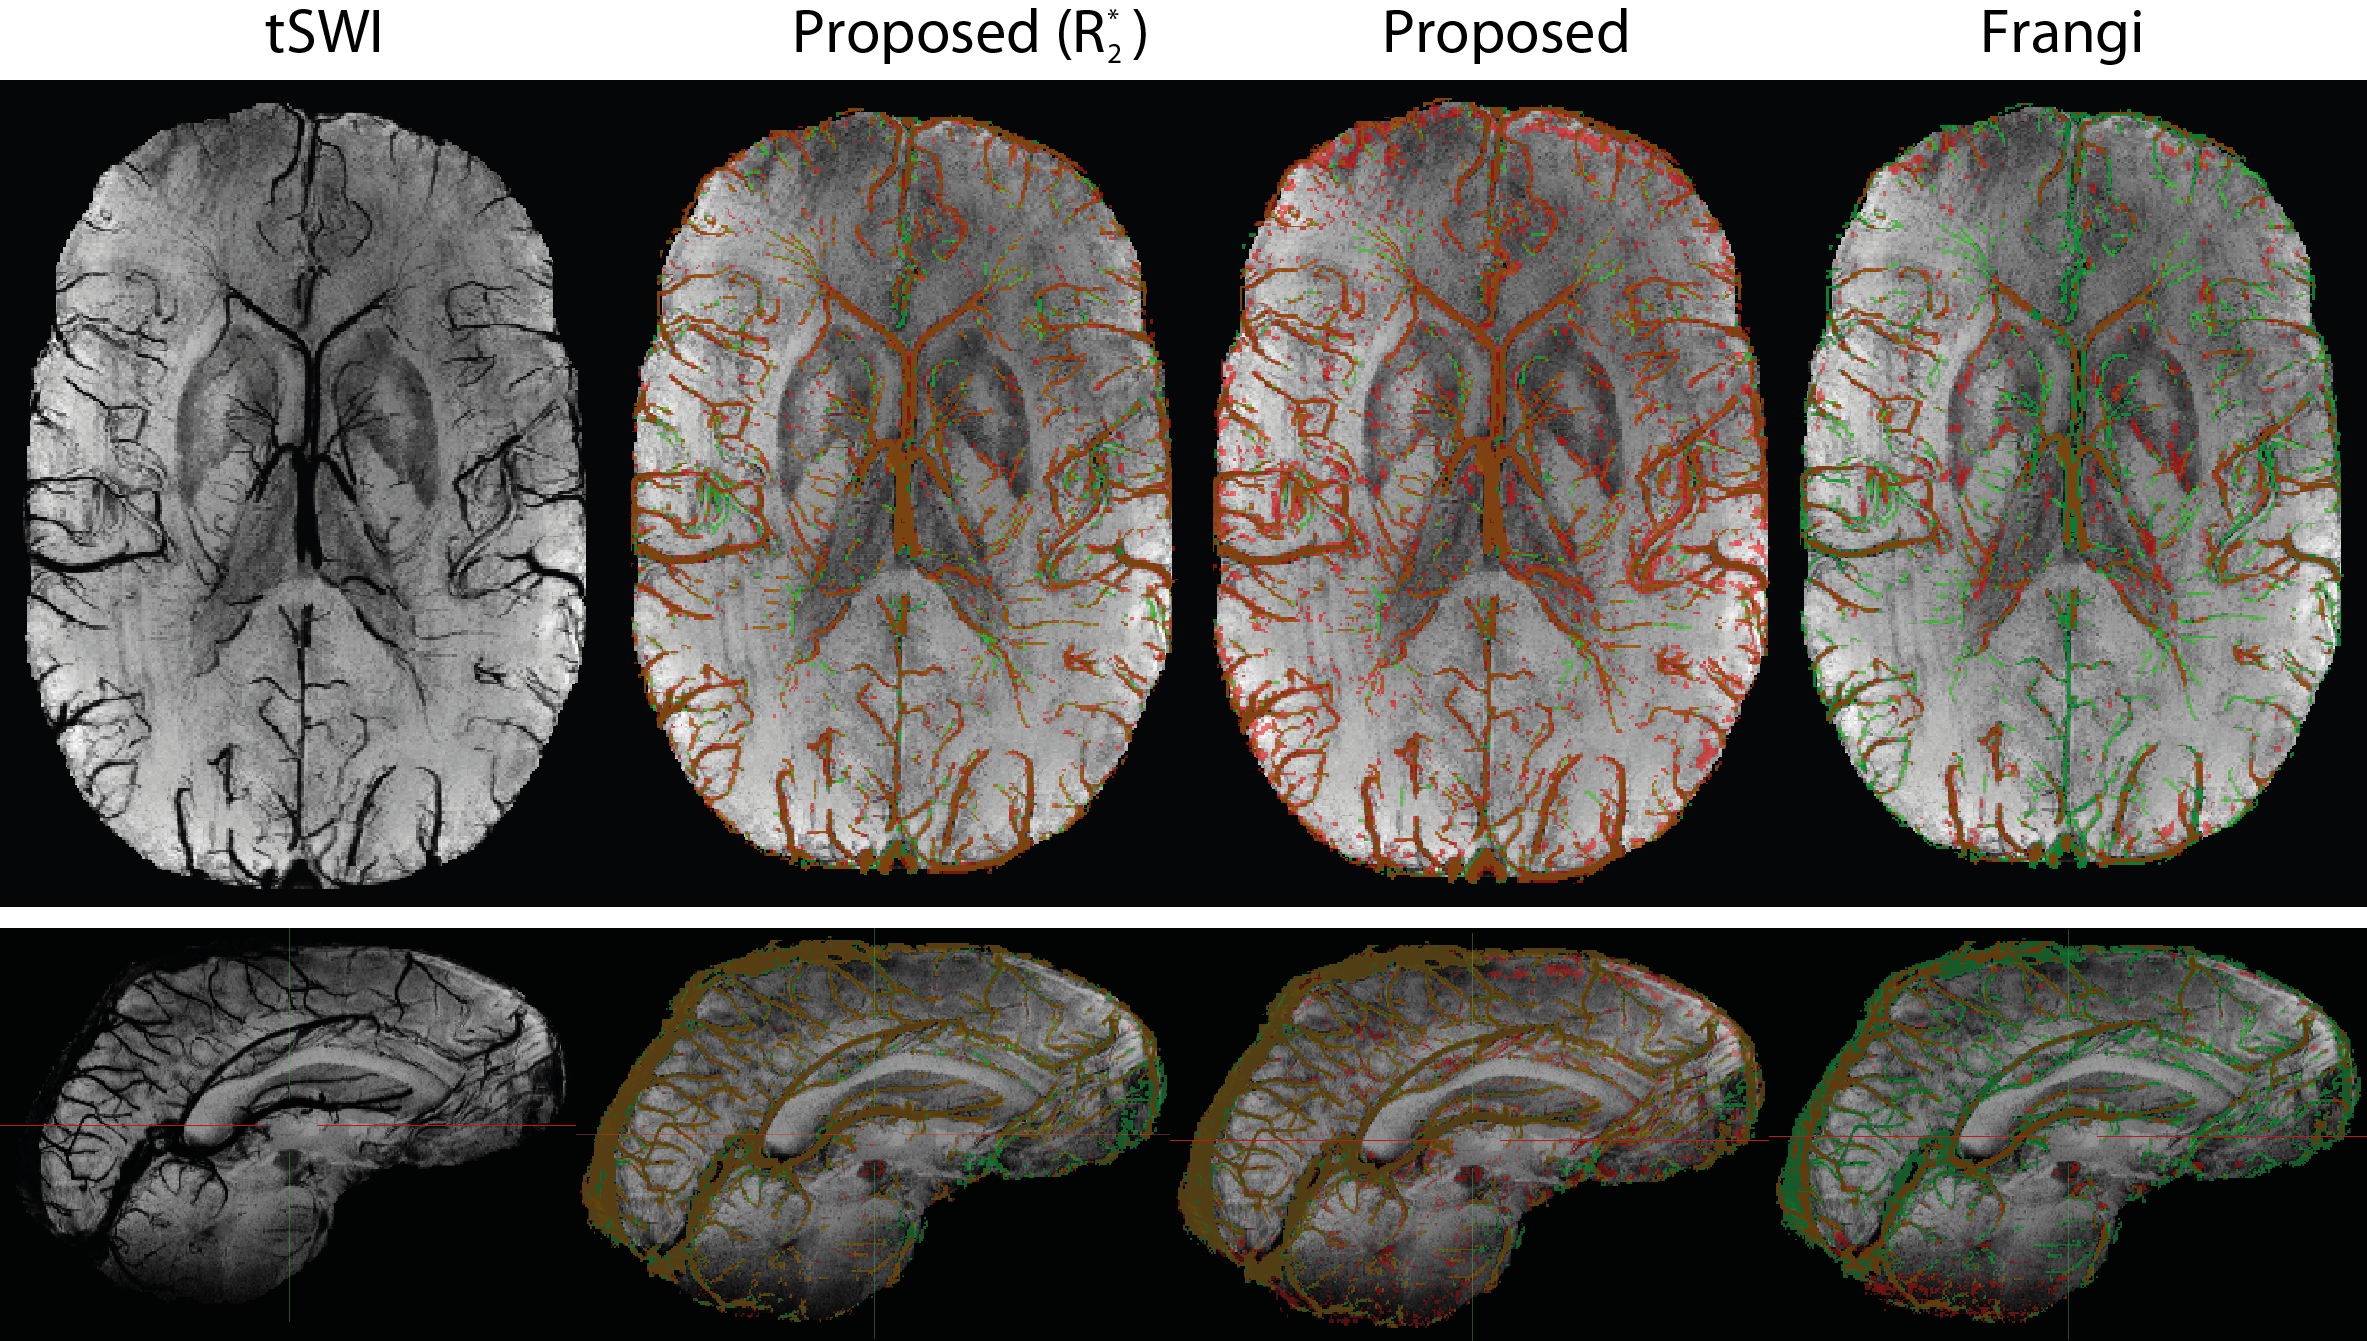
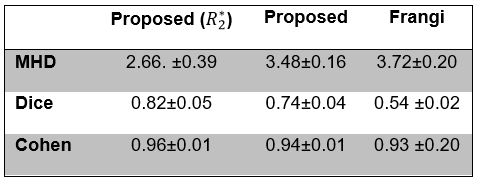
Axial and sagittal 16-slices minimal/ maximal intensity projections were computed for SWI/QSM from central slabs. A neuroradiologist with 8 years of experience manually delineated all venous vessels on these projections. Dice coefficient$$$=2TP/(2TP+FP+FN)$$$, where TP is the number of true positive, FP false positive, and FN false negative voxels, Cohen’s kappa and the modified Hausdorff distance (MHD)19 were used to evaluate the quality of the segmentations. For comparison, the classical Frangi Vesselness filter was computed on tSWI and QSM20. For a local threshold above 0.05 on tSWI, and 0.02 on QSM, voxels were included in the vein segmentation.
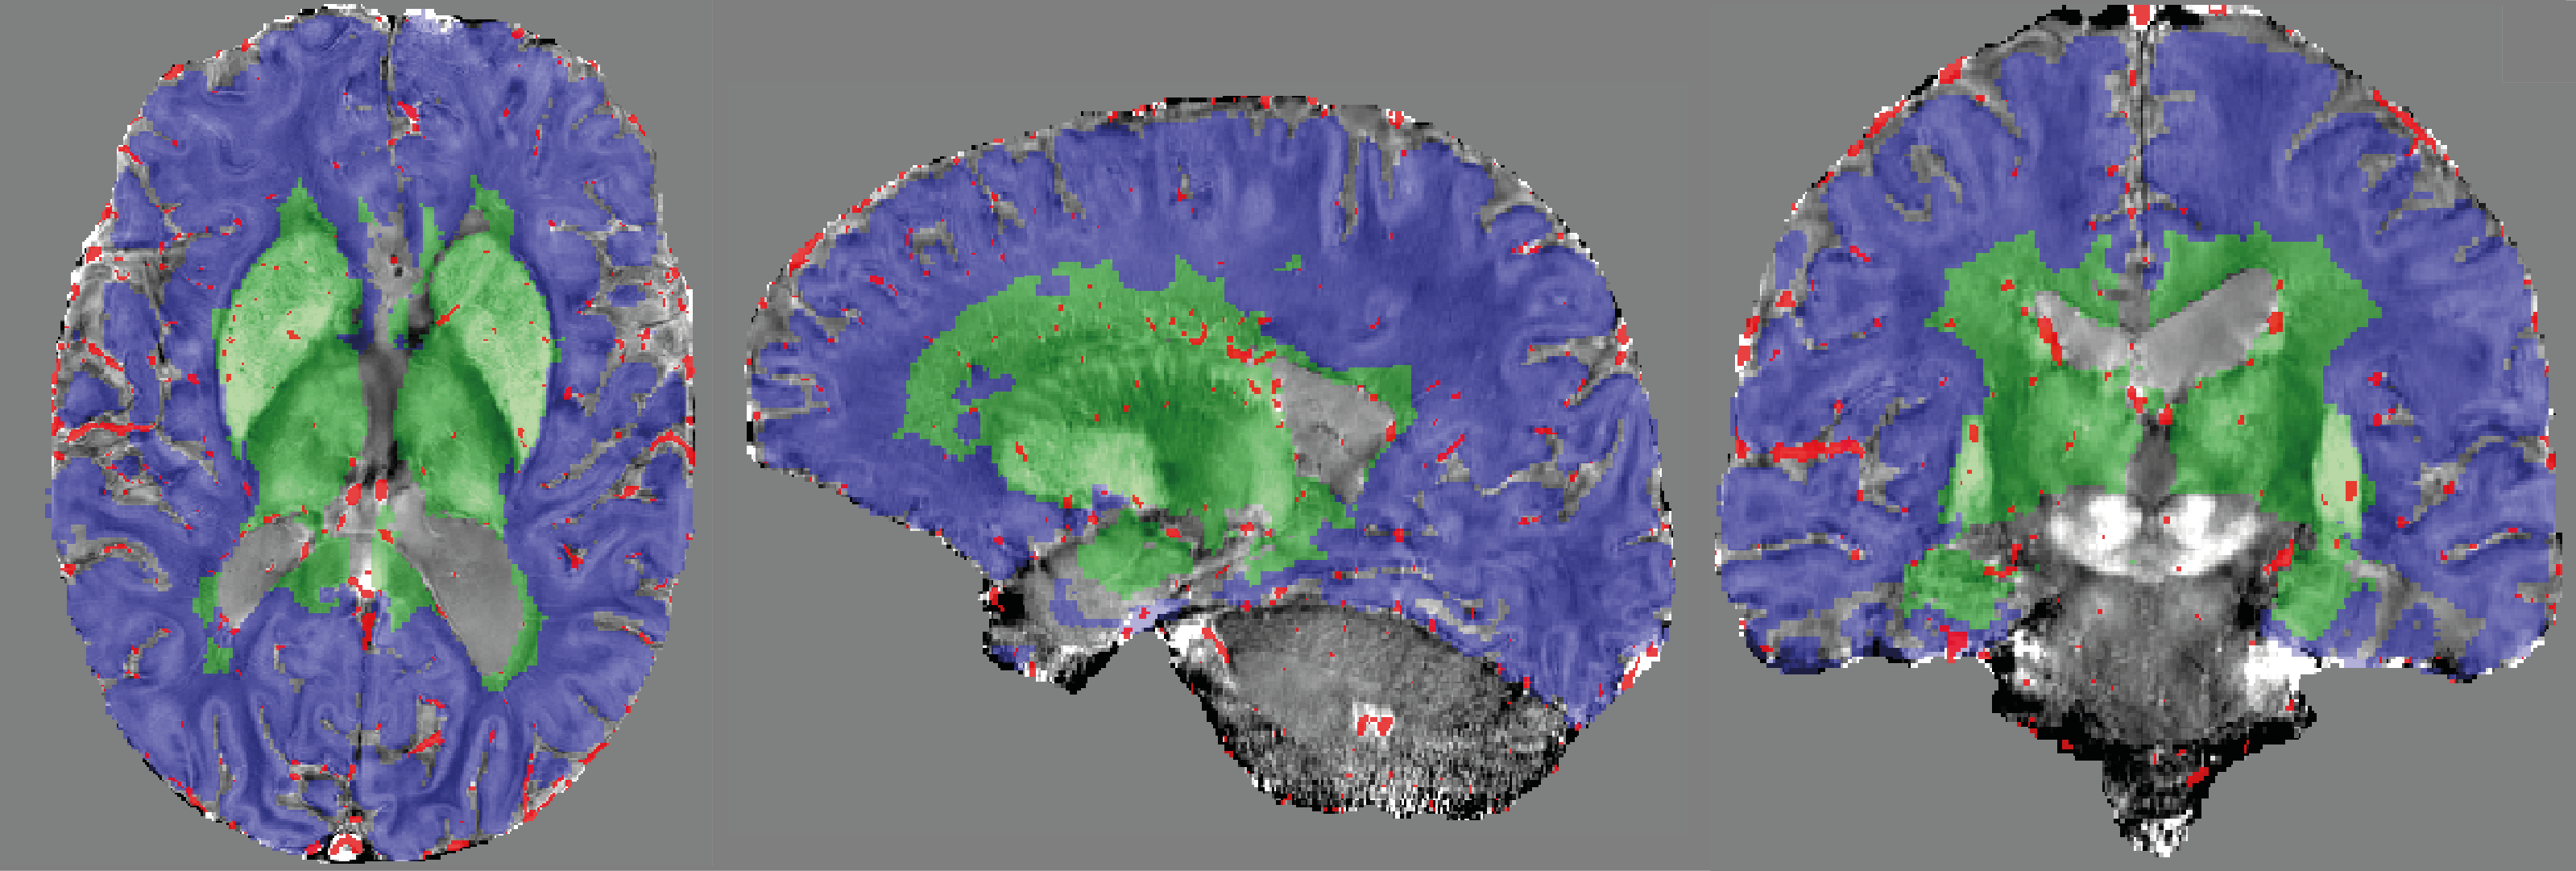
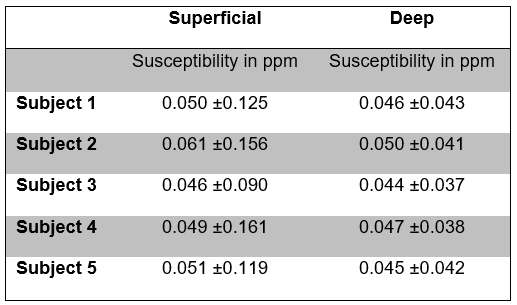
Freesurfer21 was used to generate segmentations of all white and grey matter regions from a MP2RAGE scan that was acquired during the same imaging session. The different labels were combined to yield a mask for superficial/deep vascular territories (Figure 2). These masks were intersected with the vein segmentation to obtain susceptibility values for blood in deep and superficial venous vessels.
Results and Discussion
Both visually (Figure 3) and quantitatively (Table 1), the proposed algorithm yields an accurate segmentation which is superior to the local thresholding/Frangi filter combination applied to QSM/tSWI which is currently often used in the literature (e.g. in Ref. 20). Autoregulation through neurovascular coupling is thought to balance regionally increased metabolism22. However, in accordance with neuronal activity related main cerebral oxygen consumption23,24, the evaluation of blood susceptibility in superficial and deep vascular territories with this brain vein segmentation algorithm consistently visualized a subtle increase in susceptibility values (Table 2) in superficial, cortex-rich territories.Acknowledgements
This work was supported by a grant from Deutsche Forschungsgemeinschaft (Grant number: DFG STR 1480/2-1).The use of the ASPIRE gradient echo sequence and corresponding ICE program for coil combination of the 7 T GRE data provided by Korbinian Eckstein and Simon D. Robinson is kindly acknowledgedReferences
1. Gupta A, Baradaran H, Schweitzer AD, Kamel H, Pandya A, Delgado D, Wright D, Hurtado-Rua S, Wang Y, Sanelli PC. Oxygen extraction fraction and stroke risk in patients with carotid stenosis or occlusion: a systematic review and meta-analysis. AJNR Am J Neuroradiol. 2014;35(2):250-5. Epub 2013/08/16. doi: 10.3174/ajnr.A3668. PubMed PMID: 23945227.
2. Derdeyn CP, Videen TO, Grubb RL, Jr., Powers WJ. Comparison of PET oxygen extraction fraction methods for the prediction of stroke risk. J Nucl Med. 2001;42(8):1195-7. Epub 2001/08/03. PubMed PMID: 11483680.
3. Leenders KL. PET: blood flow and oxygen consumption in brain tumors. J Neurooncol. 1994;22(3):269-73. Epub 1994/01/01. doi: 10.1007/BF01052932. PubMed PMID: 7760106.
4. Thomas BP, Sheng M, Tseng BY, Tarumi T, Martin-Cook K, Womack KB, Cullum MC, Levine BD, Zhang R, Lu H. Reduced global brain metabolism but maintained vascular function in amnestic mild cognitive impairment. J Cereb Blood Flow Metab. 2017;37(4):1508-16. Epub 2016/07/09. doi: 10.1177/0271678X16658662. PubMed PMID: 27389176; PMCID: PMC5453471.
5. Narotam PK, Morrison JF, Nathoo N. Brain tissue oxygen monitoring in traumatic brain injury and major trauma: outcome analysis of a brain tissue oxygen-directed therapy. J Neurosurg. 2009;111(4):672-82. Epub 2009/05/26. doi: 10.3171/2009.4.JNS081150. PubMed PMID: 19463048.
6. Kudo K, Liu T, Murakami T, Goodwin J, Uwano I, Yamashita F, Higuchi S, Wang Y, Ogasawara K, Ogawa A, Sasaki M. Oxygen extraction fraction measurement using quantitative susceptibility mapping: Comparison with positron emission tomography. J Cerebr Blood F Met. 2016;36(8):1424-33. doi: 10.1177/0271678x15606713. PubMed PMID: WOS:000382092700009.
7. Liu SF, Mok K, Neelavalli J, Cheng YCN, Tang J, Ye YQ, Haacke EM. Improved MR Venography Using Quantitative Susceptibility-Weighted Imaging. J Magn Reson Imaging. 2014;40(3):698-708. doi: 10.1002/jmri.24413. PubMed PMID: WOS:000340538200025.
8. Jin ZY, Xia L, Zhang MM, Du YPP. Background-Suppressed MR Venography of the Brain Using Magnitude Data: A High-Pass Filtering Approach. Comput Math Method M. 2014. doi: Artn 812785 10.1155/2014/812785. PubMed PMID: WOS:000337885800001.
9. Kutyniok G, Lim WQ, Reisenhofer R. ShearLab 3D: Faithful Digital Shearlet Transforms Based on Compactly Supported Shearlets. Acm T Math Software. 2016;42(1). doi: 10.1145/2740960. PubMed PMID: WOS:000373249900005.
10. Alhasson HF, Alharbi SS, Obara B. 2D and 3D vascular structures enhancement via multiscale fractional anisotropy tensor. European Conference on Computer Vision; Munich, Germany: Springer; 2018.(https://github.com/Haifafh/MFAT)
11. Monti S, Cocozza S, Borrelli P, Straub S, Ladd ME, Salvatore M, Tedeschi E, Palma G. MAVEN: An Algorithm for Multi-Parametric Automated Segmentation of Brain Veins From Gradient Echo Acquisitions. Ieee T Med Imaging. 2017;36(5):1054-65. doi: 10.1109/Tmi.2016.2645286. PubMed PMID: WOS:000400869700002.
12. Eckstein K, Dymerska B, Bachrata B, Bogner W, Poljanc K, Trattnig S, Robinson SD. Computationally Efficient Combination of Multi-channel Phase Data From Multi-echo Acquisitions (ASPIRE). Magn Reson Med. 2018;79(6):2996-3006. doi: 10.1002/mrm.26963. PubMed PMID: WOS:000426866400014.
13. Li W, Wu B, Liu CL. Quantitative susceptibility mapping of human brain reflects spatial variation in tissue composition. Neuroimage. 2011;55(4):1645-56. doi: 10.1016/j.neuroimage.2010.11.088. PubMed PMID: WOS:000288843500026.
14. Li W, Avram AV, Wu B, Xiao X, Liu CL. Integrated Laplacian-based phase unwrapping and background phase removal for quantitative susceptibility mapping. Nmr in Biomedicine. 2014;27(2):219-27. doi: 10.1002/nbm.3056. PubMed PMID: WOS:000329986900012.
15. Wu B, Li W, Guidon A, Liu CL. Whole brain susceptibility mapping using compressed sensing. Magn Reson Med. 2012;67(1):137-47. doi: 10.1002/mrm.23000. PubMed PMID: WOS:000298482800016.
16. Smith SM. Fast robust automated brain extraction. Hum Brain Mapp. 2002;17(3):143-55. doi: 10.1002/hbm.10062. PubMed PMID: WOS:000178994100001.
17. Wei HJ, Dibb R, Zhou Y, Sun YW, Xu JR, Wang N, Liu CL. Streaking artifact reduction for quantitative susceptibility mapping of sources with large dynamic range. Nmr in Biomedicine. 2015;28(10):1294-303. doi: 10.1002/nbm.3383. PubMed PMID: WOS:000363468300012.
18. Pei M, Nguyen TD, Thimmappa ND, Salustri C, Dong F, Cooper MA, Li J, Prince MR, Wang Y. Algorithm for fast monoexponential fitting based on Auto-Regression on Linear Operations (ARLO) of data. Magn Reson Med. 2015;73(2):843-50. Epub 2014/03/24. doi: 10.1002/mrm.25137. PubMed PMID: 24664497.
19. Dubuisson M, Jain AK. A modified Hausdorff distance for object matching. Proceedings of 12th International Conference on Pattern Recognition, Jerusalem, Israel. 1994;1:566-8. doi: 10.1109/ICPR.1994.576361.
20. Ma YH, Mazerolle EL, Cho JH, Sun HF, Wang Y, Pike GB. Quantification of brain oxygen extraction fraction using QSM and a hyperoxic challenge. Magn Reson Med. 2020. doi: 10.1002/mrm.28390. PubMed PMID: WOS:000544077500001.
21. Fischl B. FreeSurfer. Neuroimage. 2012;62(2):774-81. doi: 10.1016/j.neuroimage.2012.01.021. PubMed PMID: WOS:000306390600031.
22. Hyder F, Rothman DL, Bennett MR. Cortical energy demands of signaling and nonsignaling components in brain are conserved across mammalian species and activity levels. Proc Natl Acad Sci U S A. 2013;110(9):3549-54. Epub 2013/01/16. doi: 10.1073/pnas.1214912110. PubMed PMID: 23319606; PMCID: PMC3587194.
23. Kasischke KA, Vishwasrao HD, Fisher PJ, Zipfel WR, Webb WW. Neural activity triggers neuronal oxidative metabolism followed by astrocytic glycolysis. Science. 2004;305(5680):99-103. Epub 2004/07/03. doi: 10.1126/science.1096485. PubMed PMID: 15232110.
24. Attwell D, Buchan AM, Charpak S, Lauritzen M, Macvicar BA, Newman EA. Glial and neuronal control of brain blood flow. Nature. 2010;468(7321):232-43. Epub 2010/11/12. doi: 10.1038/nature09613. PubMed PMID: 21068832; PMCID: PMC3206737.
Figures