4322
Simultaneous Oxygenation and Metabolic Imaging Relates Oxygen and Neuronal Metabolism in Acute Stroke1School of Biomedical Engineering, Shanghai Jiao Tong University, Shanghai, China, 2Beckman Institute for Advanced Science and Technology, University of Illinois at Urbana-Champaign, Urbana, IL, United States, 3Department of Electrical and Computer Engineering, University of Illinois at Urbana-Champaign, Urbana, IL, United States, 4Radiology Department, The Fifth People's Hospital of Shanghai, Fudan University, Shanghai, China, 5Neurology Department, The Fifth People's Hospital of Shanghai, Fudan University, Shanghai, China, 6Shanghai Minhang Hospital of Integrated Traditional Chinese and Western Medicine Hospital, Shanghai, China, 7Department of Biomedical Engineering, Case Western Reserve University, Cleveland, OH, United States
Synopsis
Elevated oxygen extraction fraction and impaired neurometabolic metabolism are hallmarks of at-risk tissue in acute ischemic stroke. This study investigated the concurrent changes of oxygen and neuronal metabolisms. In an 8-min scan using SPICE, we simultaneously obtained 3D maps of neurometabolites (2.0 x 3.0 x 3.0 mm3 nominal spatial resolution) and T2'/oxygen extraction fraction (1.0 x 1.0 x 1.9 mm3 nominal resolution). Our results showed the expected changes in oxygenation and neurometabolite markers individually, and also their coupling. This study may lay a foundation for prediction of tissue viability in acute stroke using noninvasive multimodal high-resolution metabolic imaging.
Introduction
Rapid and accurate assessment of brain tissue metabolic function is of critical importance in the treatment of patients with acute stroke.1 Elevated oxygen extraction fraction (OEF) is a hallmark of at-risk tissue in acute ischemia,2 and neurometabolic changes, including increased lactate due to a switch from aerobic to anaerobic metabolism and degraded neuronal integrity, reflect tissue viability at the molecular level.3 Although the changes of oxygen and neuronal metabolism are known to be concurrent and interdependent, the relation between altered oxidative metabolism and neurometabolic changes in acute stroke patients is still largely unexplored because of the lack of imaging technology rapid and flexible enough to be applicable at the clinical frontline. Quantitative T2' mapping and quantitative susceptibility mapping (QSM) provide surrogate biomarkers for detecting OEF changes because of its sensitivity to local paramagnetic deoxygenated hemoglobin concentrations.4-8 MRSI has been recognized as a potentially powerful tool for detection of neurometabolic alterations noninvasively. In this study, we used the latest SPICE technology to achieve 2.0 x 3.0 x 3.0 mm3 nominal resolution for MRSI and 1.0 x 1.0 x 1.9 mm3 resolution for QSM/ T2* maps, which were used to derive venous OEF and T2' measurements. The capability for simultaneous 3D mapping of brain oxygen and neuronal metabolism in acute stroke was demonstrated in clinical settings. Our study results also suggest a potential clinically applicable measure of tissue viability derived from noninvasive multimodal high-resolution metabolic imaging in acute stroke.Methods
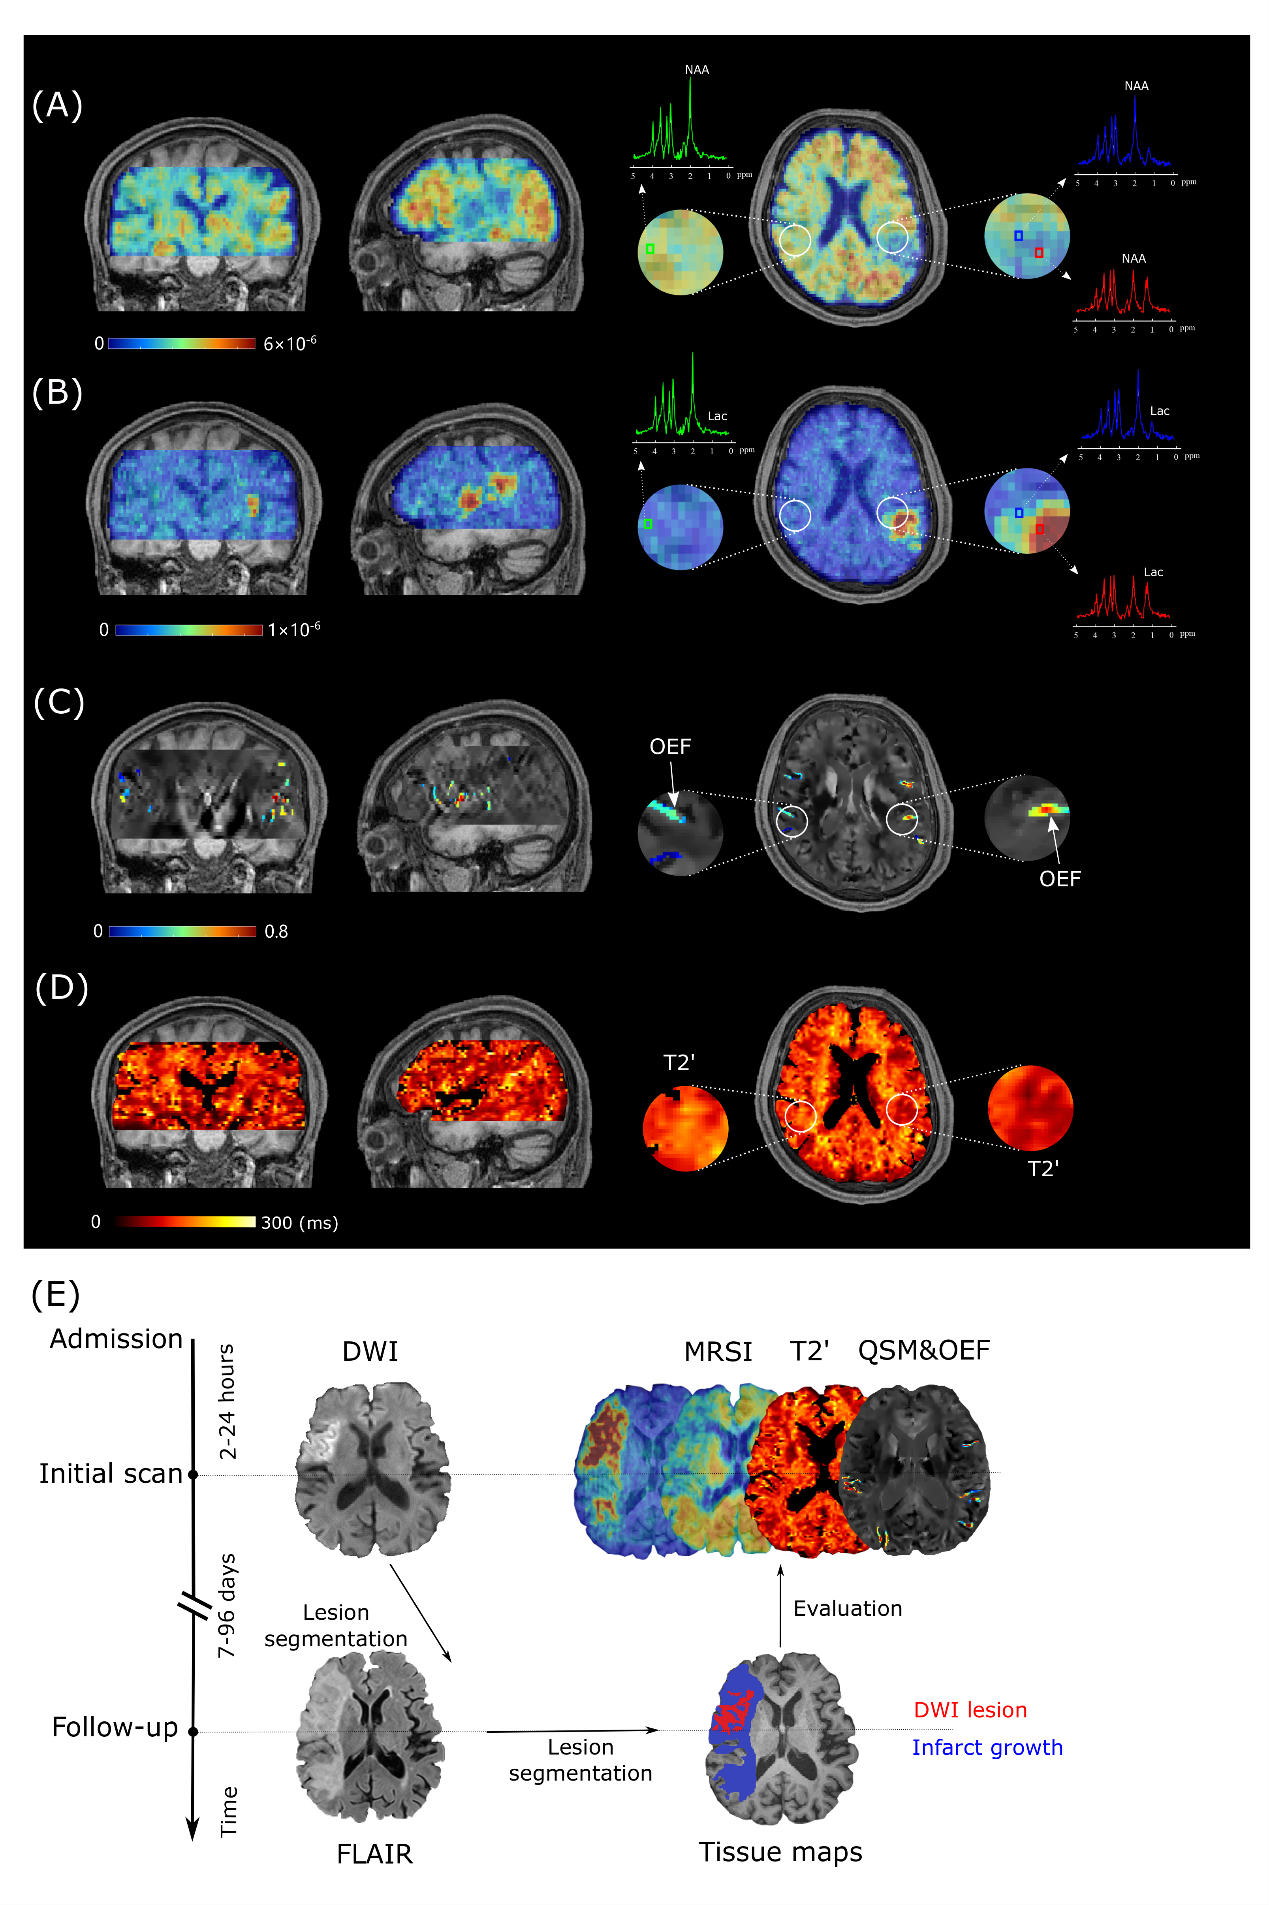
Twenty-five patients within stroke onset <24h were included in the analysis. All imaging was performed on a 3T Siemens Skyra MR scanner. The data acquisition sequences for initial MRI scans included SPICE (1.0 x 1.0 x 1.9 mm3 for QSM/T2*, 2.0 x 3.0 x 3.0 mm3 for MRSI, FOV = 240 x 240 x 72 mm3, FA = 27°, TE = 1.6 ms, TR = 160 ms), 3D MPRAGE imaging (1.0 x 1.0 x 1.0 mm3, FOV = 256 mm, TR = 2400 ms, TE = 2.13 ms), DWI (1.3 x 1.3 x 4.0 mm3, FOV = 220 mm, b = 0 and b = 1000 s/mm2, TR = 5200 ms, TE = 64 ms), and turbo spin-echo imaging for mapping T2 (1.9 x 1.9 x 3.0 mm3, FOV = 240 mm, TR = 5030 ms, TE = 18, 36, 62 ms). The follow-up scans included FLAIR imaging (0.5 x 0.5 x 2.0 mm3, FOV = 240mm, TR = 9000 ms, TE = 89 ms). The T2' maps were calculated using the equation: 1/T2' = 1/T2* -1/T2.The high-resolution QSM and T2* maps were both generated from the water signals reconstructed from the sparsely sampled data using a union-of-subspaces model.12 The QSM was calculated by solving the inverse dipole model.10 We further obtained venous OEF from the reconstructed QSM maps within a venous mask created using a Hessian-based vessel enhancement filter.8,11 From the metabolic signals, the spatial distributions of various molecules, e.g. N-acetylaspartate (NAA) and lactate, were obtained after spatiospectral reconstruction using a union-of-subspaces model, incorporating pre-learned spectral basis functions.9
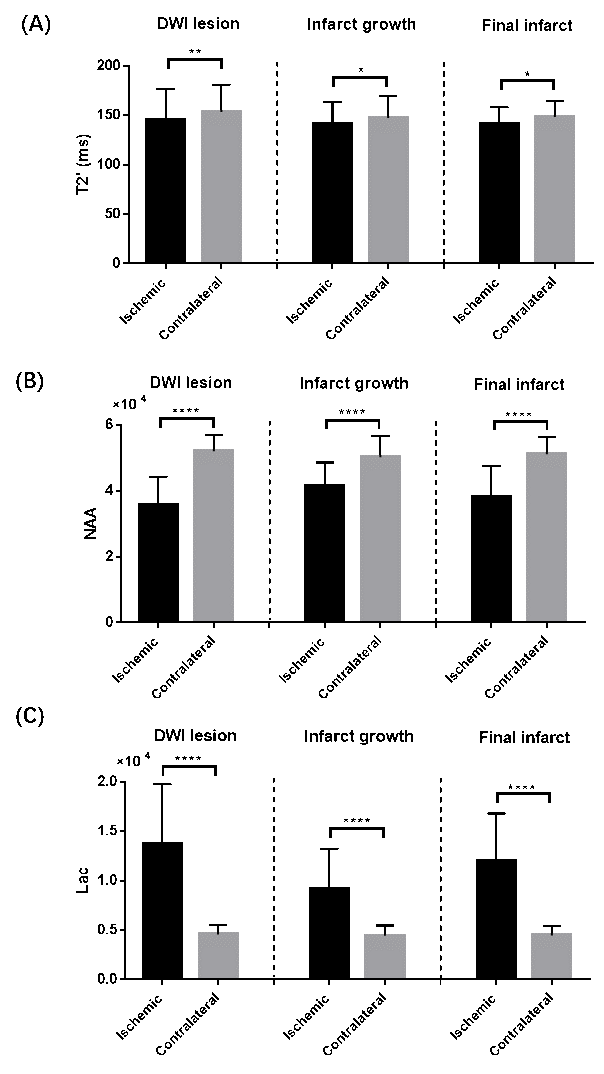
The infarct core area was defined as ADC below 620 × 10-6 mm2/s.13 The final infarct was manually defined on the follow-up FLAIR images. The infarct growth area was defined as tissue present in the final FLAIR infarct but not in the acute ADC lesion. Inter-hemisphere comparisons were performed using paired t-tests or Wilcoxon signed-rank tests after Kolmogorov-Smirnov normality tests for the data. Pearson’s correlation analysis was used to evaluate the relationship between different biomarkers. This study was approved by the Institutional Review Board of the Fifth People’s Hospital of Shanghai, China.
Results and Discussion
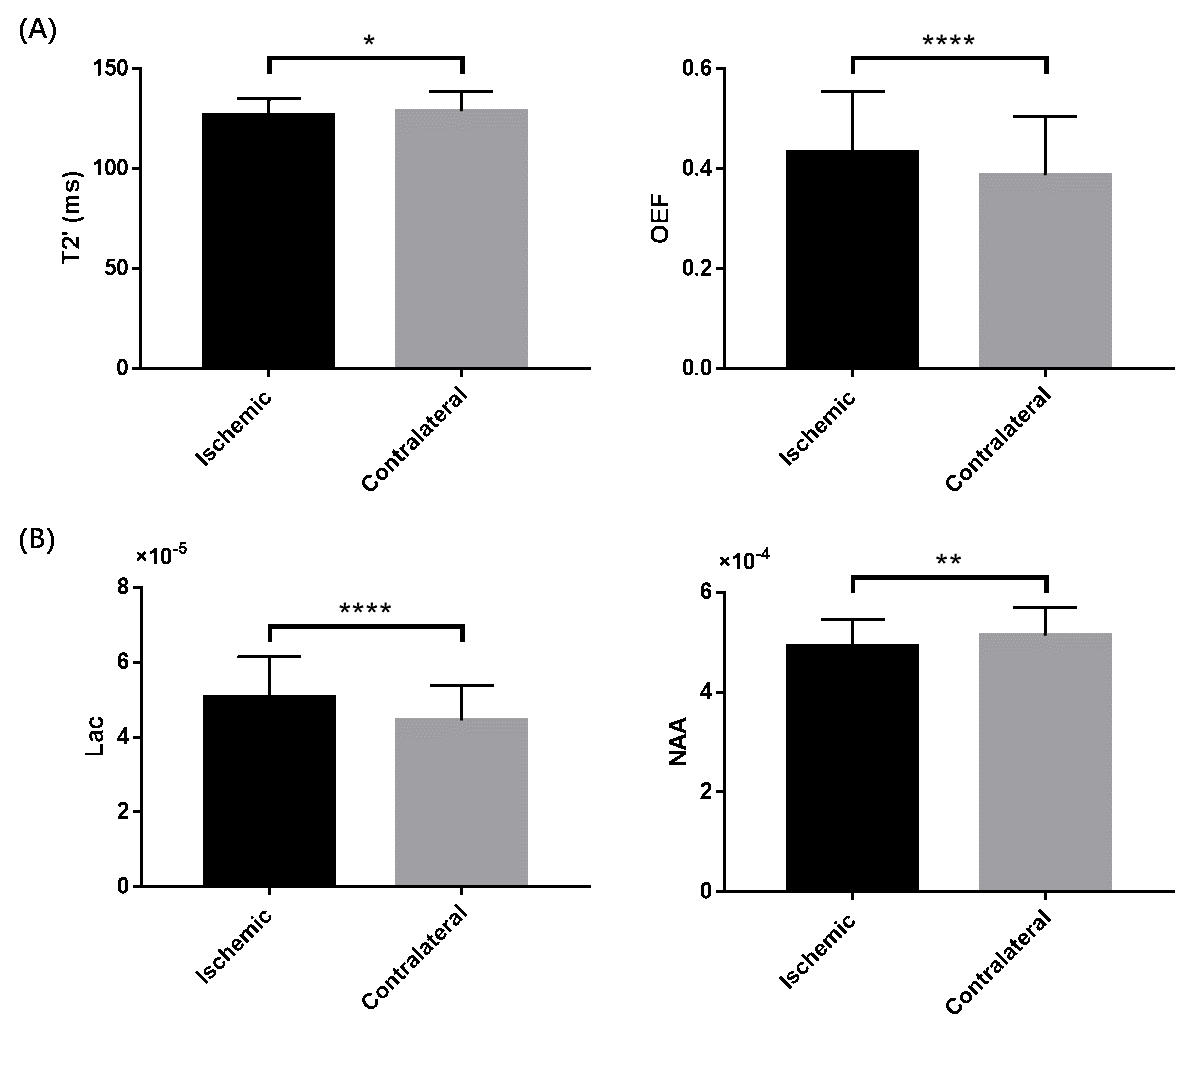
Representative high-resolution 3D MRSI maps of lactate and NAA, T2' map, as well as QSM map overlaid with venous OEF values, are shown in Fig 1. For the inter-hemispheric comparison, the mean venous OEF of the ipsilateral hemisphere was higher than that of the contralateral hemisphere (p < 0.0001). A decrease in NAA (p = 0.007) and T2' (p = 0.028) and an increase in lactate (p < 0.0001) were also observed, as shown in Fig 2. Significant decreases in T2' (DWI lesion: p = 0.007, infarct growth: p = 0.042, final infarct: p = 0.012) and NAA (p < 0.0001 for all), and increases in lactate (p < 0.0001 for all) were detected in the ischemic versus contralateral homologous regions, as shown in Fig 3. Significant negative correlations were found between T2' value and lactate level (r = - 0.612, p = 0.009) as well as lactate/NAA (r = - 0.657, p = 0.004) in the infarct growth region, but not in the infarct core, as shown in Fig 4.Conclusions
This study demonstrated the feasibility of simultaneous 3D mapping of brain oxygenation and neuronal metabolism in acute stroke in the clinical settings. Our findings of concurrent coupling of oxygenation and neurometabolites may lay a foundation for further investigation of tissue viability in acute stroke using noninvasive multimodal high-resolution metabolic imaging.Acknowledgements
Y. L. is funded by National Science Foundation of China (No.61671292 and 81871083) and Shanghai Jiao Tong University Scientific and Technological Innovation Funds (2019QYA12).References
1. van Leyen K, Wang X, Selim M, et al. Opening the time window. J Cereb Blood Flow Metab. 2019;39(12):2539-2540.
2. Astrup J, Siesjö BK and Symon L. Thresholds in cerebral ischemia-the ischemic penumbra. Stroke. 1981;12(6):723-725.
3. Dani KA, Warach S. Metabolic imaging of ischemic stroke: the present and future. Am J Neuroradiol. 2014;35(6):S37-S43.
4. Geisler BS, Brandhoff F, Fiehler J, et al. Blood oxygen level–dependent MRI allows metabolic description of tissue at risk in acute stroke patients. Stroke. 2006;37(7):1778-1784.
5. Bauer S, Wagner M, Seiler A, et al. Quantitative T2′-mapping in acute ischemic stroke. Stroke. 2014;45(11):3280-3286.
6. Seiler A, Blockley NP, Deichmann R, et al. The relationship between blood flow impairment and oxygen depletion in acute ischemic stroke imaged with magnetic resonance imaging. J Cereb Blood Flow Metab. 2019;39(3):454-465.
7. Kudo K, Liu T, Murakami T, et al. Oxygen extraction fraction measurement using quantitative susceptibility mapping: comparison with positron emission tomography. J Cereb Blood Flow Metab. 2016;36(8):1424-1433.
8. Fan AP, Khalil AA, Fiebach JB, et al. Elevated brain oxygen extraction fraction measured by MRI susceptibility relates to perfusion status in acute ischemic stroke. J Cereb Blood Flow Metab. 2020;40(3):539-551.
9. Li Y, Lam F, Clifford B, et al. A subspace approach to spectral quantification for MR spectroscopic imaging. IEEE Trans Biomed Eng. 2017;64:2486-2489.
10. Peng X, Lam F, Li Y, et al. Simultaneous QSM and metabolic imaging of the brain using SPICE. Magn Reson Med. 2018;79:13-21.
11. Frangi AF, Niessen WJ, Vincken KL, et al. Multiscale vessel enhancement filtering. Med Image Comput Comput Assist Interv, Springer, Berlin, Heidelberg. 1998;130-137.
12. Guo R, Zhao Y, Li Y, et al. Simultaneous QSM and metabolic imaging of the brain using SPICE: Further improvements in data acquisition and processing. Magn Reson Med. 2020;85(2):970-977.
13. Harston GW, Tee YK, Blockley N, et al. Identifying the ischaemic penumbra using pH-weighted magnetic resonance imaging. Brain. 2015;138(1):36-42.
Figures