4317
Anatomical assessment of retinogeniculate visual pathway tractography: a comparison of multiple tractography methods1Zhejiang University of Technology, HangZhou, China, 2Harvard Medical School, Boston, MA, United States, 3Nuclear Industry 215 Hospital of Shaanxi Province, XianYang, China, 4The First Affiliated Hospital, GuangZhou, China
Synopsis
In this work, we investigate the performance of four widely used tractography methods (SD-Stream, iFOD1, UKF-1T, and UKF-2T) for the complete retinogeniculate visual pathway (RGVP) reconstruction. Anatomical measurement and expert judgement results indicate that UKF-2T and iFOD1 produce the best performance. The percentage of decussating fibers in the iFOD1 method was more similar to the known percentage from anatomical studies, while the UKF-2T method produced reconstructed RGVPs that were judged to better correspond to the anatomical course of the RGVP.
Introduction
The retinogeniculate pathway (RGVP) conveys visual information from the retina to the lateral geniculate nucleus. It can be divided into four anatomical subdivisions: two decussating and two non-decussating fiber pathways 1. Diffusion MRI (dMRI) tractography has the potential to trace these subdivisions, and detailed information about RGVP fiber pathways can help clinicians in many diseases, including pituitary tumor 2,3, glioma 4, and optic neuritis 5. However, it is not yet known which tractography strategy is most suitable for tractographic reconstruction of the RGVP.In this study, we investigate the performance of multiple tractography methods for reconstruction of the complete RGVP. Four tractography methods are compared. The first two are CSD model based tractography methods, SD-Stream and iFOD1 6, which are widely used in cranial nerve reconstruction 7–9. The other two use the unscented Kalman filter (UKF) tractography framework with single and two tensor models (UKF-1T and UKF-2T) 10, which has recently shown high performance in tracking the cranial nerve 11,12. We evaluate the tractography results using anatomical measurement and expert judgment experiments.
Methods
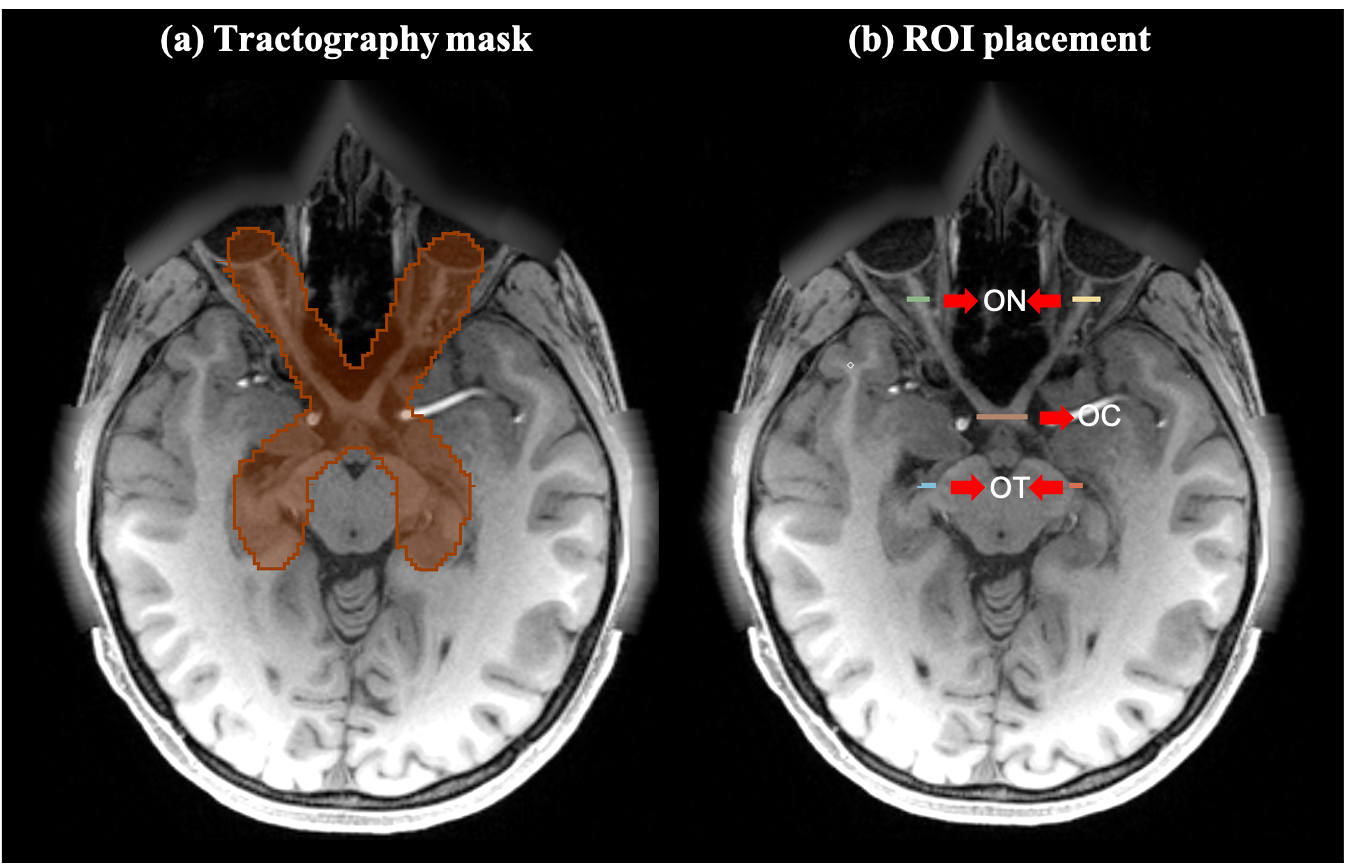
We used a total of 62 dMRI datasets from the HCP database 13 for experimental evaluation. All of these datasets have complete RGVP coverage. We separated the multi-shell HCP data into single-shell, where the b=1000 s/mm2 data were used in this study. In addition, T1-weighted (T1w) data were used for the expert judgment experiment, as the RGVP is more visually apparent on T1.For each subject, four tractography methods were used for reconstruction of the RGVP. Tractography was seeded from all voxels within a mask, which was larger than the possible region through which the RGVP passes. High-performing tractography parameter combinations for each method were identified according to their ability to track the four RGVP subdivisions. Then, the RGVP was selected from the seeded tractography data for each compared tractography method using region-of-interest (ROI) based selection. Here, five ROIs were drawn by an expert (G.X.) for each subject (shown in Figure 1).
To compare the RGVP results, a comprehensive quantitative and expert judgment experiment was performed. Quantitative evaluation included the reconstruction rate of the four anatomical subdivisions and the percentage of decussating fibers. For both experiments, a one-way repeated measures analysis of variance (ANOVA) was applied across the four methods to determine whether they were statistically different. For the expert judgment experiment, an expert rater (S.Y.) visually checked each RGVP tract by overlaying it on the structural T1w image using the SlicerDMRI extension 14,15 in 3D Slicer 16. The expert was asked to rank the four reconstructions based on his judgment, where a rank of 1 was the best and 4 was the worst.
Results
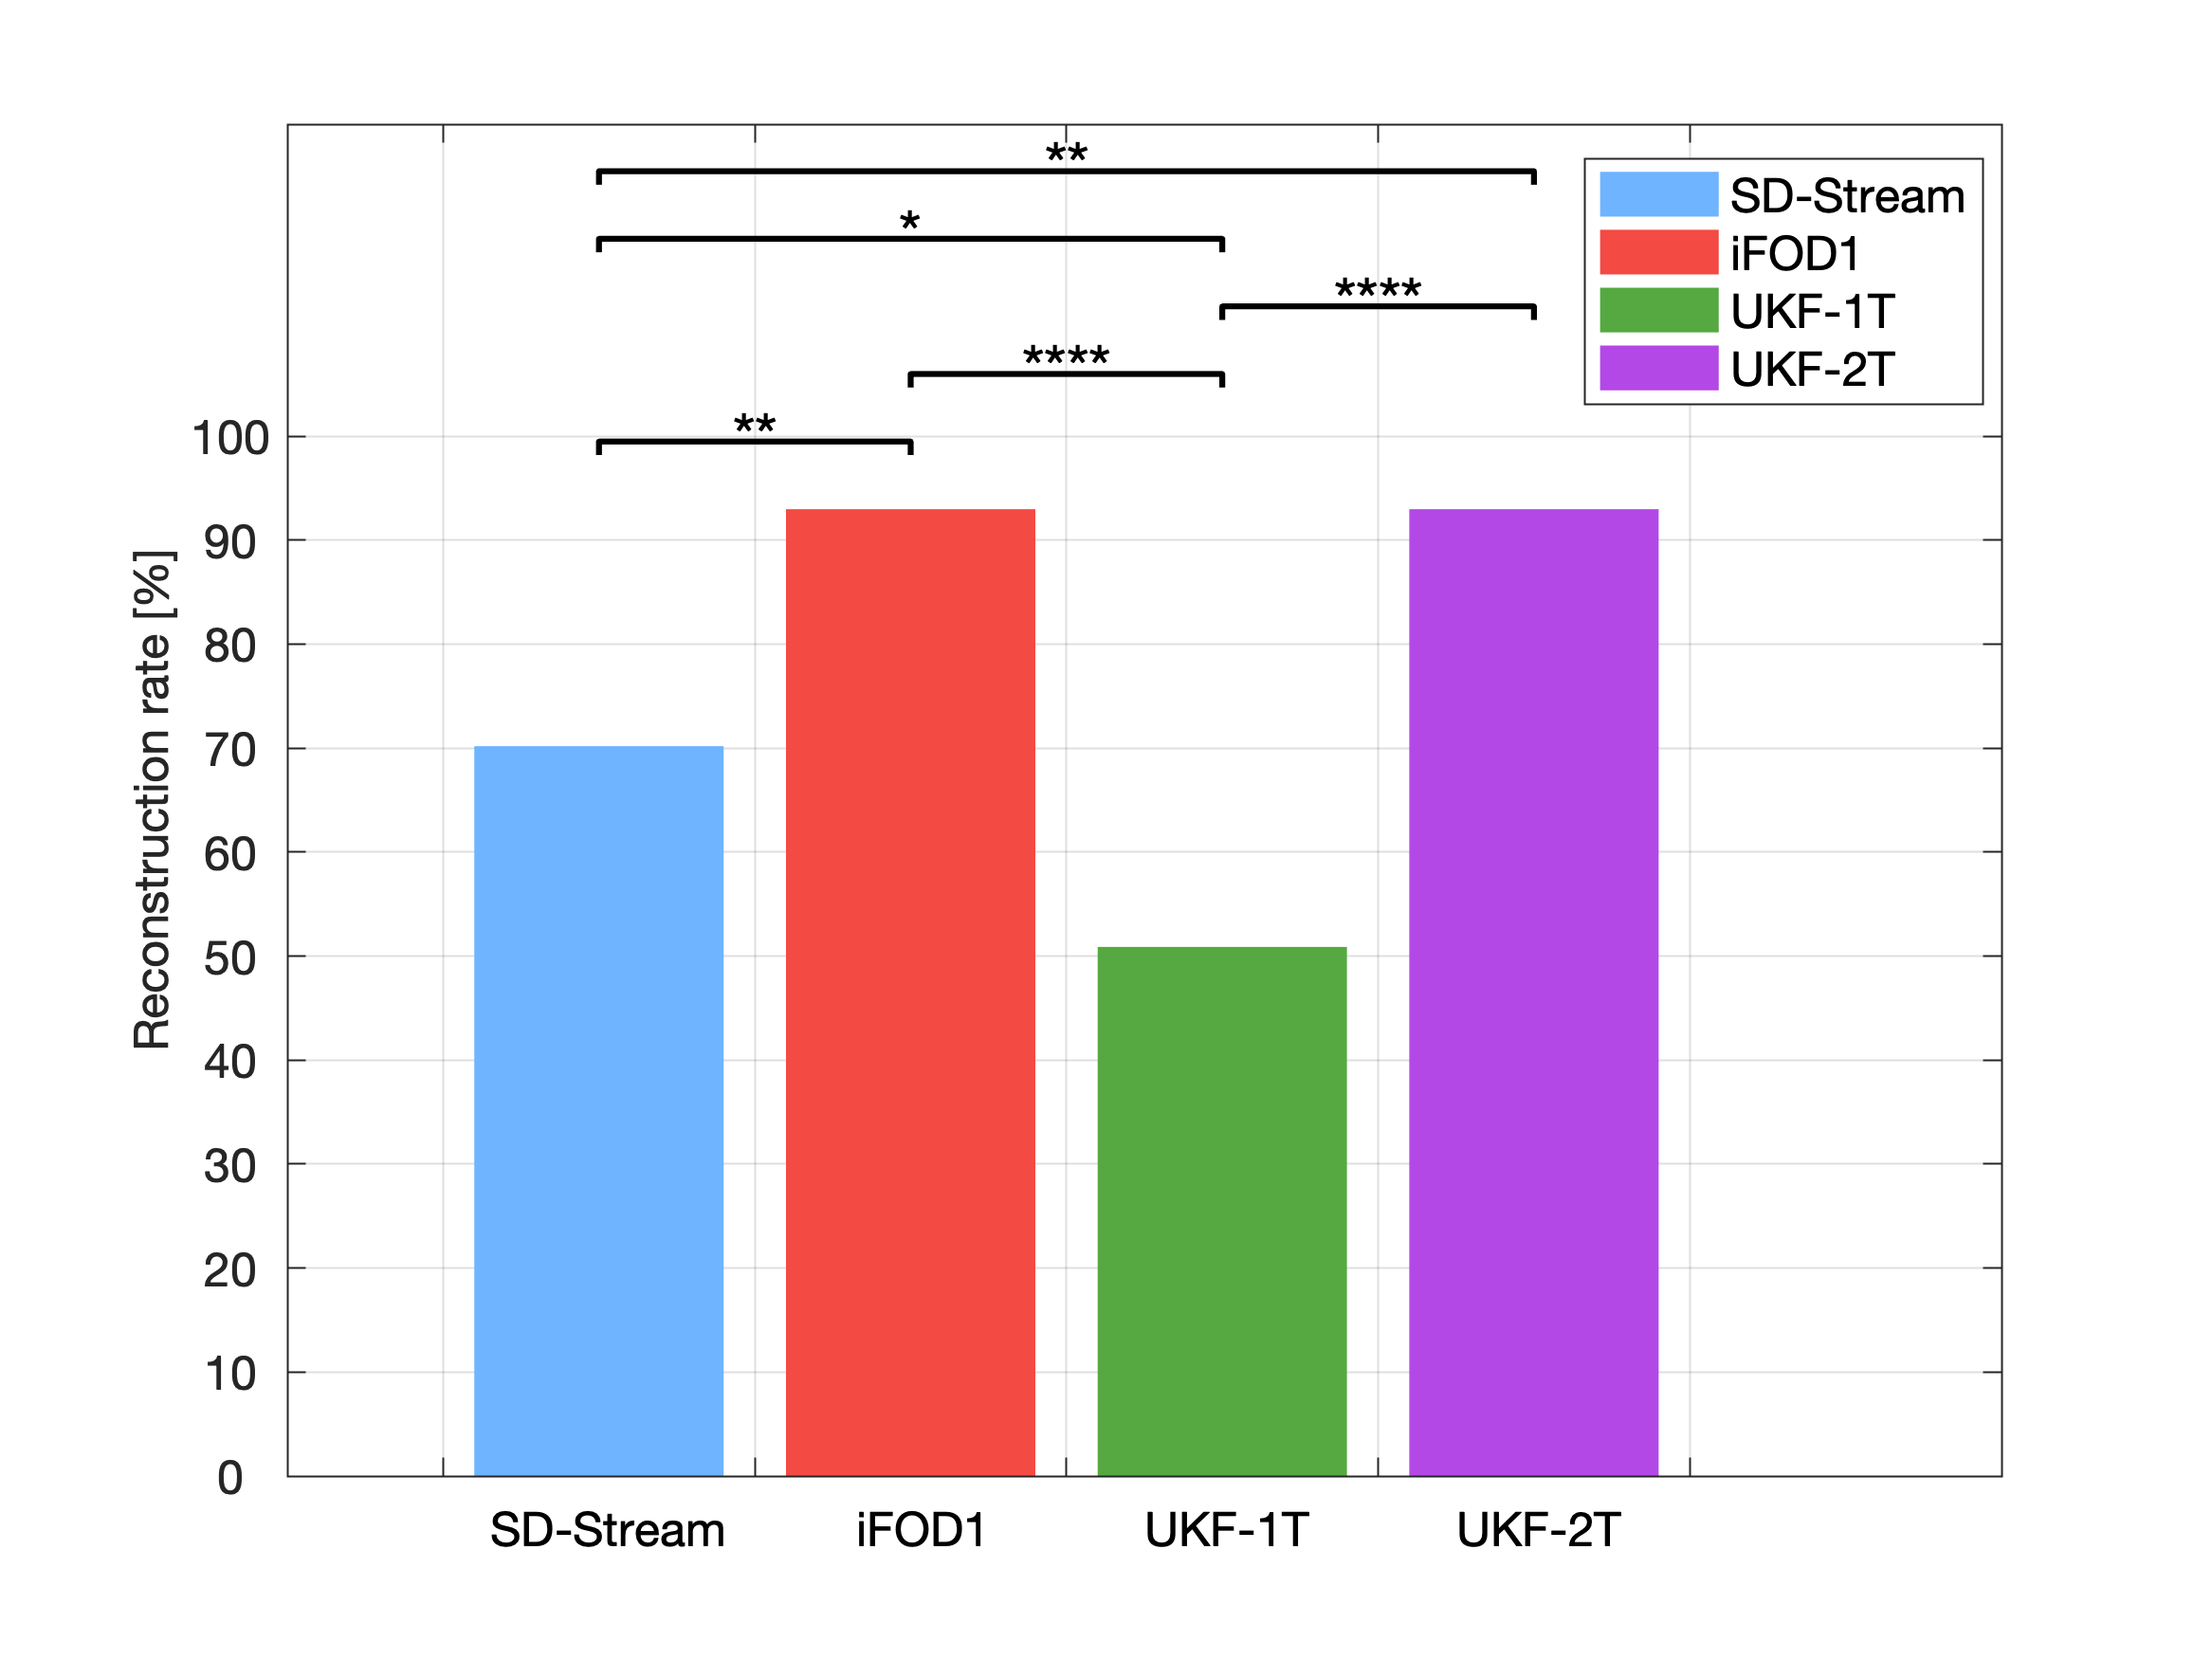
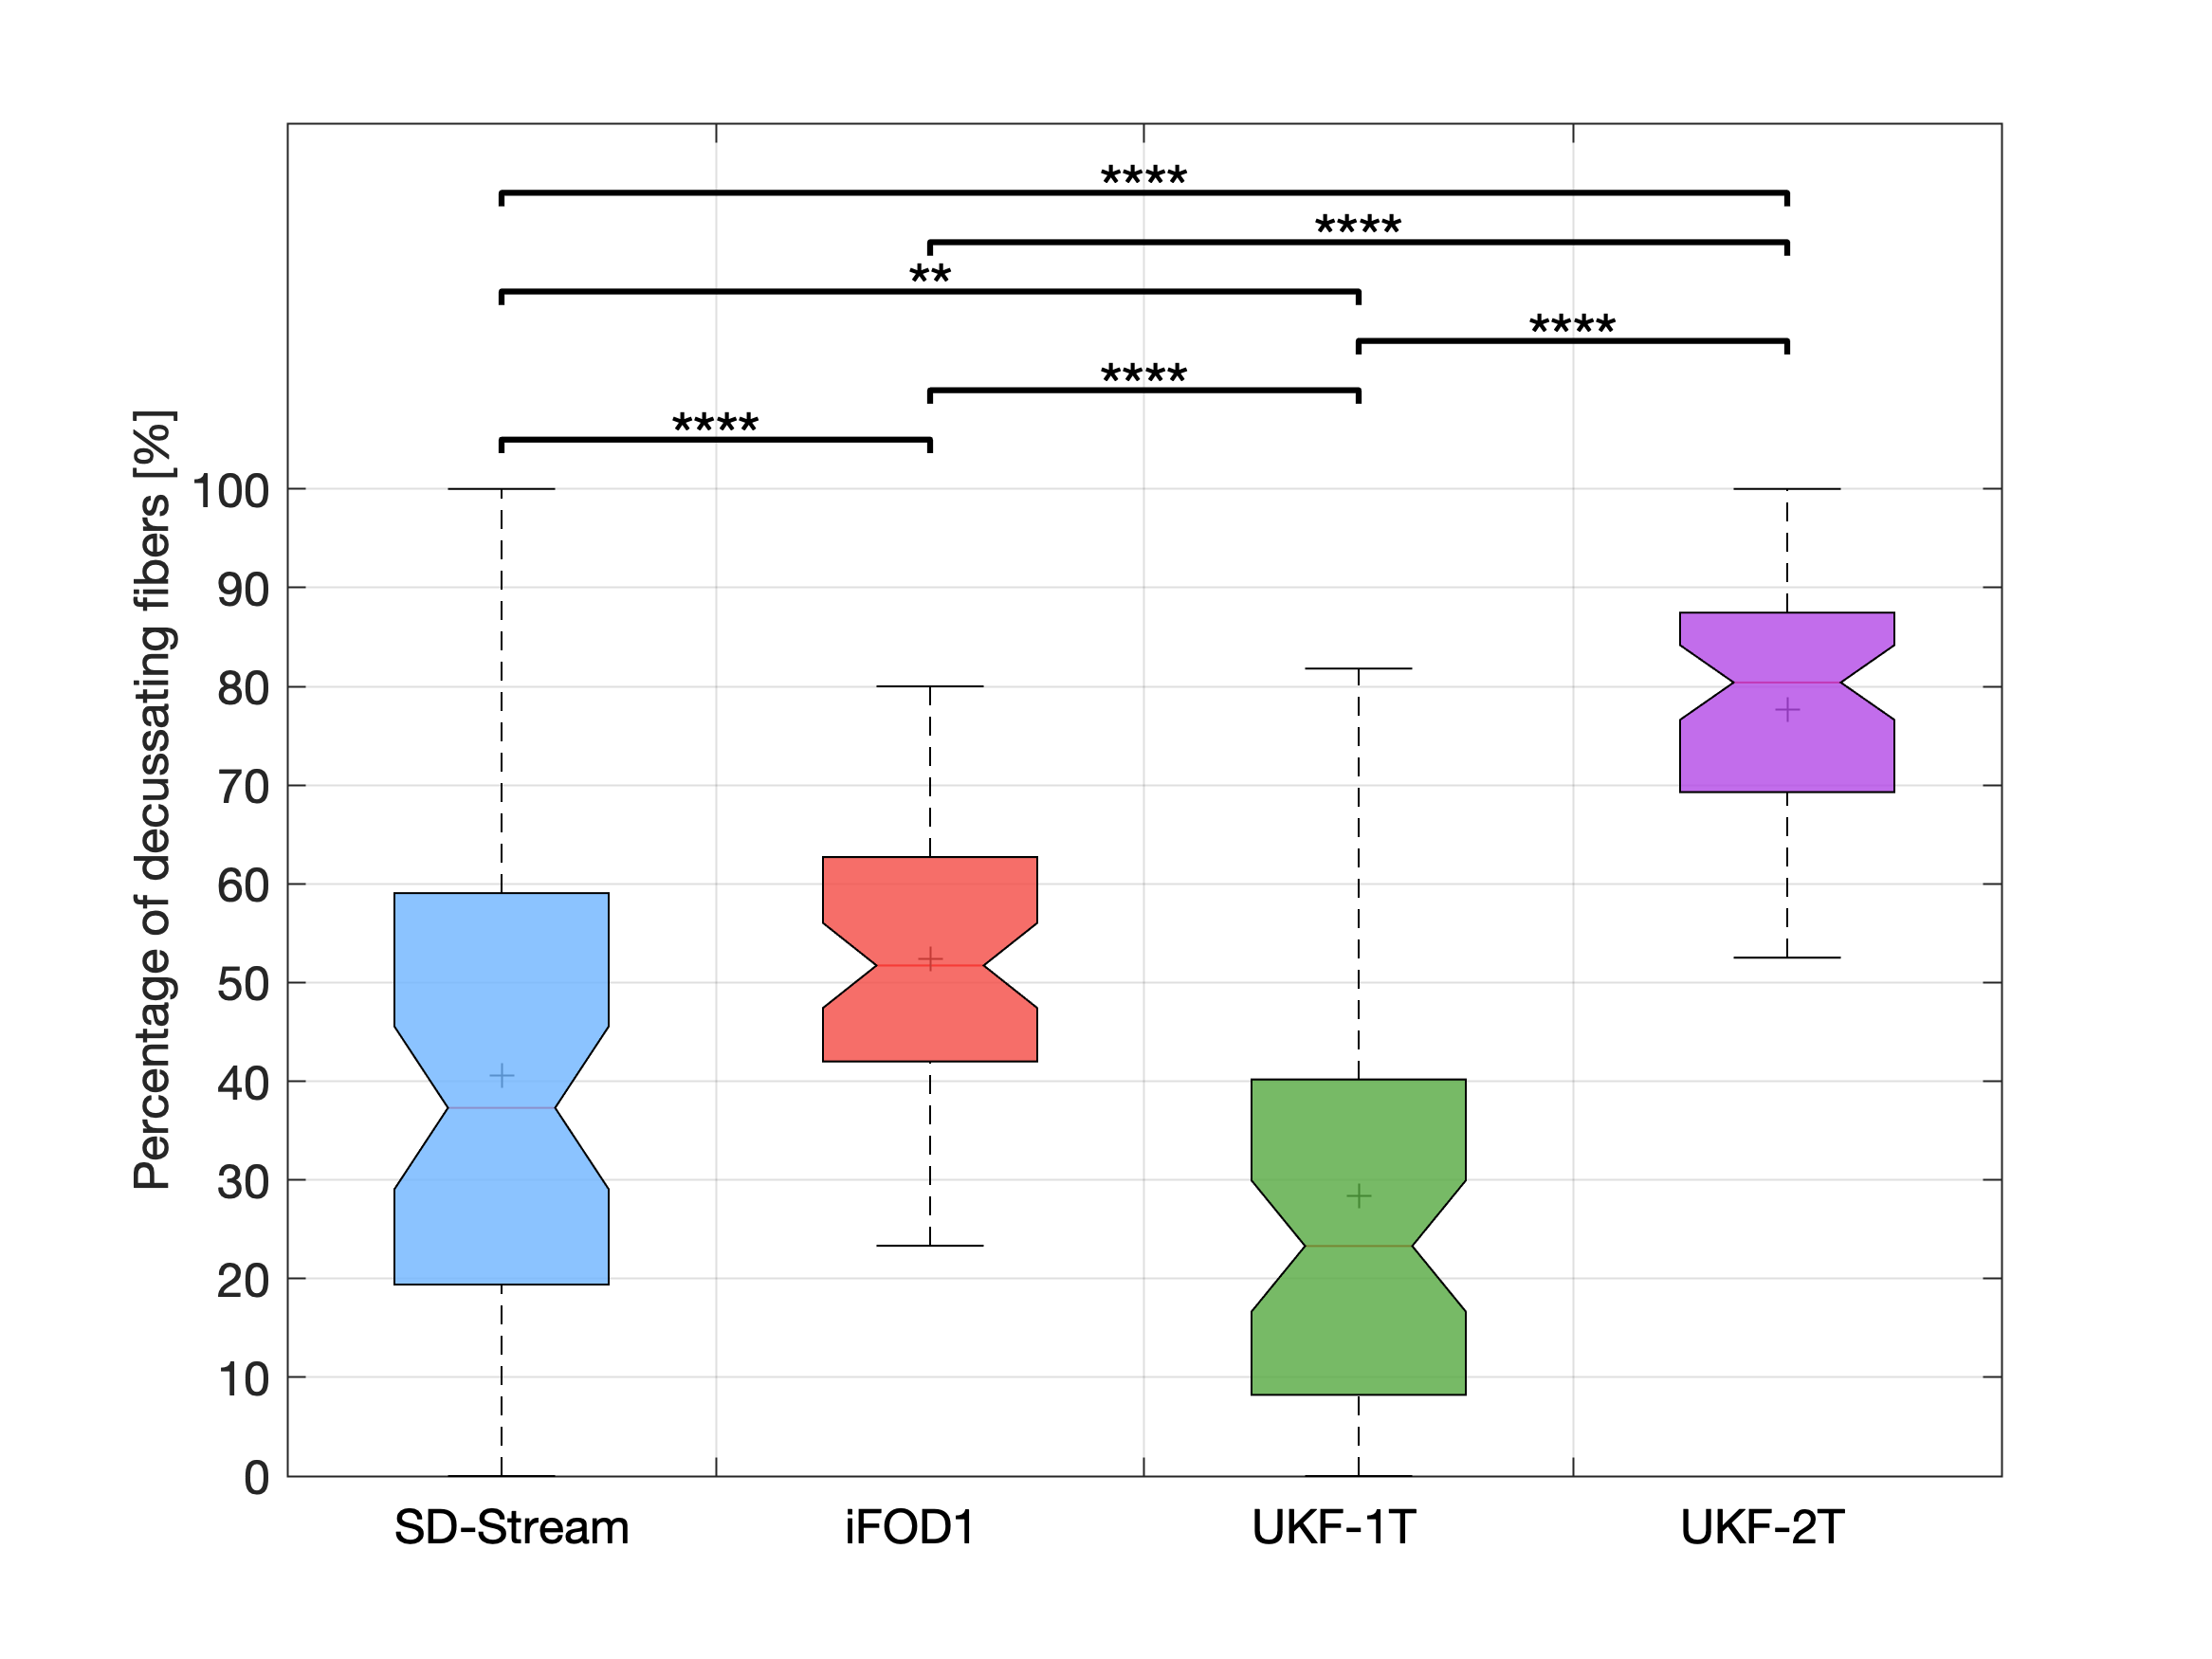
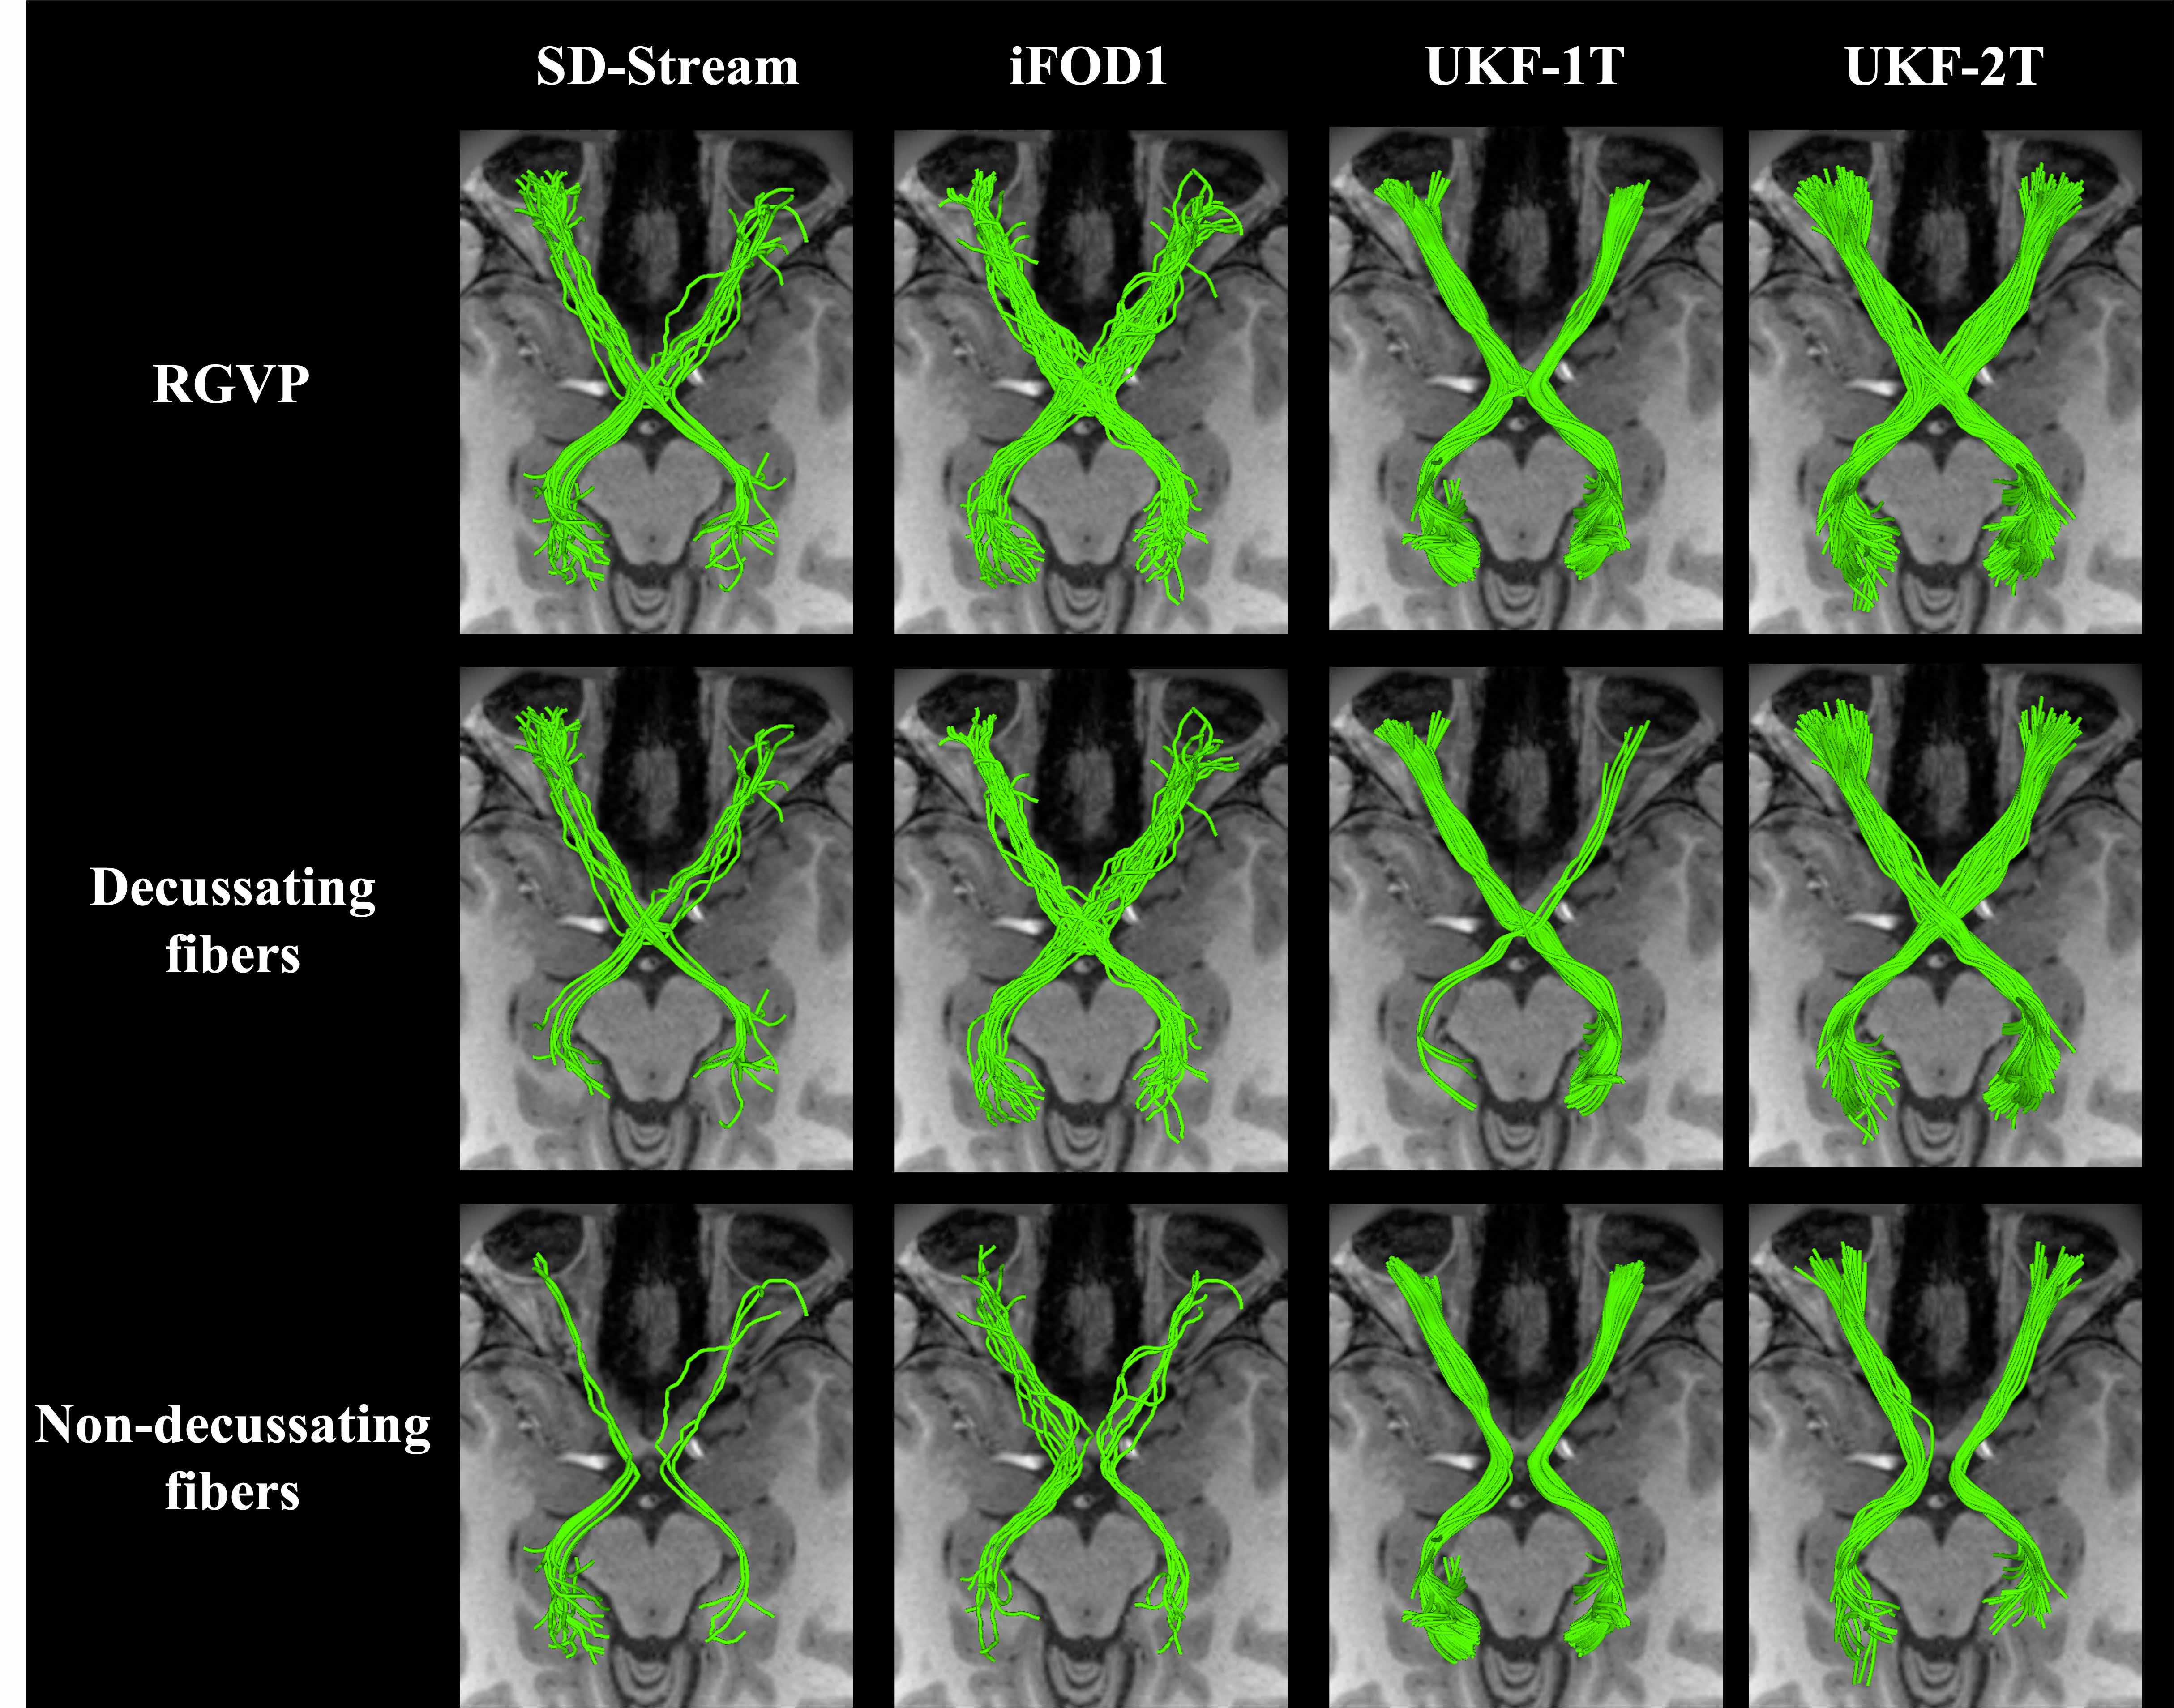
Figure 2 shows the overall reconstruction rate of the RGVP across all subjects. UKF-2T and iFOD1 generated the highest rates. The overall reconstruction rates were significantly different across the four methods. Post-hoc paired t-tests (with FDR correction) showed that there were no significant differences only between UKF-2T and iFOD1. Figure 3 gives the results for the percentage of decussating fibers obtained by each tractography method. The decussating percentages of UKF-2T and iFOD1 are higher than 50%, while the decussating percentages of SD-Stream and UKF-1T are lower than 50%.Figure 4 gives a visual comparison of the RGVP results using different tractography methods. In general, the SD-Stream and iFOD1 methods generated a large number of visually apparent false positive fibers, while the UKF tractography methods generated more anatomically plausible RGVP fibers, corresponding to the RGVP as appearing on the T1w image. The averaged ranking scores of the SD-Stream, iFOD1, UKF-1T, and UKF-2T methods were 3.23±0.74, 2.82±0.72, 2.52±1.33, and 1.34±0.51, respectively.
Discussion
Overall, we have two main observations. First, across the four compared methods, we found that UKF-2T and iFOD1 obtained better performance than UKF-1T and SD-Stream. The RGVP reconstruction rates of UKF-2T and iFOD1 (about 92% in both methods) were significantly higher than UKF-1T and SD-Stream (50.88% and 70.18%, respectively). UKF-2T and iFOD1 also traced more decussating than non-decussating fibers in the optic chiasm, which is consistent with the findings of previous studies 1,17,18. Second, comparing between UKF-2T and iFOD1, the percentage of decussating fibers in the iFOD1 method (52.36%) was more similar to the reported range in the previous studies (approximately 53% to 58%), while the UKF-2T method obtained visually better RGVP pathways as appearing on the T1w image and got the best expert judgment score.Conclusion
Overall, we found that the UKF-2T and the iFOD1 obtained the best results, showing highly successful performance to identify the four major subdivisions of the RGVP. The iFOD1 method can better quantitatively estimate the percentage of decussating fibers, while the UKF-2T method produces reconstructed RGVPs that are judged to better correspond to known anatomy.Acknowledgements
NIH P41EB015902;NIH P41EB015898; NIH R01MH074794; NIH R01MH111917; NIH R01MH119222; NIH R01CA235589; NIH HHSN261200800001E; NIH HHSN26100071; NIH U01CA199459; Key Research & Development Project of Zhejiang Province grant: 2020C03070; Major Science and Technology Projects of Wenzhou: ZS2017007; Chinese Postdoctoral Science Foundation (2019M663271). Jianzhong He was supported by a scholarship from the China Scholarship Council (CSC).References
1. Kupfer C, Chumbley L, Downer JC. Quantitative histology of optic nerve, optic tract and lateral geniculate nucleus of man. J Anat. 1967;101: 393–401.
2. Laws ER Jr, Trautmann JC, Hollenhorst RW Jr. Transsphenoidal decompression of the optic nerve and chiasm. Visual results in 62 patients. J Neurosurg. 1977;46: 717–722.
3. Rucker CW, Kernohan JW. Notching of the optic chiasm by overlying arteries in pituitary tumors. AMA Arch Ophthalmol. 1954;51: 161–170.
4. Hales PW, Smith V, Dhanoa-Hayre D, O’Hare P, Mankad K, d’Arco F, et al. Delineation of the visual pathway in paediatric optic pathway glioma patients using probabilistic tractography, and correlations with visual acuity. Neuroimage Clin. 2018;17: 541–548.
5. Beck RW, Trobe JD, Moke PS, Gal RL, Xing D, Bhatti MT, et al. High-and low-risk profiles for the development of multiple sclerosis within 10 years after optic neuritis: experience of the optic neuritis treatment trial. Arch Ophthal. 2003;121: 944–949.
6. Tournier J-D, Calamante F, Connelly A. MRtrix: diffusion tractography in crossing fiber regions. Int J Imaging Syst Technol. 2012;22: 53–66.
7. Attyé A, Jean C, Remond P, Peyrin C, Lecler A, Boudiaf N, et al. Track-weighted imaging for neuroretina: Evaluations in healthy volunteers and ischemic optic neuropathy. J Magn Reson Imaging. 2018;48: 737–747.
8. Miller N, Liu Y, Krivochenitser R, Rokers B. Linking neural and clinical measures of glaucoma with diffusion magnetic resonance imaging (dMRI). PLoS One. 2019;14: e0217011.
9. Hofstetter S, Sabbah N, Mohand-Saïd S, Sahel J-A, Habas C, Safran AB, et al. The development of white matter structural changes during the process of deterioration of the visual field. Sci Rep. 2019;9: 2085.
10. Malcolm JG, Shenton ME, Rathi Y. Neural tractography using an unscented Kalman filter. Inf Process Med Imaging. 2009;21: 126–138.
11. Xie G, Zhang F, Leung L, Mooney MA, Epprecht L, Norton I, et al. Anatomical assessment of trigeminal nerve tractography using diffusion MRI: a comparison of acquisition b-values and single- and multi-fiber tracking strategies. NeuroImage:Clinical. 2020;25: 102160.
12. Zhang F, Xie G, Leung L, Mooney MA, Epprecht L, Norton I, et al. Creation of a novel trigeminal tractography atlas for automated trigeminal nerve identification. Neuroimage. 2020;220: 117063.
13. Van Essen DC, Smith SM, Barch DM, Behrens TEJ, Yacoub E, Ugurbil K, et al. The WU-Minn Human Connectome Project: an overview. Neuroimage. 2013;80: 62–79.
14. Zhang F, Noh T, Juvekar P, Frisken SF, Rigolo L, Norton I, et al. SlicerDMRI: Diffusion MRI and Tractography Research Software for Brain Cancer Surgery Planning and Visualization. JCO Clin Cancer Inform. 2020;4: 299–309.
15. Norton I, Essayed WI, Zhang F, Pujol S, Yarmarkovich A, Golby AJ, et al. SlicerDMRI: Open Source Diffusion MRI Software for Brain Cancer Research. Cancer Res. 2017;77: e101–e103.
16. Pieper S, Halle M, Kikinis R. 3D Slicer. 2004 2nd IEEE International Symposium on Biomedical Imaging: Nano to Macro (IEEE Cat No 04EX821). 2004. pp. 632–635 Vol. 1.
17. v. Sántha K. Über das Verhalten der primären optischen Zentren bei einseitiger peripherer Blindheit. Albrecht von Graefes Archiv für Ophthalmologie. 1932;129: 224–237.
18. Chacko LW. The laminar pattern of the lateral geniculate body in the primates. J Neurol Neurosurg Psychiatry. 1948;11: 211–224.
Figures