4316
Patient specific tracts-based analysis of diffusion compartment models: application to multiple sclerosis patients with acute optic neuritis
Olivier Commowick1, Renaud Hédouin1, Charlotte Laurent2, and Jean-Christophe Ferré1,3
1Univ Rennes, Inria, CNRS, Inserm, IRISA UMR 6074, Empenn - ERL U1228, Rennes, France, 2Ophthalmology department, CHU Rennes, Rennes, France, 3Radiology department, CHU Rennes, Rennes, France
1Univ Rennes, Inria, CNRS, Inserm, IRISA UMR 6074, Empenn - ERL U1228, Rennes, France, 2Ophthalmology department, CHU Rennes, Rennes, France, 3Radiology department, CHU Rennes, Rennes, France
Synopsis
Multiple sclerosis is a complex disease where voxel-based, group-based statistics of the brain microstructure have shown their limits in explaining patient evolution. This is first due to too simple diffusion models, mixing information. Voxel-based studies also lack knowledge on brain structural connectivity. Finally, group-based analysis does not describe well the specific patient status (a crucial point for clinicians). We propose an atlas-based framework, combined with advanced diffusion compartment models, for patient specific analysis of microstructural disease burden on major fiber bundles. We apply our framework to the analysis of optic radiations of MS patients with acute optic neuritis.
Introduction
Multiple sclerosis (MS) is a complex disease1 still not well understood. While MRI plays an important role in its diagnosis2, there is still a clinical-radiological paradox3,4 in which handicap scores evolution is not correlated with MRI observations. This may come from the fact that the explored measures are not specific enough: all lesions are not equivalent depending on their position with respect to major fiber bundles and on the severity of the microstructural damage. To investigate this aspect, many studies have looked at diffusion MRI for its potential to reveal the brain microstructure [5]. However, diffusion MRI in MS has still not proven efficient yet for patient-specific follow-up. This comes first from the fact that current methodologies are often targeted at group analysis6-9. Another reason is that although several methods have looked at along tract analysis10-12, all methods are most often limited to simple models such as the tensor or to direction-based models that do not incorporate microstructure information. There is thus a need for patient, bundle specific measures of disease burden on directly interpretable parameters of the microstructure.We propose a new framework for patient, bundle specific analysis of microstructural burden of neurodegenerative diseases. To do so, we propose an atlas-based approach to compute microstructural disease burden on major bundles with advanced diffusion compartment models (DCM)13. We evaluate this approach with a proof-of-concept analysis of optic radiations of MS patients with acute optic neuritis14, showing different microstructural burden patterns depending on the patient.
Materials
Data from 22 control subjects and 6 MS patients with acute optic neuritis were acquired on a Siemens 3T Prisma scanner. For each subject, T1 and T2-weighted images (3D isotropic, 1 mm3) were acquired as well as diffusion images with a CUSP sequence15 (6 b0, 60 directions with b-values in between 670 and 2000 s.mm−2, 2x2x2 mm3 voxels). Data were preprocessed to remove distortion using a reversed phase encoding image16 and DCM (three anisotropic tensors plus one free water and one isotropic restricted water compartments13) were estimated17.Methods
The overall pipeline of our method is composed of two parts: an offline part to compute a DCM enriched fiber atlas from controls (Fig. 1) performed once for all patients, and an online part performed for each patient (registration and comparison, Fig. 2).The offline part starts by the construction of a control DCM atlas19. Then, fibers are extracted over the whole atlas21 and filtered using regions obtained through TractSeg20 to get 72 different bundles. These bundles are then enriched with DCM information from each subject of the atlas. To do so, the DCM compartment most collinear to the fiber at a given point is selected and properties from it are extracted: mean diffusivity (MD), fractional anisotropy (FA), parallel and perpendicular diffusivities ($$$d_\parallel$$$, $$$d_\perp$$$); as well as water fractions of isotropic compartments fractions: free (FW) and isotropic restricted water (IRW) fractions.
The online part uses the control atlas as a reference for comparison. The patient DCM image is registered on the atlas18. Along the atlas bundles, information on patient microstructure is extracted from the patient DCM image and a statistical test of abnormality is computed at each point22. After correction for multiple comparisons23, we compute disease burden scores $$$S_{b,p}$$$ for each bundle $$$b$$$ and microstructure property $$$p$$$ illustrating the abnormal fraction of the bundle:
$$S_{b,p} =100 \frac{\sum_{i=1}^M \sum_{j=1}^{N_i} b_{i,j}}{\sum_{i=1}^M N_i}$$
with $$$M$$$ number of fibers in bundle, $$$N_i$$$ number of points in $$$i$$$-th fiber of bundle, $$$b_{i,j} = 1$$$ if the point $$$j$$$ of fiber $$$i$$$ in bundle $$$b$$$ is abnormal (i.e. the statistical test performed on that point indicates a significant difference).
Results
Fig. 3 presents results over the optic radiations of two patients suffering from acute optic neuritis related to MS, for two different microstructure parameters. It illustrates well the abnormalities that may be seen in those two patients, closely related to the presence of lesions. However the lesions seem to create different microstructural damage. This can be seen from Tables 1 and 2 where disease burden scores are higher for $$$d_\perp$$$ and MD for patient 4, whereas it is higher for FW for patient 6. Moreover, at the time of acute optic neuritis, the higher disease scores for those two patients do not seem to be linked to the side of optic neuritis. No burden score is indeed above 10% on the right optic radiations.Discussion and conclusion
We have proposed a new framework for the patient specific analysis of fiber bundles microstructural damage linked to a disease. We have derived the whole pipeline based on advanced compartment models of diffusion, enabling the in-depth study of microstructural damage along major fiber tracts. Applied to MS patients suffering from acute optic neuritis, we have highlighted differences located primarily inside lesions but showing different microstructural differences depending on the patient, in line with the high variability of the disease. The code for this framework is available open-source24. Further works will study the influence of registration on the results, especially the need or not for advanced diffusion images registration; as well as other disease burden scores based on individual comparisons and their correlation with handicap scores.Acknowledgements
This study was partially funded by grants from the VISIO foundation and the ARSEP (aide à la recherche sur la sclérose en plaques) foundation.References
- Fred D. Lublin, Stephen C. Reingold, Jeffrey A. Cohen, Gary R. Cutter, Per Soelberg Sorensen, Alan J. Thompson, Jerry S. Wolinsky, Laura J. Balcer, Brenda Banwell, Fred- erik Barkhof, Bruce Bebo, Peter A. Calabresi, Michel Clanet, Giancarlo Comi, Robert J. Fox, Mark S. Freedman, Andrew D. Goodman, Matilde Inglese, Ludwig Kappos, Bernd C. Kieseier, John A. Lincoln, Catherine Lubetzki, Aaron E. Miller, Xavier Montalban, Paul W. O’Connor, John Petkau, Carlo Pozzilli, Richard A. Rudick, Maria Pia Sormani, Olaf St??ve, Emmanuelle Waubant, and Chris H. Polman. Defining the clinical course of multiple sclerosis: The 2013 revisions. Neurology, 83(3):278–286, 2014.
- Alan J Thompson, Brenda L Banwell, Frederik Barkhof, William M Carroll, Timothy Coetzee, Giancarlo Comi, Jorge Correale, Franz Fazekas, Massimo Filippi, Mark S Freedman, Kazuo Fujihara, Steven L Galetta, Hans Peter Hartung, Ludwig Kappos, Fred D Lublin, Ruth Ann Marrie, Aaron E Miller, David H Miller, Xavier Montalban, Ellen M Mowry, Per Soelberg Sorensen, Mar Tintoré, Anthony L Traboulsee, Maria Trojano, Bernard M J Uitdehaag, Sandra Vukusic, Emmanuelle Waubant, Brian G Weinshenker, Stephen C Reingold, and Jeffrey A Cohen. Diagnosis of multiple sclerosis: 2017 revisions of the McDonald criteria. The Lancet Neurology, 17(2):162–173, 2018.
- Brian C. Healy, Guy J. Buckle, Eman N. Ali, Svetlana Egorova, Fariha Khalid, Shahamat Tauhid, Bonnie I. Glanz, Tanuja Chitnis, Charles R.G. Guttmann, Howard L. Weiner, and Rohit Bakshi. Characterizing clinical and MRI dissociation in patients with multiple sclerosis. Journal of Neuroimaging, 27(5):481–485, 2017.
- F. Barkhof. The clinico-radiological paradox in multiple sclerosis revisited. Current opinion in neurology, 15(3):239–245, 2002.
- M. Filippi, M. Cercignani, M. Inglese, and M.A. Horsfieldand G. Comi. Diffusion tensor magnetic resonance imaging in multiple sclerosis. Neurology, 56:304–311, 2001.
- Natasha Lepore, Caroline A. Brun, Yi-Yu Chou, Ming-Chang Chiang, and et al. Generalized tensor-based morphometry of HIV/AIDS using multivariate statistics on deformation tensors. IEEE Transactions on Medical Imaging, 27(1):129–141, 2008.
- M. Rovaris, A. Gass, R. Bammer, S.J.Hickman, O. Ciccarelli, D.H. Miller, and M. Filippi. Diffusion MRI in multiple sclerosis. Neurology, 65(10):1526–1532, 2005.
- Brandon Whitcher, Jonathan J. Wisco, Nouchine Hadjikhani, and David S. Tuch. Statistical group comparison of diffusion tensors via multivariate hypothesis testing. Magnetic Resonance in Medicine, 57:1065–1074, 2007.
- David A. Raffelt, J.-Donald Tournier, Robert E. Smith, David N. Vaughan, Graeme Jack- son, Gerard R. Ridgway, and Alan Connelly. Investigating white matter fibre density and morphology using fixel-based analysis. NeuroImage, 144:58 – 73, 2017.
- Stephen M. Smith, Mark Jenkinson, Heidi Johansen-Berg, Daniel Rueckert, Thomas E. Nichols, Clare E. Mackay, Kate E. Watkins, Olga Ciccarelli, M. Zaheer Cader, Paul M. Matthews, and Timothy E.J. Behrens. Tract-based spatial statistics: Voxelwise analysis of multi-subject diffusion data. NeuroImage, 31(4):1487 – 1505, 2006.
- Maxime Chamberland, Mia Winter, Thomas Brice, Derek K. Jones, and Emma Tallantyre. Beyond lesion-load: Tractometry-based metrics for characterizing white matter lesions within fibre pathways. In MICCAI 2020 - International Workshop on Computational Diffusion MRI, 2020.
- Maxime Chamberland, Sila Genc, Erika P. Raven, Greg D. Parker, Adam Cunningham, Joanne Doherty, Marianne van den Bree, Chantal M. W. Tax, and Derek K. Jones. Tractometry-based anomaly detection for single-subject white matter analysis. In Medical Imaging with Deep Learning, 2020.
- E. Panagiotaki, T. Schneider, et al. Compartment models of the diffusion MR signal in brain white matter: a taxonomy and comparison. Neuroimage, 59(3):2241–2254, 2012.
- N.R. Miller, N.J. Newman, V. Biousse, and J.B. Kerrison. Walsh and Hoyt’s clinical neuro- ophthalmology. Lippincott Williams & Wilkins, 2004.
- Benoit Scherrer and Simon K. Warfield. Parametric representation of multiple white matter fascicles from cube and sphere diffusion MRI. PLOS ONE, 7(11):1–20, 11 2012.
- R. Hédouin, O. Commowick, E. Bannier, B. Scherrer, M. Taquet, S. K. Warfield, and C. Barillot. Block-matching distortion correction of echo-planar images with opposite phase encoding directions. IEEE Transactions on Medical Imaging, 36(5):1106–1115, 2017.
- Aymeric Stamm, Olivier Commowick, Simon K. Warfield, and S. Vantini. Comprehensive maximum likelihood estimation of diffusion compartment models towards reliable mapping of brain microstructure. In Medical Image Computing and Computer-Assisted Intervention - MICCAI, pages 622–630, 2016.
- R.O. Suarez, O. Commowick, et al. Automated delineation of white matter fiber tracts with a multiple region-of-interest approach. Neuroimage, 59(4):3690–3700, February 2012.
- Alexandre Guimond, Jean Meunier, and Jean-Philippe Thirion. Average brain models: A convergence study. Computer Vision and Image Understanding, 77(2):192 – 210, 2000.
- Jakob Wasserthal, Peter Neher, and Klaus H. Maier-Hein. Tractseg - fast and accurate white matter tract segmentation. NeuroImage, 183:239 – 253, 2018.
- D. Weinstein, G. Kindlmann, and E. Lundberg. Tensorlines: advection-diffusion based prop- agation through diffusion tensor fields. In Proceedings Visualization ’99, pages 249–530, 1999.
- O. Commowick, A. Maarouf, et al. Diffusion MRI abnormalities detection with orientation distribution functions: A multiple sclerosis longitudinal study. MedIA, 22(1):114–123, May 2015.
- Y Benjamini and Y Hochberg. Controlling the false discovery rate: A practical and powerful approach to multiple testing. J. of the Royal Stat Society. Series B (Methodological), 57(1):289–300, 1995.
- Inria Empenn team. Anima software - RRID:SCR_017072, https://anima.irisa.fr
Figures
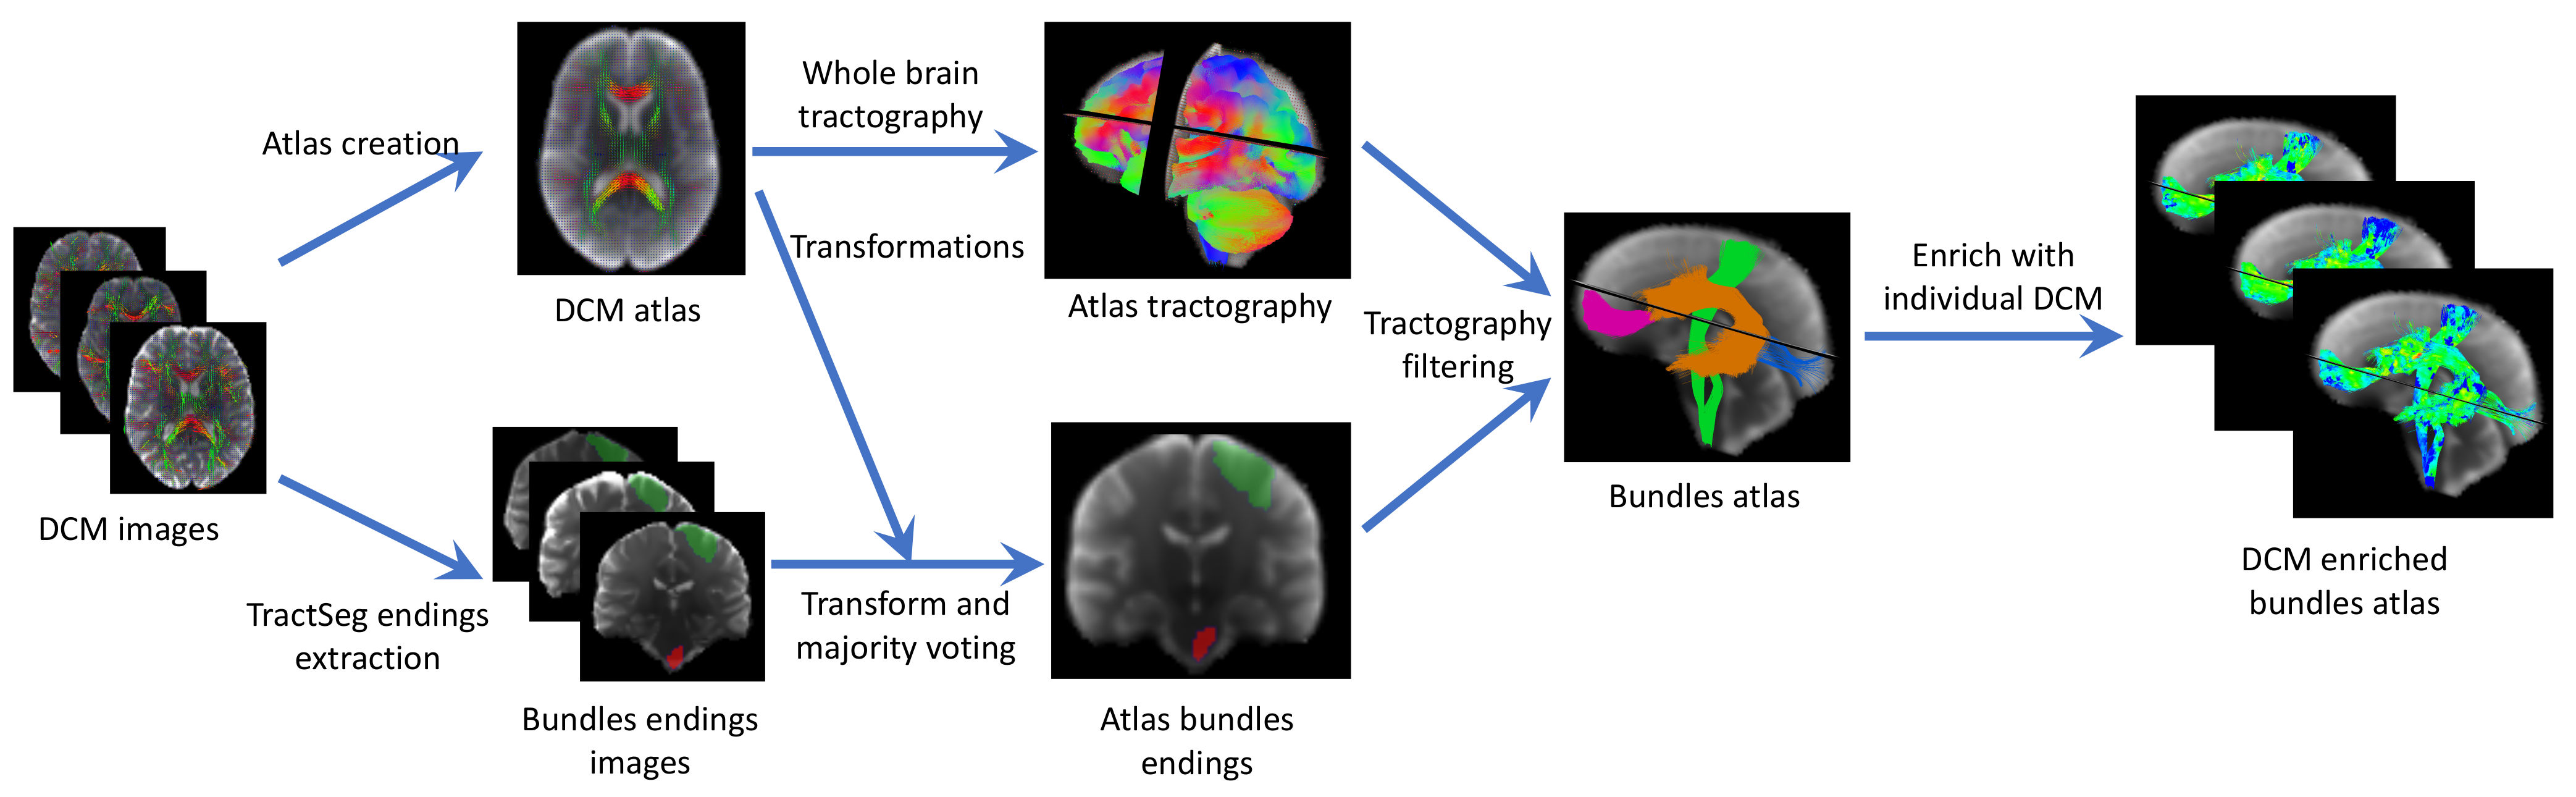
Figure 1:
DCM enriched fiber atlas creation pipeline. From DCM images of controls, an atlas
is created using tensor registration18 and an unbias atlas creation19. At the same time,
TractSeg20 is used to get bundles endings segmentations on each subject. These endings are then
merged onto the atlas using majority voting. They are then used together with tractography21
to get the major bundles on the atlas. Finally, the bundles are enriched with microstructural
information along tracts extracted from DCM.
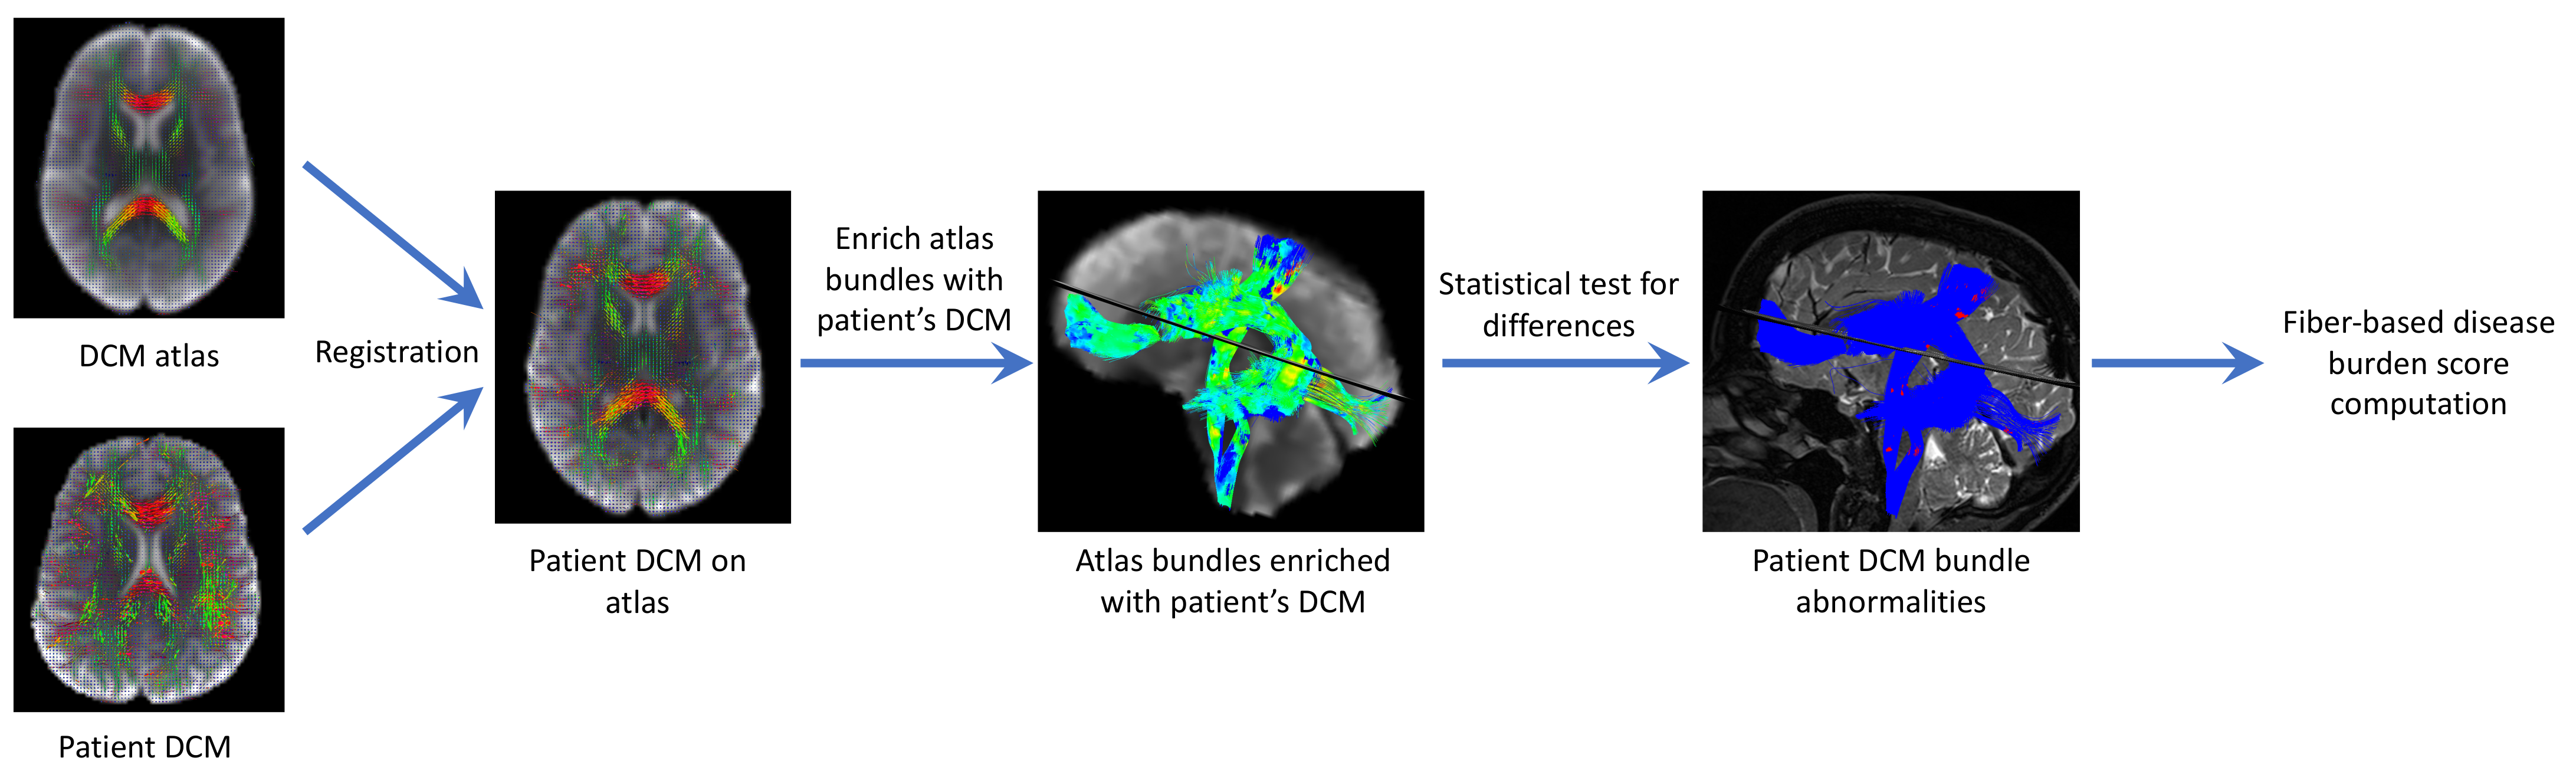
Figure 2:
Fiber-specific disease burden computation for a patient DCM image. From the controls
atlas and the DCM image of the patient, the patient is first registered on the atlas18. Then,
the bundles of the atlas are enriched with microstructural information from the patient DCM
image. Statistical tests22 are performed at each fiber point to compare the patient’s along fiber
microstructure to the controls. After correction for multiple comparisons23, disease burden
scores are computed for each bundle illustrating its level of abnormality for a given microstructure
parameter.
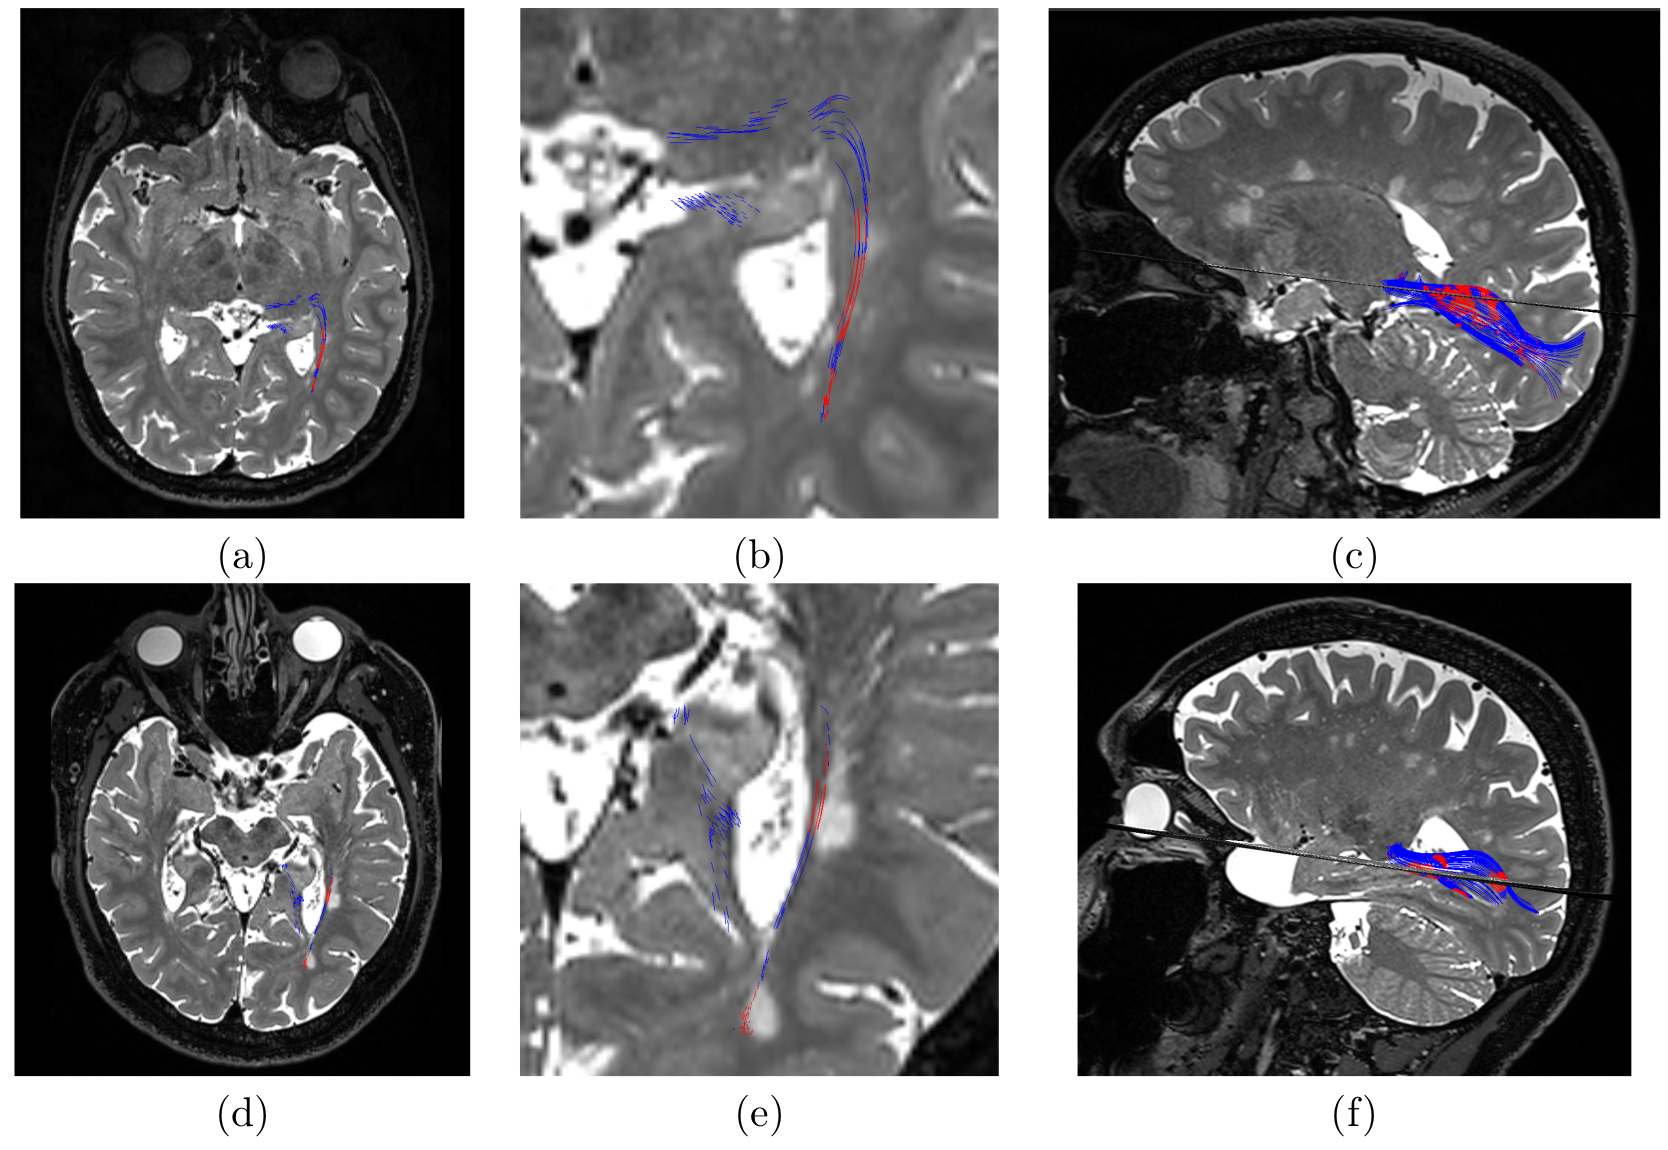
Figure 3:
Results on two MS patients for two different microstructural properties. First line:
patient 4 MD abnormalities along tracts. Second line: patient 6 FW abnormalities along tracts.
(a,d): Axial view superimposing T2-weighted image and colored tracts, (b,e): zoom on the left
optic radiation area, (c,f): 3D view of the T2-weighted image and colored optic radiations. On all
images, red is a local significantly different abnormality, while blue is not.
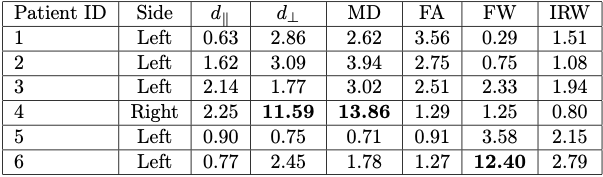
Table 1:
Disease burden scores on left optic radiations for several along fiber microstructural
properties: $$$d_\parallel$$$: parallel diffusivity, $$$d_\perp$$$: perpendicular diffusivity, MD: mean diffusivity, FA: fractional anisotropy, FW: free water fraction, IRW: isotropic restricted
water fraction. Bold numbers
denote burden scores above 10%.
Side denotes which optic nerve suffers from optic neuritis.
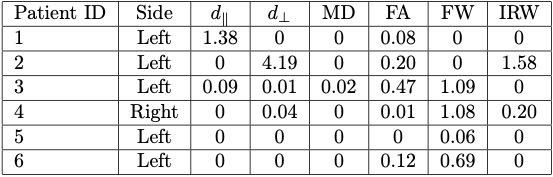
Table 2:
Disease burden scores on right optic radiations for several along fiber microstructural
properties: $$$d_\parallel$$$: parallel diffusivity, $$$d_\perp$$$: perpendicular diffusivity, MD: mean diffusivity, FA: fractional anisotropy, FW: free water fraction, IRW: isotropic restricted water fraction. No burden
scores are above 10%.
Side denotes which optic nerve suffers from optic neuritis.