4314
Mapping white matter bundle tracts and cortical myelin from multi-contrast imaging in the awake macaque monkey1Functional Imaging Laboratory, German Primate Center, Göttingen, Germany, 2Georg August Universität Göttingen, Göttingen, Germany, 3Biosciences Institute, Newcastle University, Newcastle upon Tyne, United Kingdom, 4Faculty of Science and Medicine, University of Fribourg, Fribourg, Switzerland
Synopsis
In-vivo whole-brain multi-contrast awake imaging enables the detection of structural and functional features in brain networks without anesthesia. In this work, we demonstrated the feasibility and robustness of multi-contrast MRI data acquisitions across sessions and subjects in awake macaque monkeys.
Introduction
The macaque monkey model has contributed significantly to mapping the human brain connectome by providing means to validate in-vivo neuroimaging measures of microstructure and tractography2 with the more establish ex-vivo cytoarchitectonic and tract-tracing anatomical methods5. For in-vivo white matter tractography based on diffusion-weighted imaging (DWI), most of the focus in the macaque has been towards increasing the number of imaging directions to better resolve the white matter fiber tracts8 at the cost of an increase in acquisition time. However, for acquiring multi-contrast scans on anesthetized macaques, the required increase in imaging time becomes challenging for repeated multiple measures in the long-term. Here, we take advantage of our recent progress in non-human primate (NHP) imaging for scanning alert non-anesthetized macaque monkeys7 and acquired multi-contrast datasets based on T1-weighted (T1w), T2-weighted (T2w), and DWI over three years. We calculated an average volume for each contrast type and subject. From the DWI data, we then mapped white matter bundles tracts using probabilistic tractography. From the T1w and T2w average volume, we additionally mapped the regional pattern of cortical myelination based on the ratio between the two contrast types6.Methods
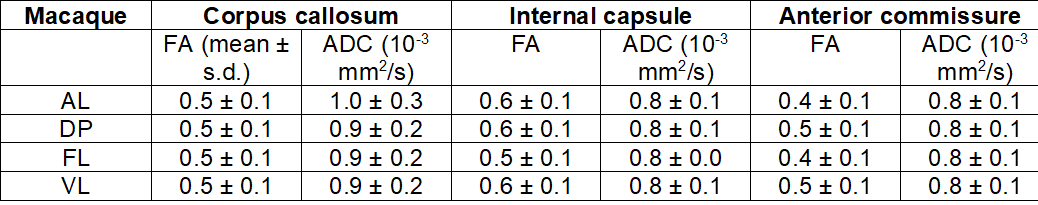
Data Acquisition: Four healthy female rhesus macaques (Macaca mulatta) with a mean age of 3 - 4 years were included in the present study. MRI acquisitions were carried out using a 4.7 T scanner (Bruker BioSpin, Germany) equipped with a four-channel phased array coil. T1w images were acquired using an MDEFT sequence with echo time/repetition time (TE/TR) of 3.9/2000 ms, an inversion time (TI) of 750 ms, a flip angle (FA) of 30˚, and a spatial resolution of 0.6 x 0.6 x 0.6 mm3. T2w data were acquired using a RARE sequence with TE/TR of 14/12,300 ms and a spatial resolution = 0.6 x 0.6 x 0.6 mm3. DWI data were acquired using diffusion-weighted spin-echo (Dw-SE-EPI) sequence1 with 1 mm isotropic resolution, five repetitions, a B-value of 850 s/mm2, 4 B0 images, and 60 diffusion gradient directions.Data Analysis: T1w and T2w volumes were linearly registered to the corresponding contrasts-specific first session volume. All in-session were then averaged to form a contrast-specific subject T1w and T2w volume. DWI data were denoise, eddy current corrected, and motion-corrected for every single in-session dataset. All DWI sessions were then linearly registered to form a subject DWI average volume. The subject-specific average T2w and DWI volumes were linearly registered to the same subject's T1w average, allowing us to register all data to the same D99 atlas template space. A diffusion tensor (DTI) model was fitted to the pre-processed subject DWI data for calculating fractional anisotropy (FA) and apparent diffusion coefficient (ADC) maps4. The unbiased T1w average was constructed using the ANTs template construction pipeline. The resultant nonlinear warps were then applied to each subject contrast average to construct a final DWI study subject template (NHP-AVG). The skull stripping was performed semi-automatic with manual adjustments on each T1w average using the ITK-SNAP. The regions-of-interest (ROI) for white matter quantification were drawn manually on every subject's color-coded FA template. Three white matter ROIs were selected for quantification analyses: the corpus callosum, internal capsule, and anterior commissure. The D99 atlas was linearly registered and non-linearly warped into each T1w-average. From the individual atlases, we selected ROIs for probabilistic tractography. For mapping the cortico-spinal tract (CST), we selected the motor cortex (M1) as the source and the target as the pons. Cortical surfaces were created using FreeSurfer, and maps were projected onto the surface and along with ROIs contours using AFNI/SUMA software.
Results
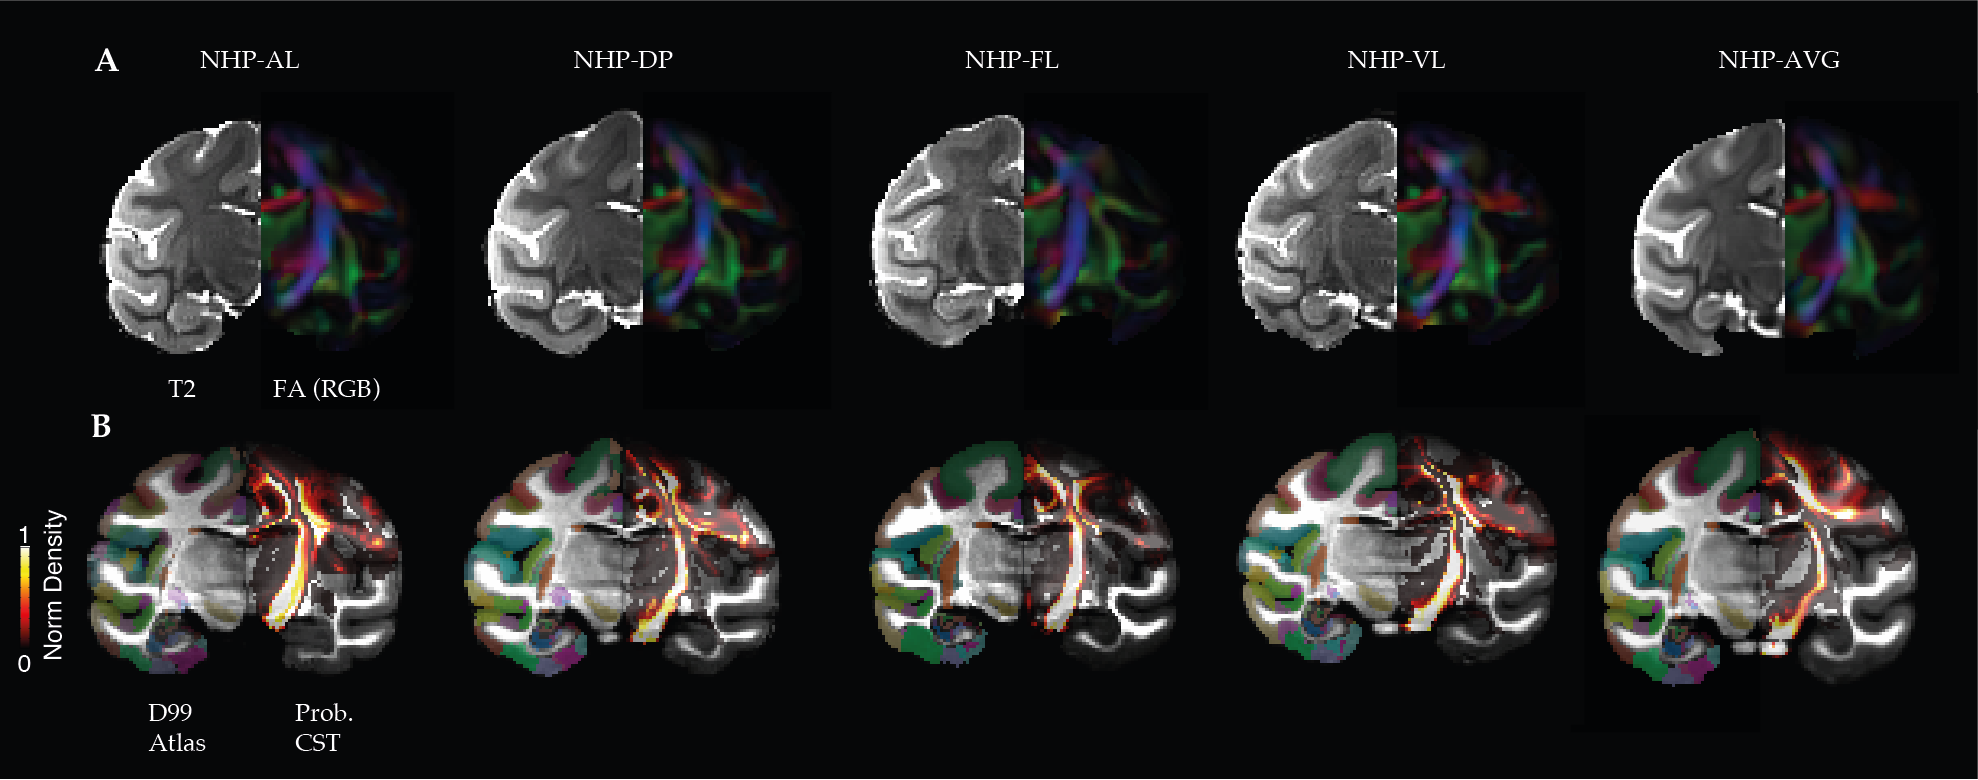
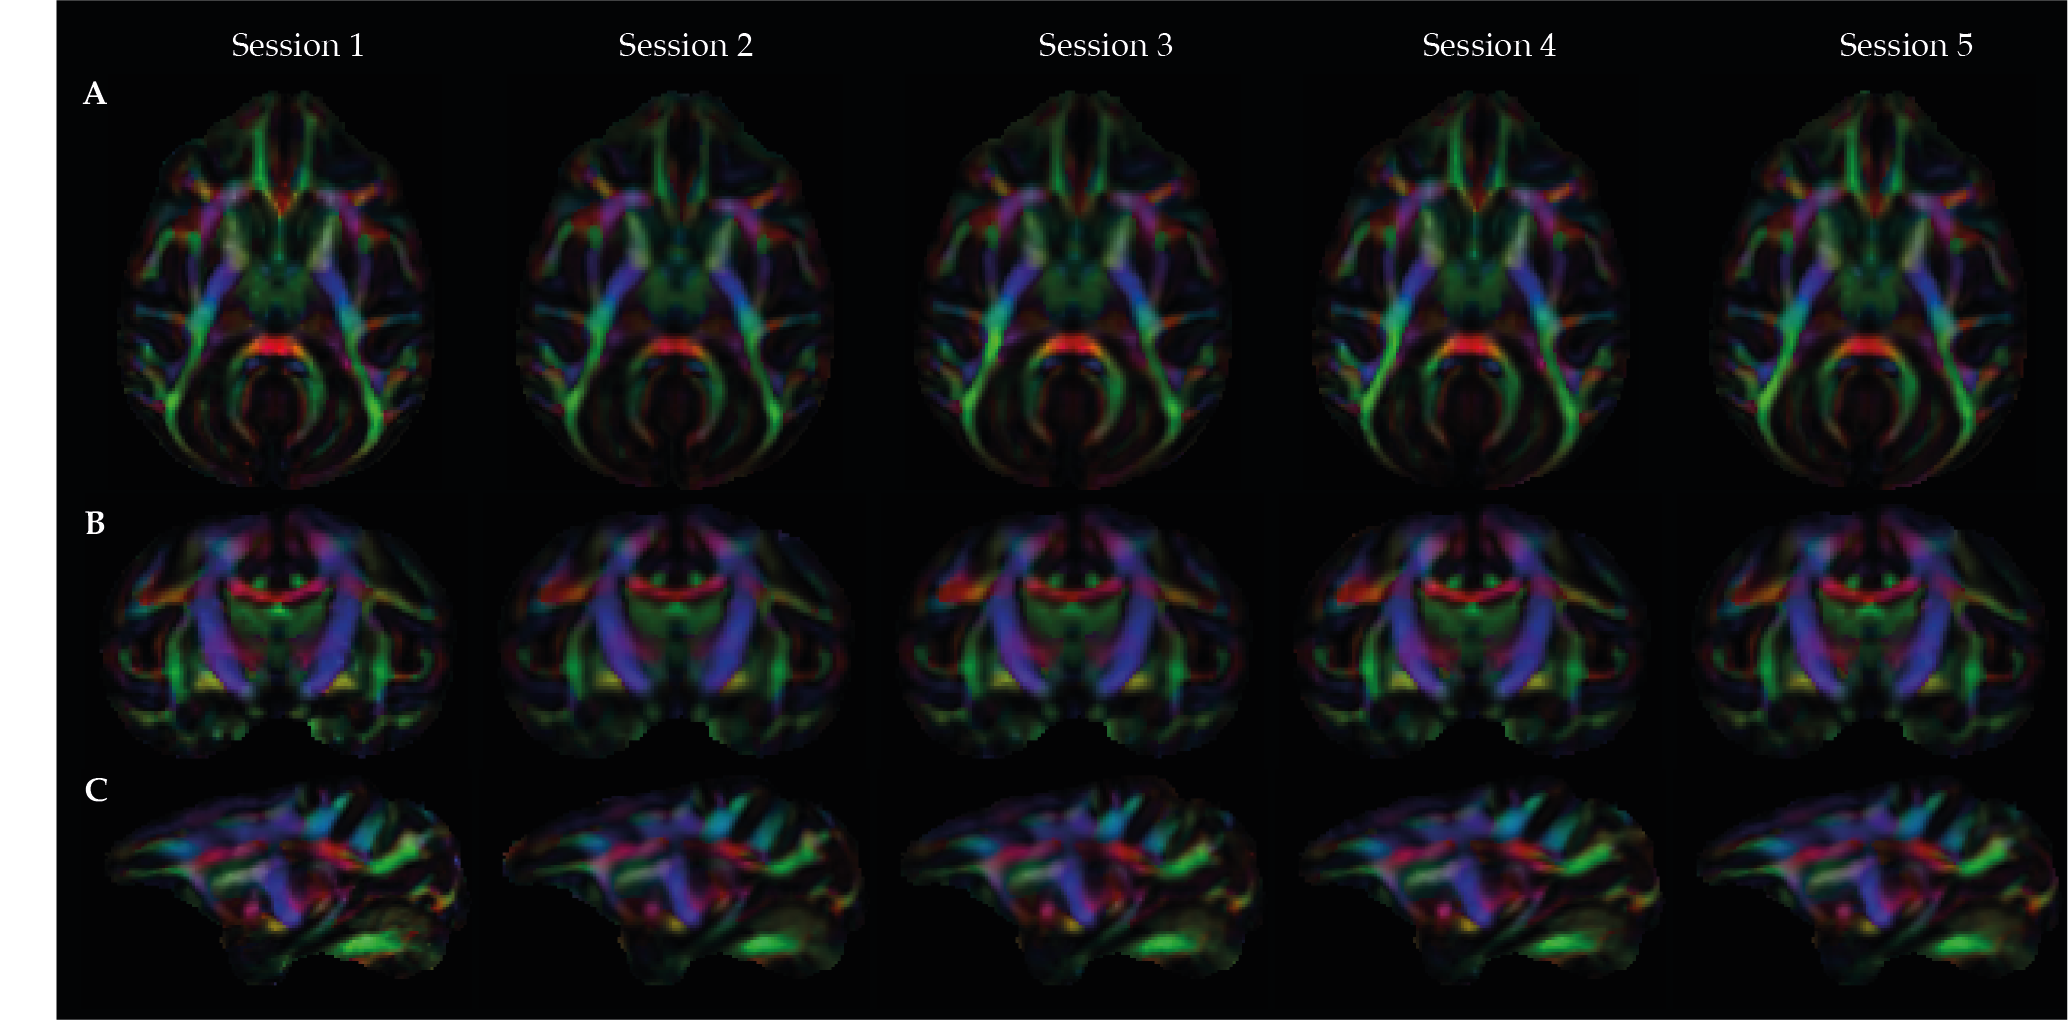
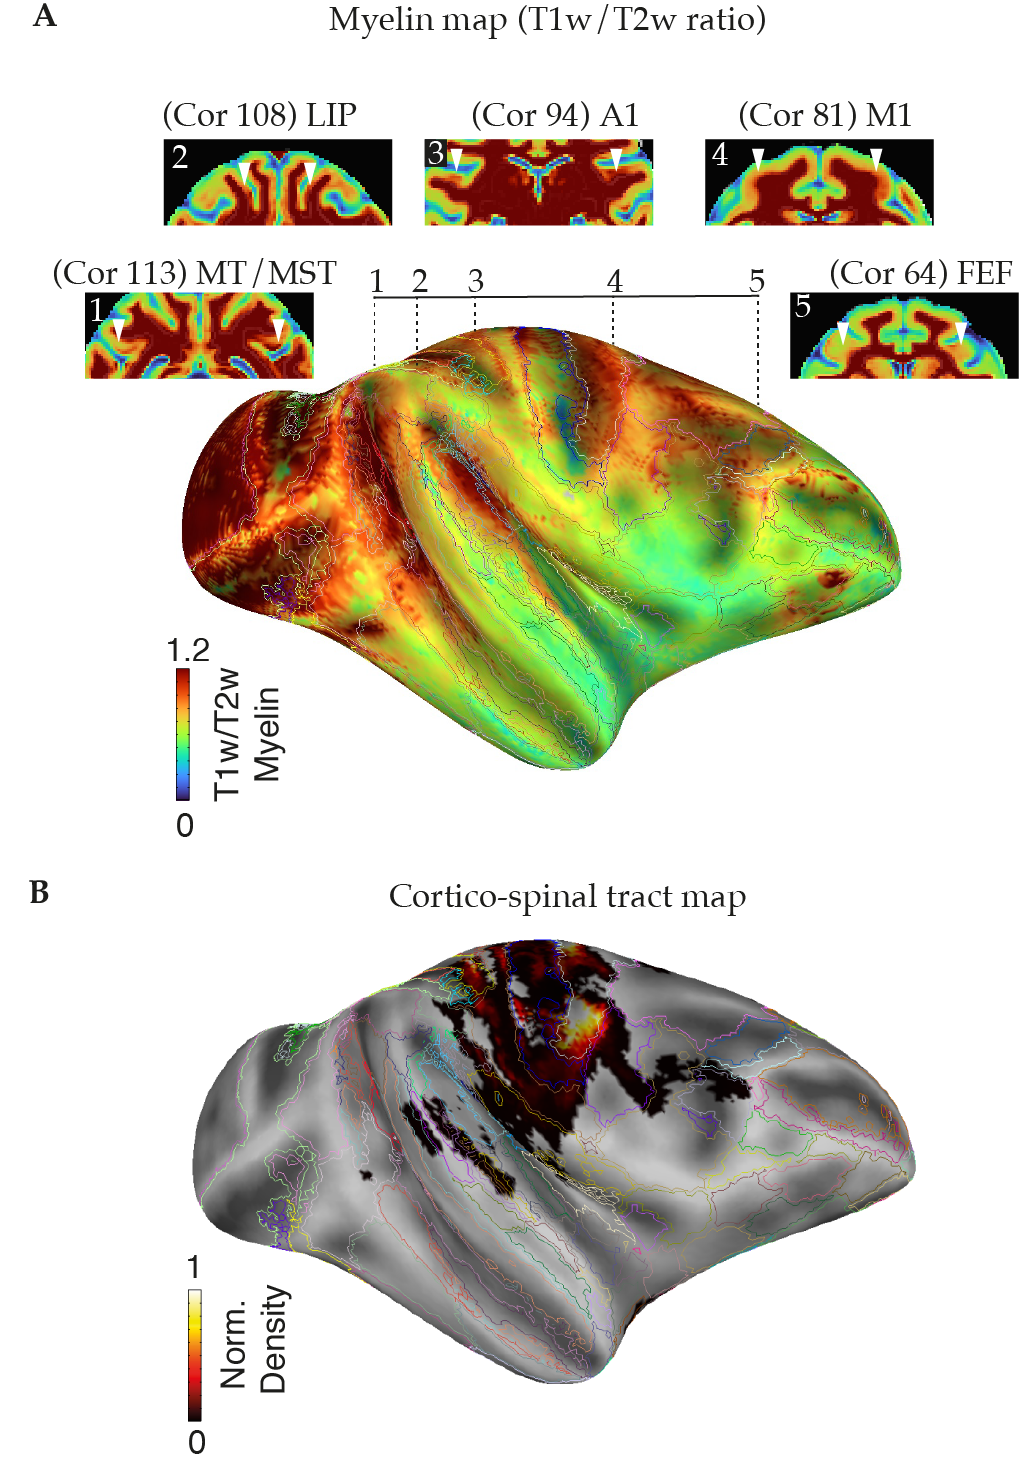
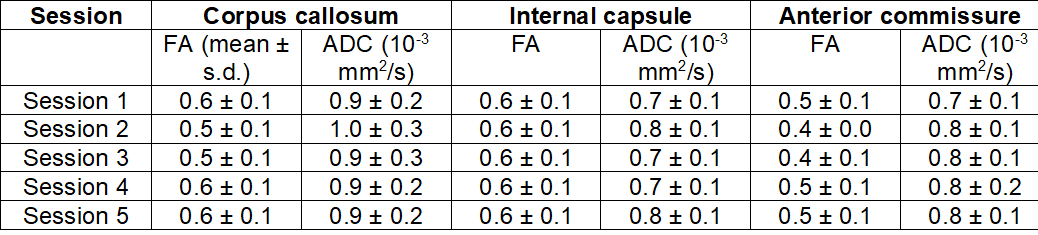
Inter-individual qualitative and quantitative data analysis was performed to test the data reliability and variability across subjects (Figure 1 and Table 1). FA maps and similar FA and ADC values across the multiple single sessions were found to be replicable and reliable (Figure 2 and Table 2). Using probabilistic tractography, we identify the cortico-spinal tract, which showed a dorso-ventral descending projection from the motor cortex into the brainstem on each subject and average template (Figure 1B). On the surface, we map the tract's fiber density to identify the regional correspondence between the CST innervation and the cortical myelin (Figure 3A). High-density fibers were found in the motor cortex, along with increases in the degree of myelination. The overall cortical myelin pattern was found to correspond to previous reports showing highly myelinated regions in humans and non-human primates3,6.Discussion and Conclusion
Our analyses indicate that it is feasible to obtain reliable multimodal MRI contrasts across sessions and subjects during awake imaging in macaque monkeys. Multimodal MR imaging in awake macaque monkeys could reveal cortical myelination and tissue microstructural features, including white matter fiber bundles. In the future, the extension of MRI contrasts such as quantitative susceptibility mapping and magnetization transfer in combination with functional MRI in awake NHPs will open the door for functional and structural comparisons from in-vivo and ex-vivo data obtained on the same NHP subject.Acknowledgements
This work was supported by ERC OptoVision 637638 granted to Michael C. Schmid.References
1. Balezeau, F., Wilson, B., Gallardo, G., Dick, F., Hopkins, W., Anwander, A., Friederici, A.D., Griffiths, T.D., Petkov, C.I., 2020. Primate auditory prototype in the evolution of the arcuate fasciculus. Nature Neuroscience 23, 611–614.
2. Calabrese, E., Badea, A., Coe, C.L., Lubach, G.R., Shi, Y., Styner, M.A., Johnson, G.A., 2015. A diffusion tensor MRI atlas of the postmortem rhesus macaque brain. NeuroImage 117, 408–416.
3. Essen, D.C.V., Donahue, C.J., Coalson, T.S., Kennedy, H., Hayashi, T., Glasser, M.F., 2019. Cerebral cortical folding, parcellation, and connectivity in humans, nonhuman primates, and mice. PNAS 116, 26173–26180.
4. Garyfallidis, E., Brett, M., Amirbekian, B., Rokem, A., van der Walt, S., Descoteaux, M., Nimmo-Smith, I., 2014. Dipy, a library for the analysis of diffusion MRI data. Front Neuroinform 8.
5. Girard, G., Caminiti, R., Battaglia-Mayer, A., St-Onge, E., Ambrosen, K.S., Eskildsen, S.F., Krug, K., Dyrby, T.B., Descoteaux, M., Thiran, J.-P., Innocenti, G.M., 2020. On the cortical connectivity in the macaque brain: A comparison of diffusion tractography and histological tracing data. NeuroImage 221, 117201.
6. Glasser, M.F., Essen, D.C.V., 2011. Mapping Human Cortical Areas In Vivo Based on Myelin Content as Revealed by T1- and T2-Weighted MRI. J. Neurosci. 31, 11597–11616.
7. Ortiz-Rios, M., Haag, M., Balezeau, F., Frey, S., Thiele, A., Murphy, K., Schmid, M.C., 2018. Improved methods for MRI-compatible implants in nonhuman primates. Journal of Neuroscience Methods 308, 377–389.
8. Tounekti, S., Troalen, T., Bihan-Poudec, Y., Froesel, M., Lamberton, F., Ozenne, V., Cléry, J., Richard, N., Descoteaux, M., Ben Hamed, S., Hiba, B., 2018. High-resolution 3D diffusion tensor MRI of anesthetized rhesus macaque brain at 3T. Neuroimage 181, 149–161.
Figures