4313
Exploring the thalamus of the human brain using tractography analysis in 3Tesla MRI1Gacheon University, Incheon, Korea, Republic of, 2Lee Gil Ya Cancer and Diabetes Institute, Incheon, Korea, Republic of
Synopsis
Although there are discrepancies between studies, it can be deduced that the thalamus region has a clear effect on neurological disorders due to a strong relationship between the thalamus and neurological functions such as emotional control and processing. In this study, MPRAGE and DTI data were acquired using 3Tesla MRI, and thalamus regions were segmented by subdivisions based on the THOMAS atlas 4. In addition, tractography analysis was performed to investigate the connectivity between the thalamus subregions.
Introduction
Thalamus is known to play an important role in the regulation of nerve function1. Thalamus, located in the center of the brain, is involved in sleep, arousal, and emotional regulation, and has been reported to be associated with multiple sclerosis, essential tremors, and neurodegenerative diseases such as Parkinson disease2. In addition, it has been reported that iron deposits in the thalamus can cause depressive symptoms with age3. Although there are discrepancies between studies, it can be deduced that the thalamus region has a clear effect on neurological disorders due to a strong relationship between the thalamus and neurological functions such as emotional control and processing. In this study, MPRAGE and DTI data were acquired using 3Tesla MRI, and thalamus regions were segmented by subdivisions based on the THOMAS atlas4. In addition, tractography analysis was performed to investigate the connectivity between the thalamus subregions.Material and Method
There were a total of 45 participants between 10 and 70 years old. Participants were classified into 3 groups. This study protocol was approved by Chungbuk National University Bioethics Committee. All images were collected using a 3T Philips Achieva Scanner (Philips Medical System, Best, Netherlands). For signal reception, a Sensitivity encoding (SENSE) 32-channel head coil was applied. The pulse sequence used for this acquisition was High-resolution T1-weighted three-dimensional magnetization-prepared rapid gradient echo (T1-MPRAGE) (Gradient echo sequence with a Repetition Time(TR) = 6.8 ms, Echo Time(TE) = 3.2 ms, Flip Angle(FA) = 9°, Bandwidth = 241.1Hz, Field Of View(FOV) = 256 x 242 mm, Slice Thickness = 1.2 mm, Matrix size = 287 x 271, Voxel size = 0.89 × 0.89 × 1.2 mm³, Number of Slice = 170, Scan time = 5 m 34 s) and 2D EPI-Diffusion tensor (Spin echo sequence with a Repetition Time(TR) = 16069 ms, Echo Time(TE) = 70 ms, Flip Angle(FA) = 90°, Bandwidth = 31.1 Hz, Field Of View(FOV) = 224 x 224 mm, Matrix size = 224 x 224, Slice Thickness = 2 mm, Voxel size = 1 × 1 × 2 mm³, Number of Slice = 75, diffusion direction = 32, Diffusion gradient pulse duration(δ) = 34.4 ms, Diffusion gradient separation(Δ) = 12.3 ms, B-value = 1000 s/mm², Scan time = 17 m 57 s). All image data processing was done through Lead-DBS (https://www.lead-dbs.org/)5. Bias field correction using the N4 algorithm was applied to MPRAGE, and co-registration was performed via spm12. The co-registered image was normalized to the MNI template space through advanced normalization tools (ANTs) symmetric image normalization (SyN)6. THOMAS atlas, which provides accurate segmentation information of thalamus in the MNI template space, was used for segmentation4. The eight segmented thalamus regions were divided into left and right hemispheres and used for tractography analysis.Result
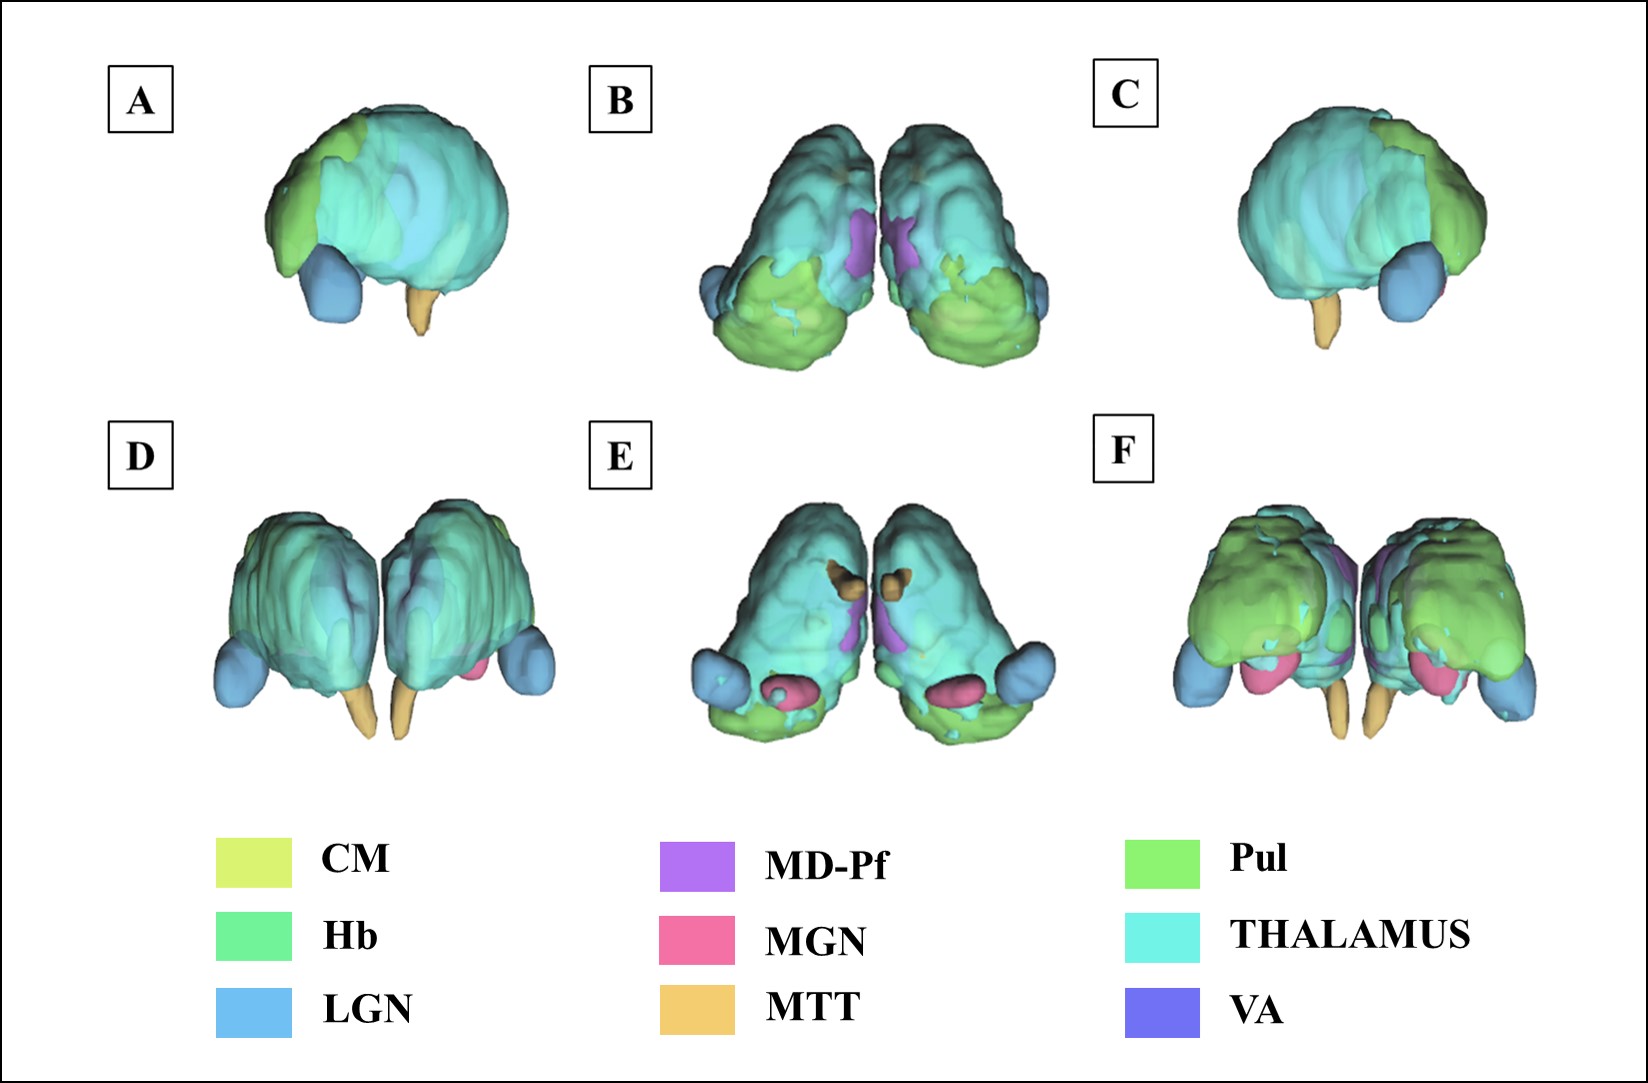
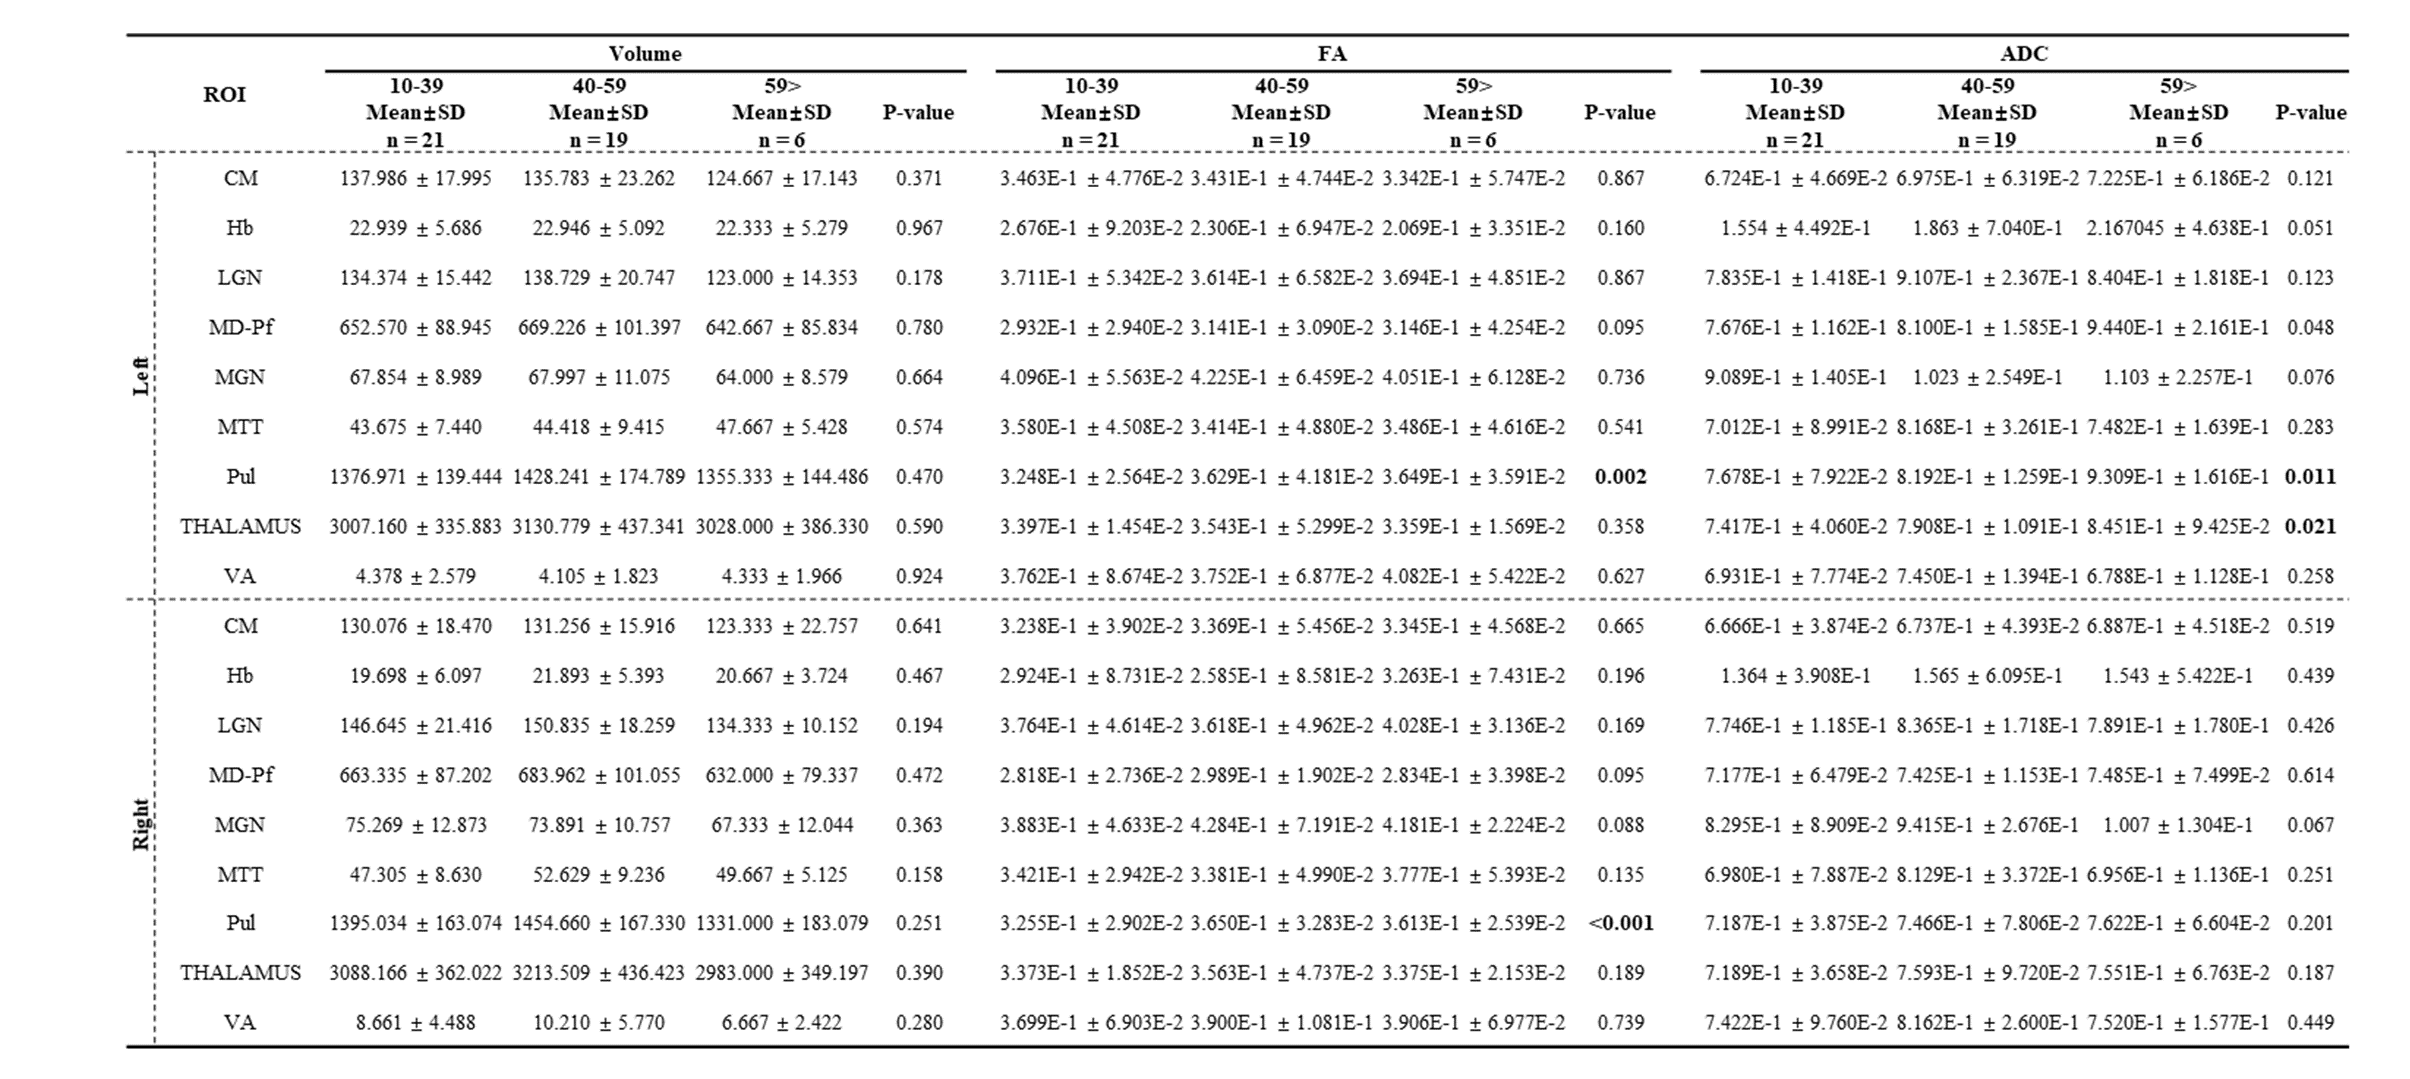
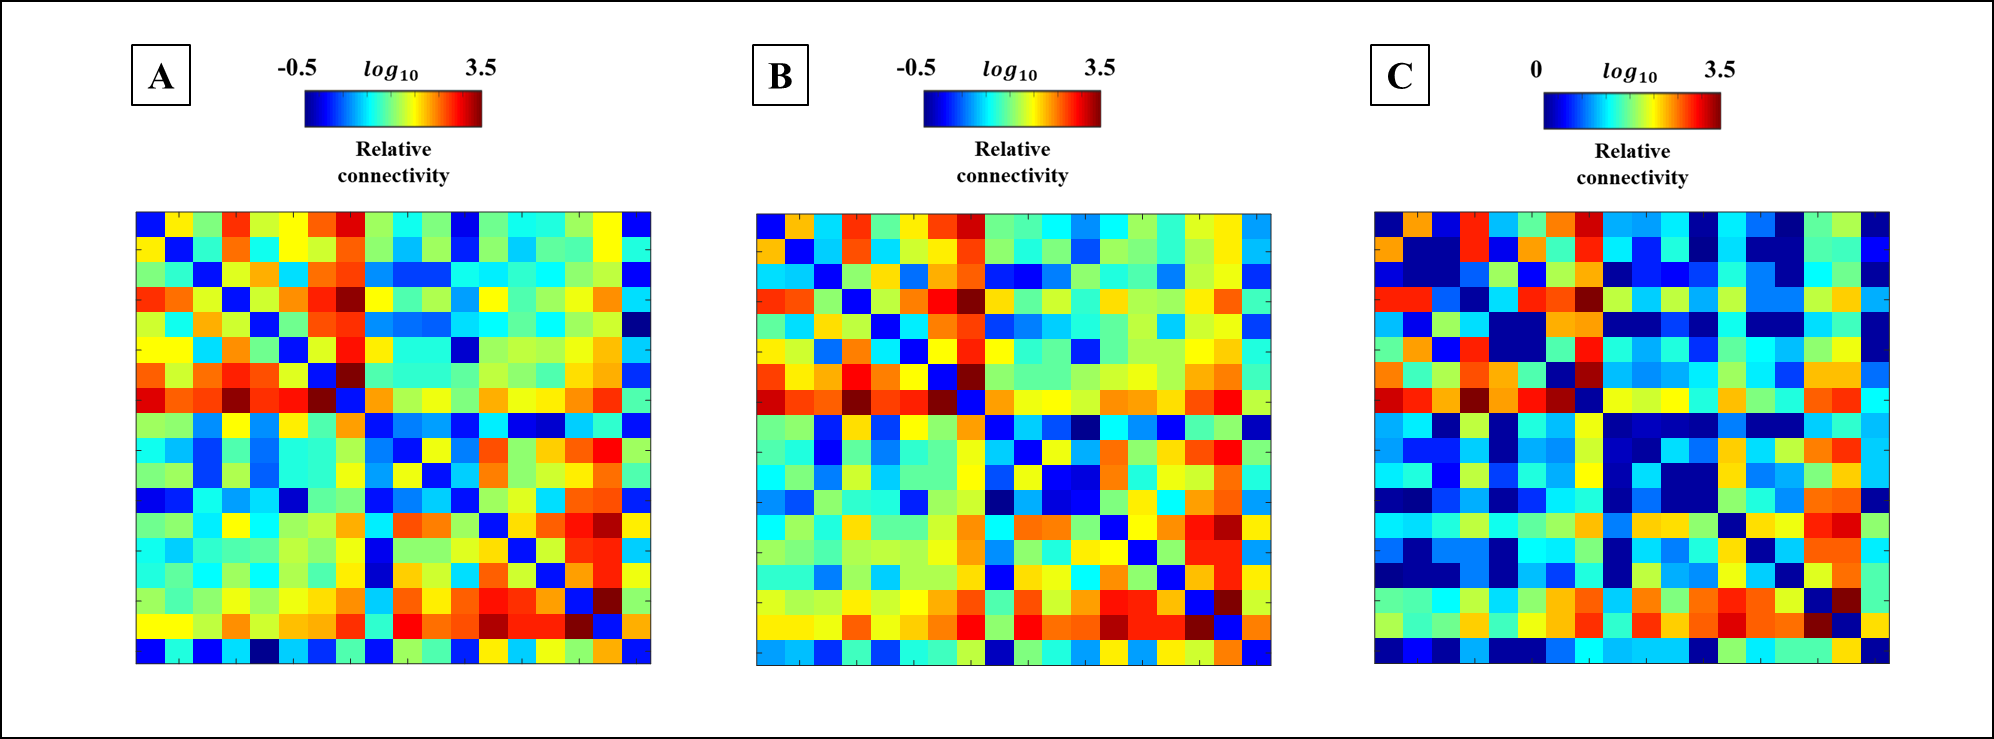
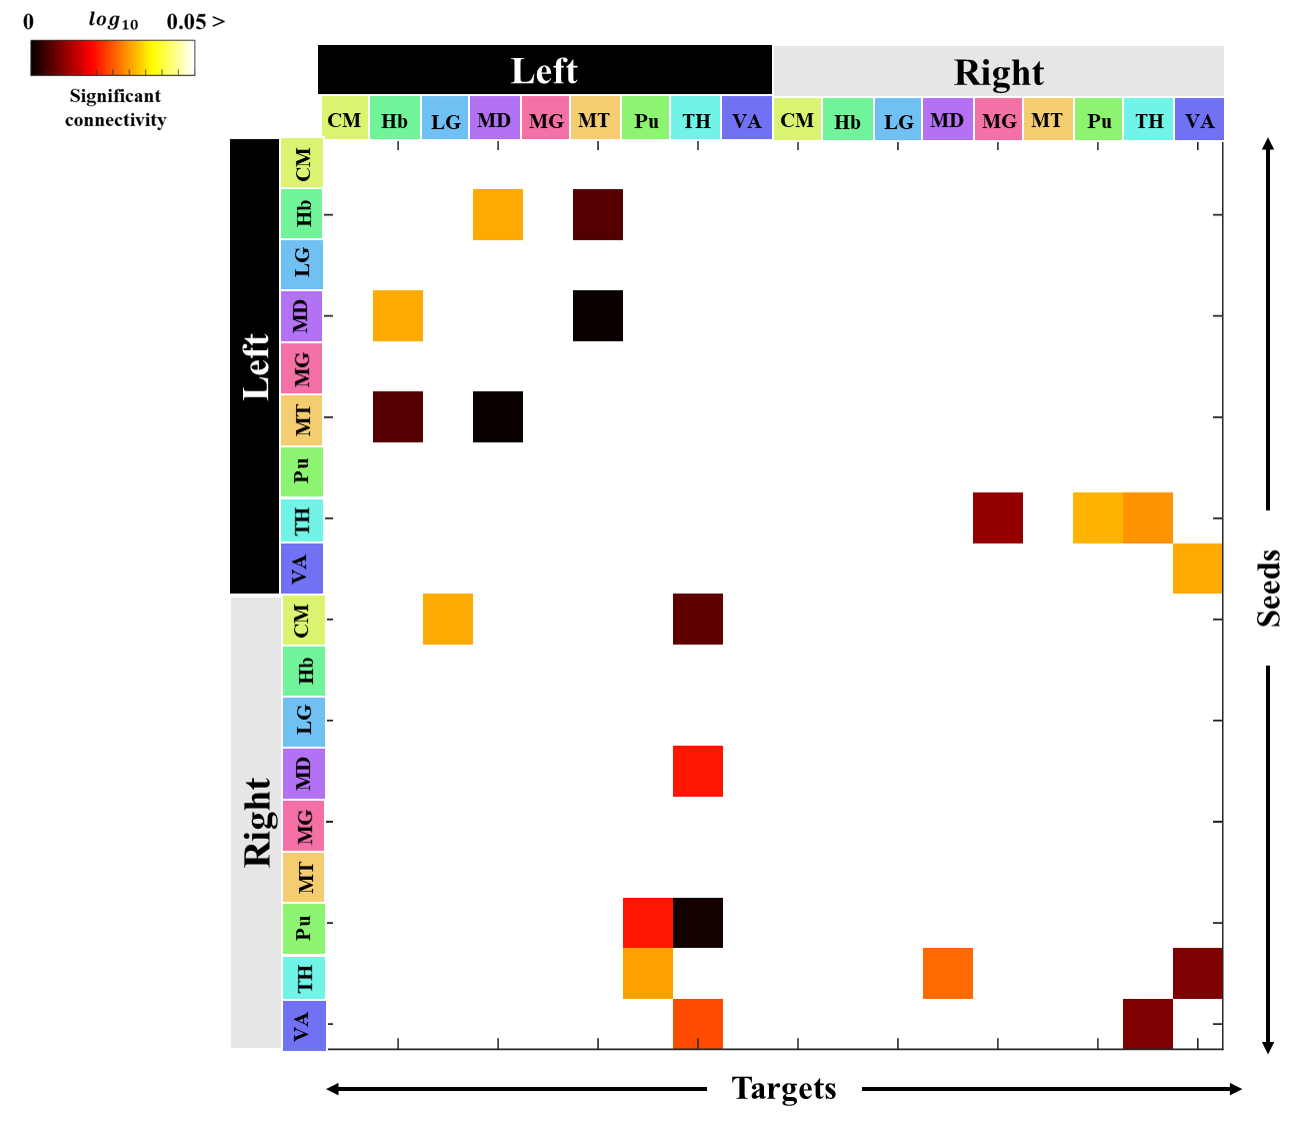
Figure 1 shows our segmentations of the THOMAS atlas. The name and color code of the Workplace template used to create this segmentation are shown in bottom. Table 1 displays the volume, FA and ADC value of our segmented structures. Tractography between thalamus are represented as connectivity matrices to compare connectivity between each thalamus structure as shown in Figure 2. Thalamus connectivity map was estimated between 18 anatomic regions with a log10 scale color map using waypoints connectivity. The connectivity of thalamus areas in the three groups were analyzed through T-test statistics, and presented as matrices in Figure 3.Discussion and conclusion
Through tractography analysis, the connectivity between the detailed areas of each subcortical region was investigated in the form of a matrix, showing strong connectivity and weak interhemispheric connectivity. Consistent with previous studies, the connectivity between structures at a closer distance was stronger than that of in the far7. In the 60> group, the WM connectivity of thalamus was found to be weaker than those of the two groups. Comparisons between the two groups showed that the young groups (10-39 and 40-59) had higher connection intensity than the 60> group and that statistically significant differences in 20 connection pathways were found in each hemisphere. A decrease in thalamus-related connection strength in aging has shown that it can affect emotional and neurological disorders such as anxiety and depression, and network measurements can help assess cognitive impairment across clinical conditions8,9.Acknowledgements
This research was supported by Brain Research Program (NRF-2017M3C7A1044367) through the National Research Foundation of Korea (NRF) funded by the Ministry of Science and ICT.References
[1] Wilkinson M, Kane T, Wang R, et al. Migration pathways of thalamic neurons and development of thalamocortical connections in humans revealed by diffusion MR tractography. Cerebral Cortex, 2017, 27.12: 5683-5695.
[2] Saranathan M, Iglehart C, Monti M, et al. In vivo structural MRI-based atlas of human thalamic nuclei. medRxiv, 2020
[3] Han KM, Choi S, Jung J, et al. Cortical thickness, cortical and subcortical volume, and white matter integrity in patients with their first episode of major depression. Journal of affective disorders, 2014, 155: 42-48.
[4] Su JH, Thomas FT, Kasoff WS, et al. Thalamus Optimized Multi Atlas Segmentation (THOMAS): fast, fully automated segmentation of thalamic nuclei from structural MRI. – PubMed – NCBI. NeuroImage, 2019, 194: 272–282.
[5] Horn A, Li N, Dembek TA, et al. Lead-DBS v2: Towards a comprehensive pipeline for deep brain stimulation imaging. Neuroimage, 2019, 184: 293-316.
[6] Ewert S, Horn A, Finkel F, et al. Toward optimized nonlinear deformation algorithms for subcortical DBS target regions in MRI. Deutsche Gesellschaft für Klinische Neurophysiologie und Funktionelle Bildgebung, 2018.
[7] Cacciola A, Calamuneri A, Milardi D, et al. A connectomic analysis of the human basal ganglia network. Frontiers in neuroanatomy, 2017, 11:85.
[8] Zhou H, Li R, Ma Z, et al. Smaller gray matter volume of hippocampus/parahippocampus in elderly people with subthreshold depression: a cross-sectional study. BMC psychiatry, 2016, 16(1):1-8.
[9] Gutman DA, Holtzheimer PE, Behrens TE, et al. A tractography analysis of two deep brain stimulation white matter targets for depression. Biological psychiatry, 2009, 65.4:276-282.
Figures