4311
Fractional Anisotropy Thresholding for Deterministic Tractography of the Roots of the Brachial Plexus1University of Leeds, Leeds, United Kingdom, 2Umeå University, Umeå, Sweden, 3University of Pittsburgh, Pittsburgh, PA, United States
Synopsis
We acquired high-angular resolution DTI from 10 healthy adults. We investigated how altering the fractional anisotropy threshold changed tractograms and tract-related metrics. At thresholds above 0.06, the propagation of valid tracts reduced significantly. The fractional anisotropy thresholds required to generate valid tractograms of the roots of the brachial plexus are lower than thresholds conventionally used in the brain. We provide estimates of the probability of generating valid tracts for each spinal nerve root of the brachial plexus, at different fractional anisotropy thresholds.
Introduction
In adults with a brachial plexus injury (BPI) the spinal nerve roots are the structures most commonly injured[1]. Whilst MRI is the best non-invasive test for diagnosing root injury, it misclassifies 25% of healthy roots as injured[1]. This shortfall in conventional imaging might be improved by diffusion tensor imaging (DTI), which is sensitive to myelination, axon diameter, fibre density and organisation[2–4]. Further, DTI tractography may help clinicians to evaluate changes in the diffusivity and anisotropy throughout the length of the roots, which might help to identify areas of pathology or targets for surgery. Altering the fractional anisotropy (FA) threshold for tractography has a significant effect on tractography in the brain, but this topic has not been studied in peripheral nerves and forms the rationale for this study in the brachial plexus.Methods
Ten healthy adults (8 males, 2 females; mean age 28 years) were scanned using a Siemens Prisma (3 Tesla) and single-shot echo-planar imaging, as follows: b-value 1000 s/mm2, 64 bipolar diffusion directions (using twice refocused spin echo with 16 interleaved non-diffusion weighted images), 2.5mm isotropic resolution with 4 signal averages. The sequence was repeated in opposing phase encoding direction. Data were combined and corrected for susceptibility artefacts. We propagated 250 tracts per root from a seeding region covering the spinal cord, via a 5mm3 region of interest covering the extra-foraminal spinal nerve roots. Tractography was performed by two independent raters, varying the FA thresholding at increments of 0.01 (from 0.04 to 0.1). DTI metrics were analysed using mixed-effects linear regression.Results
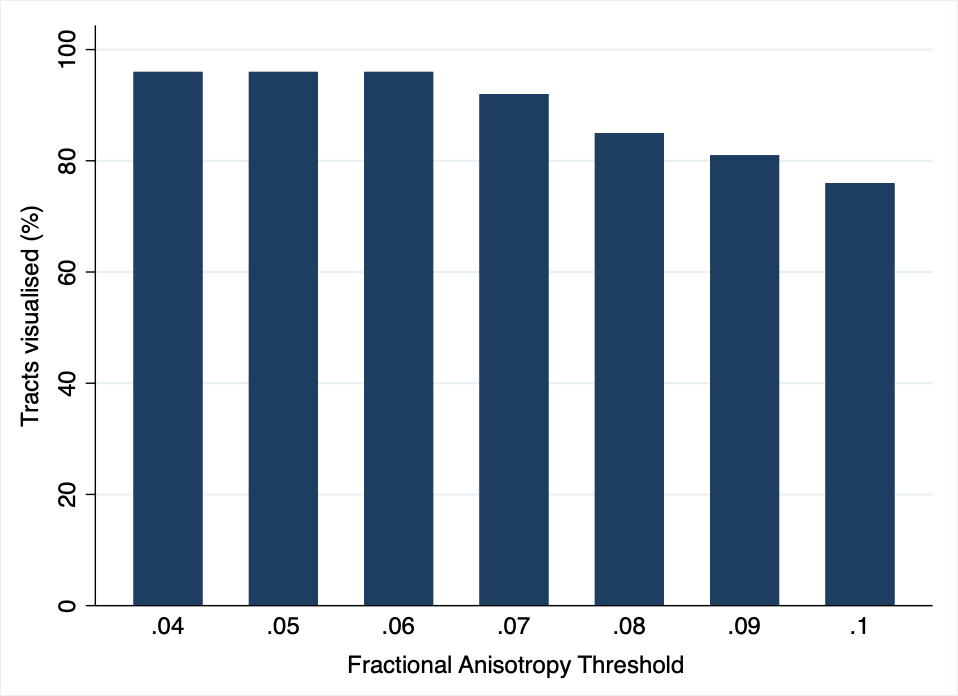
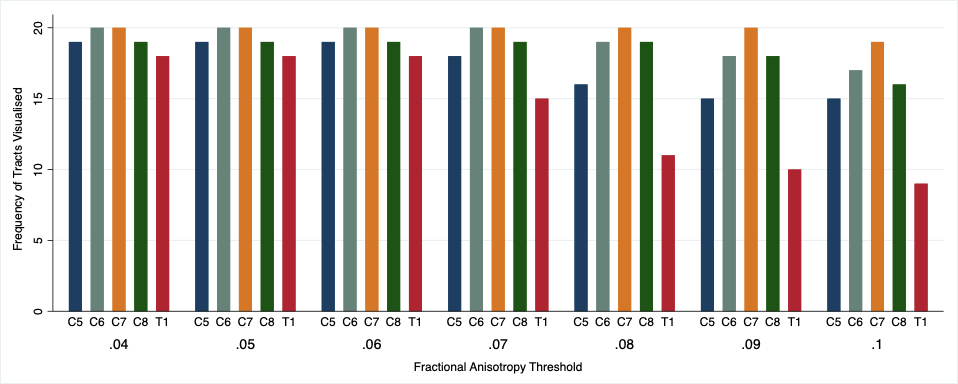
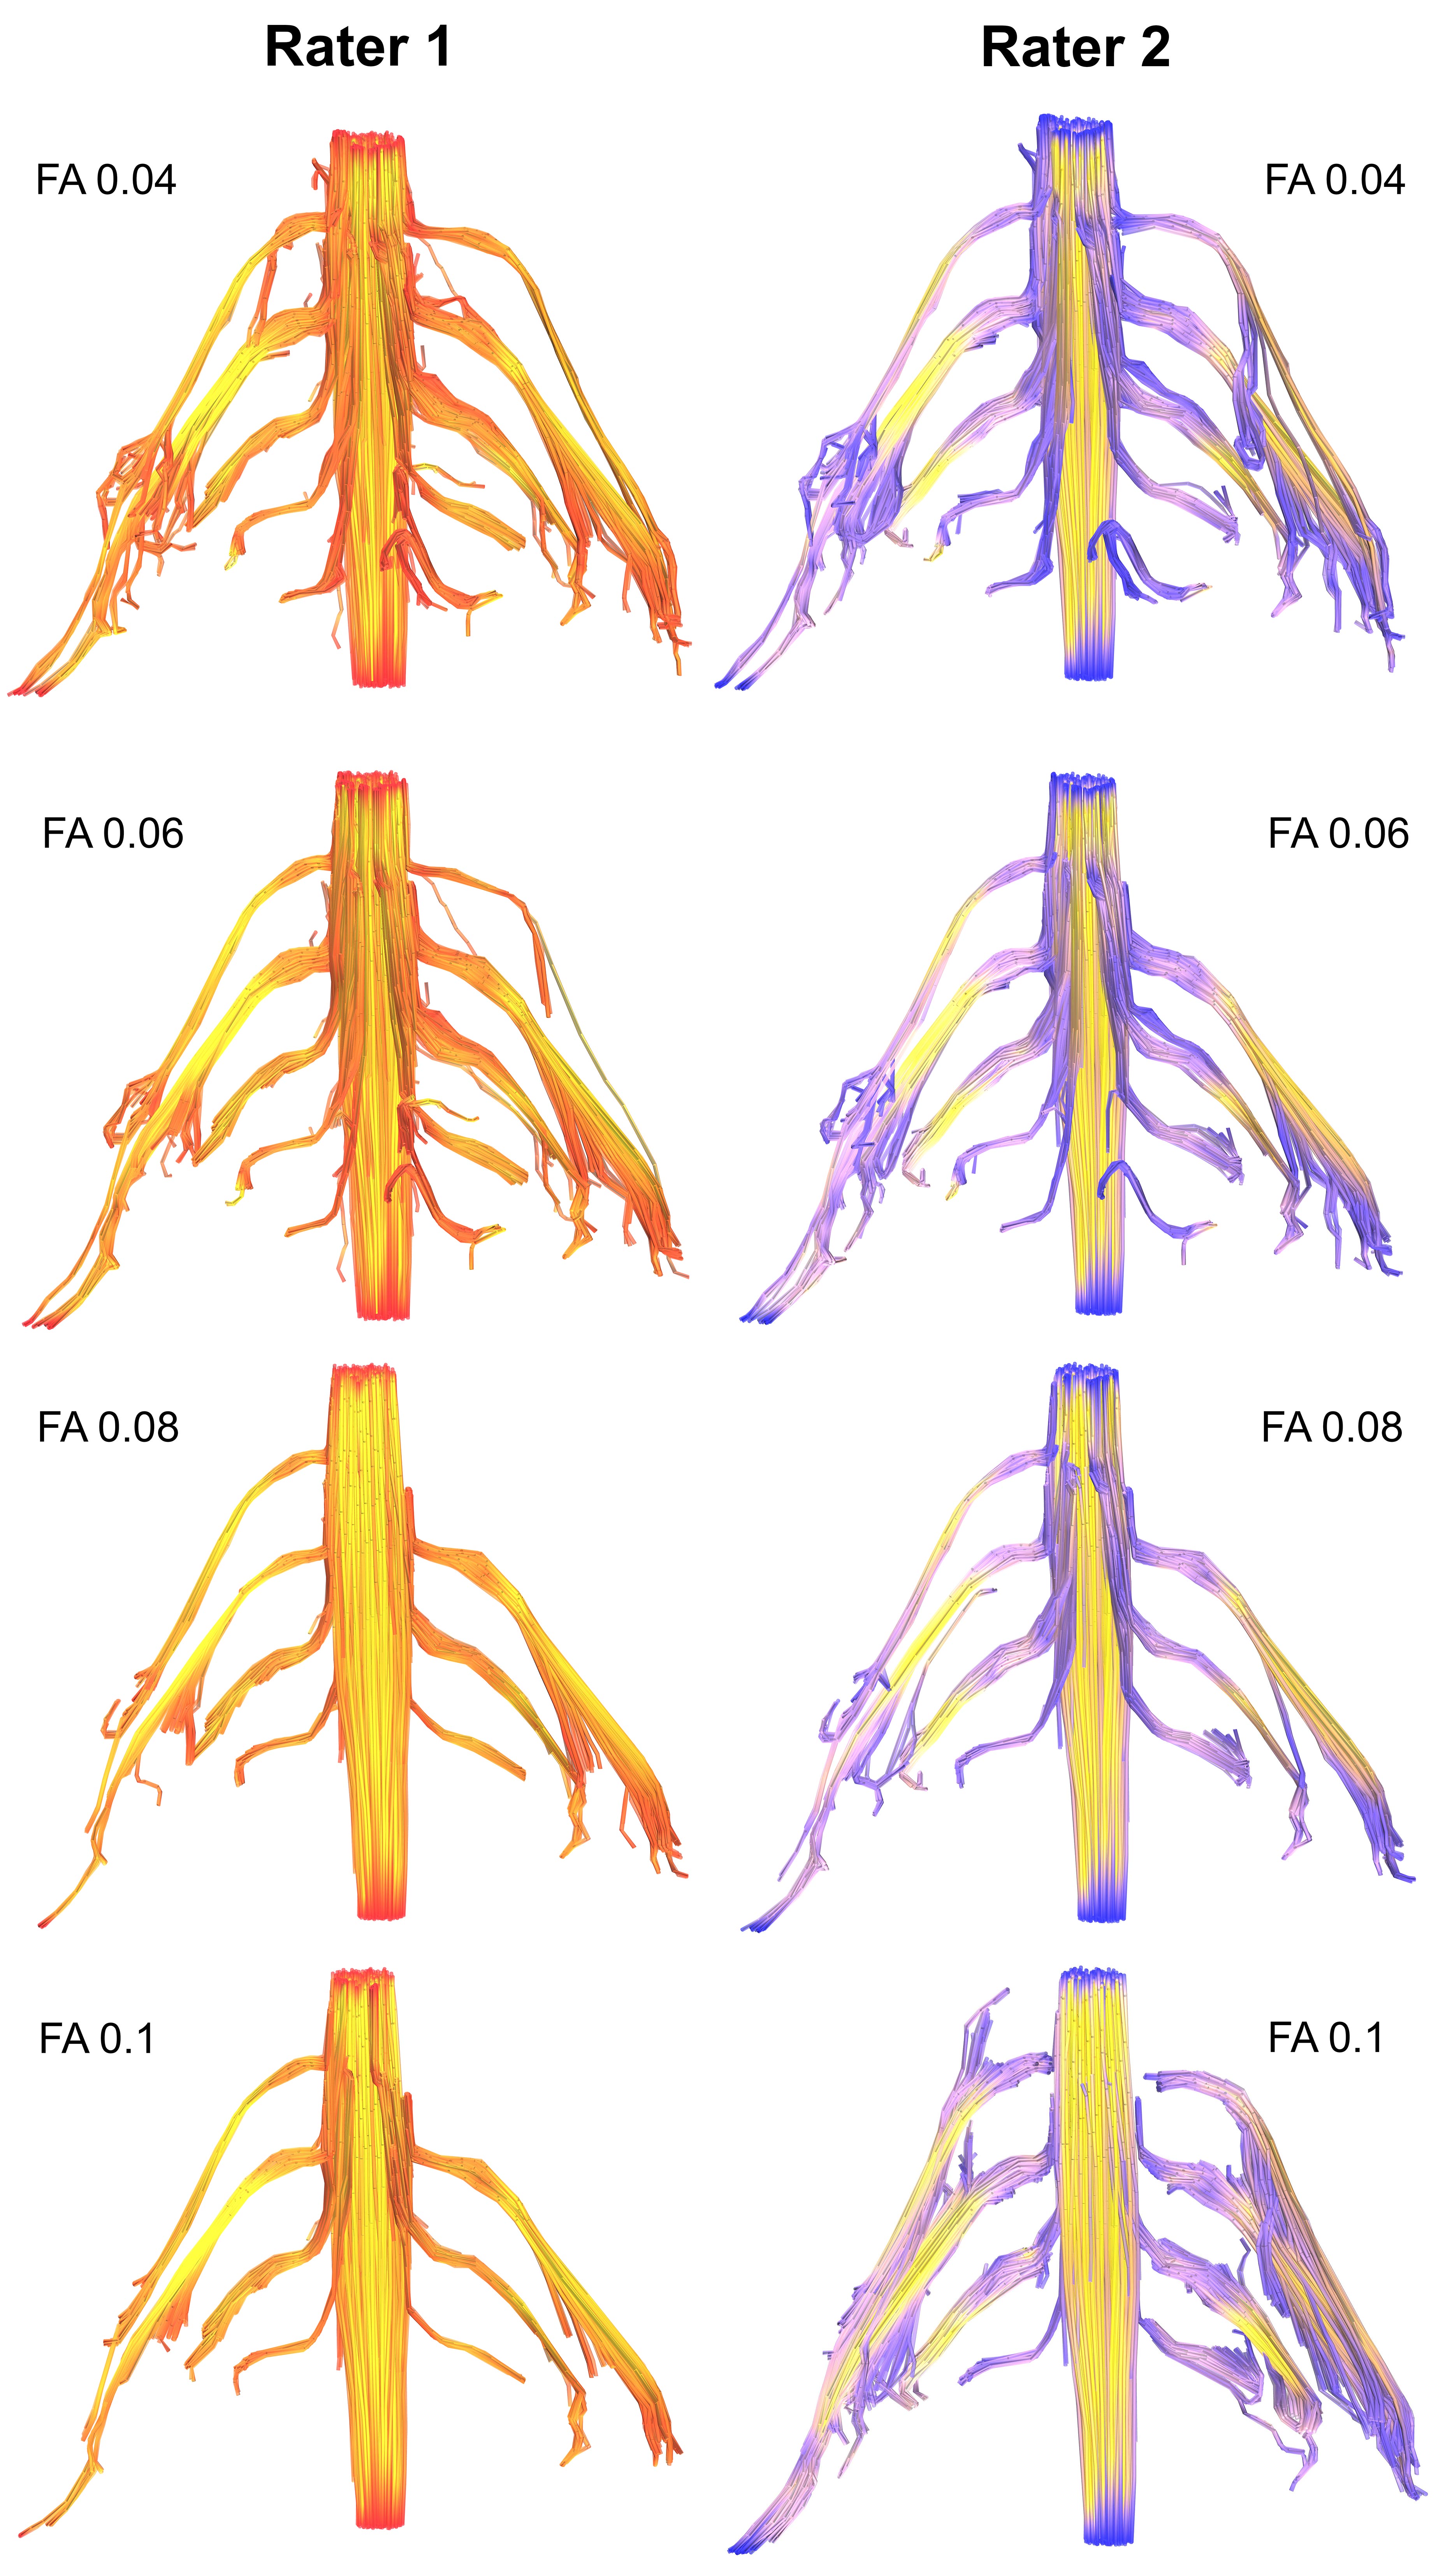
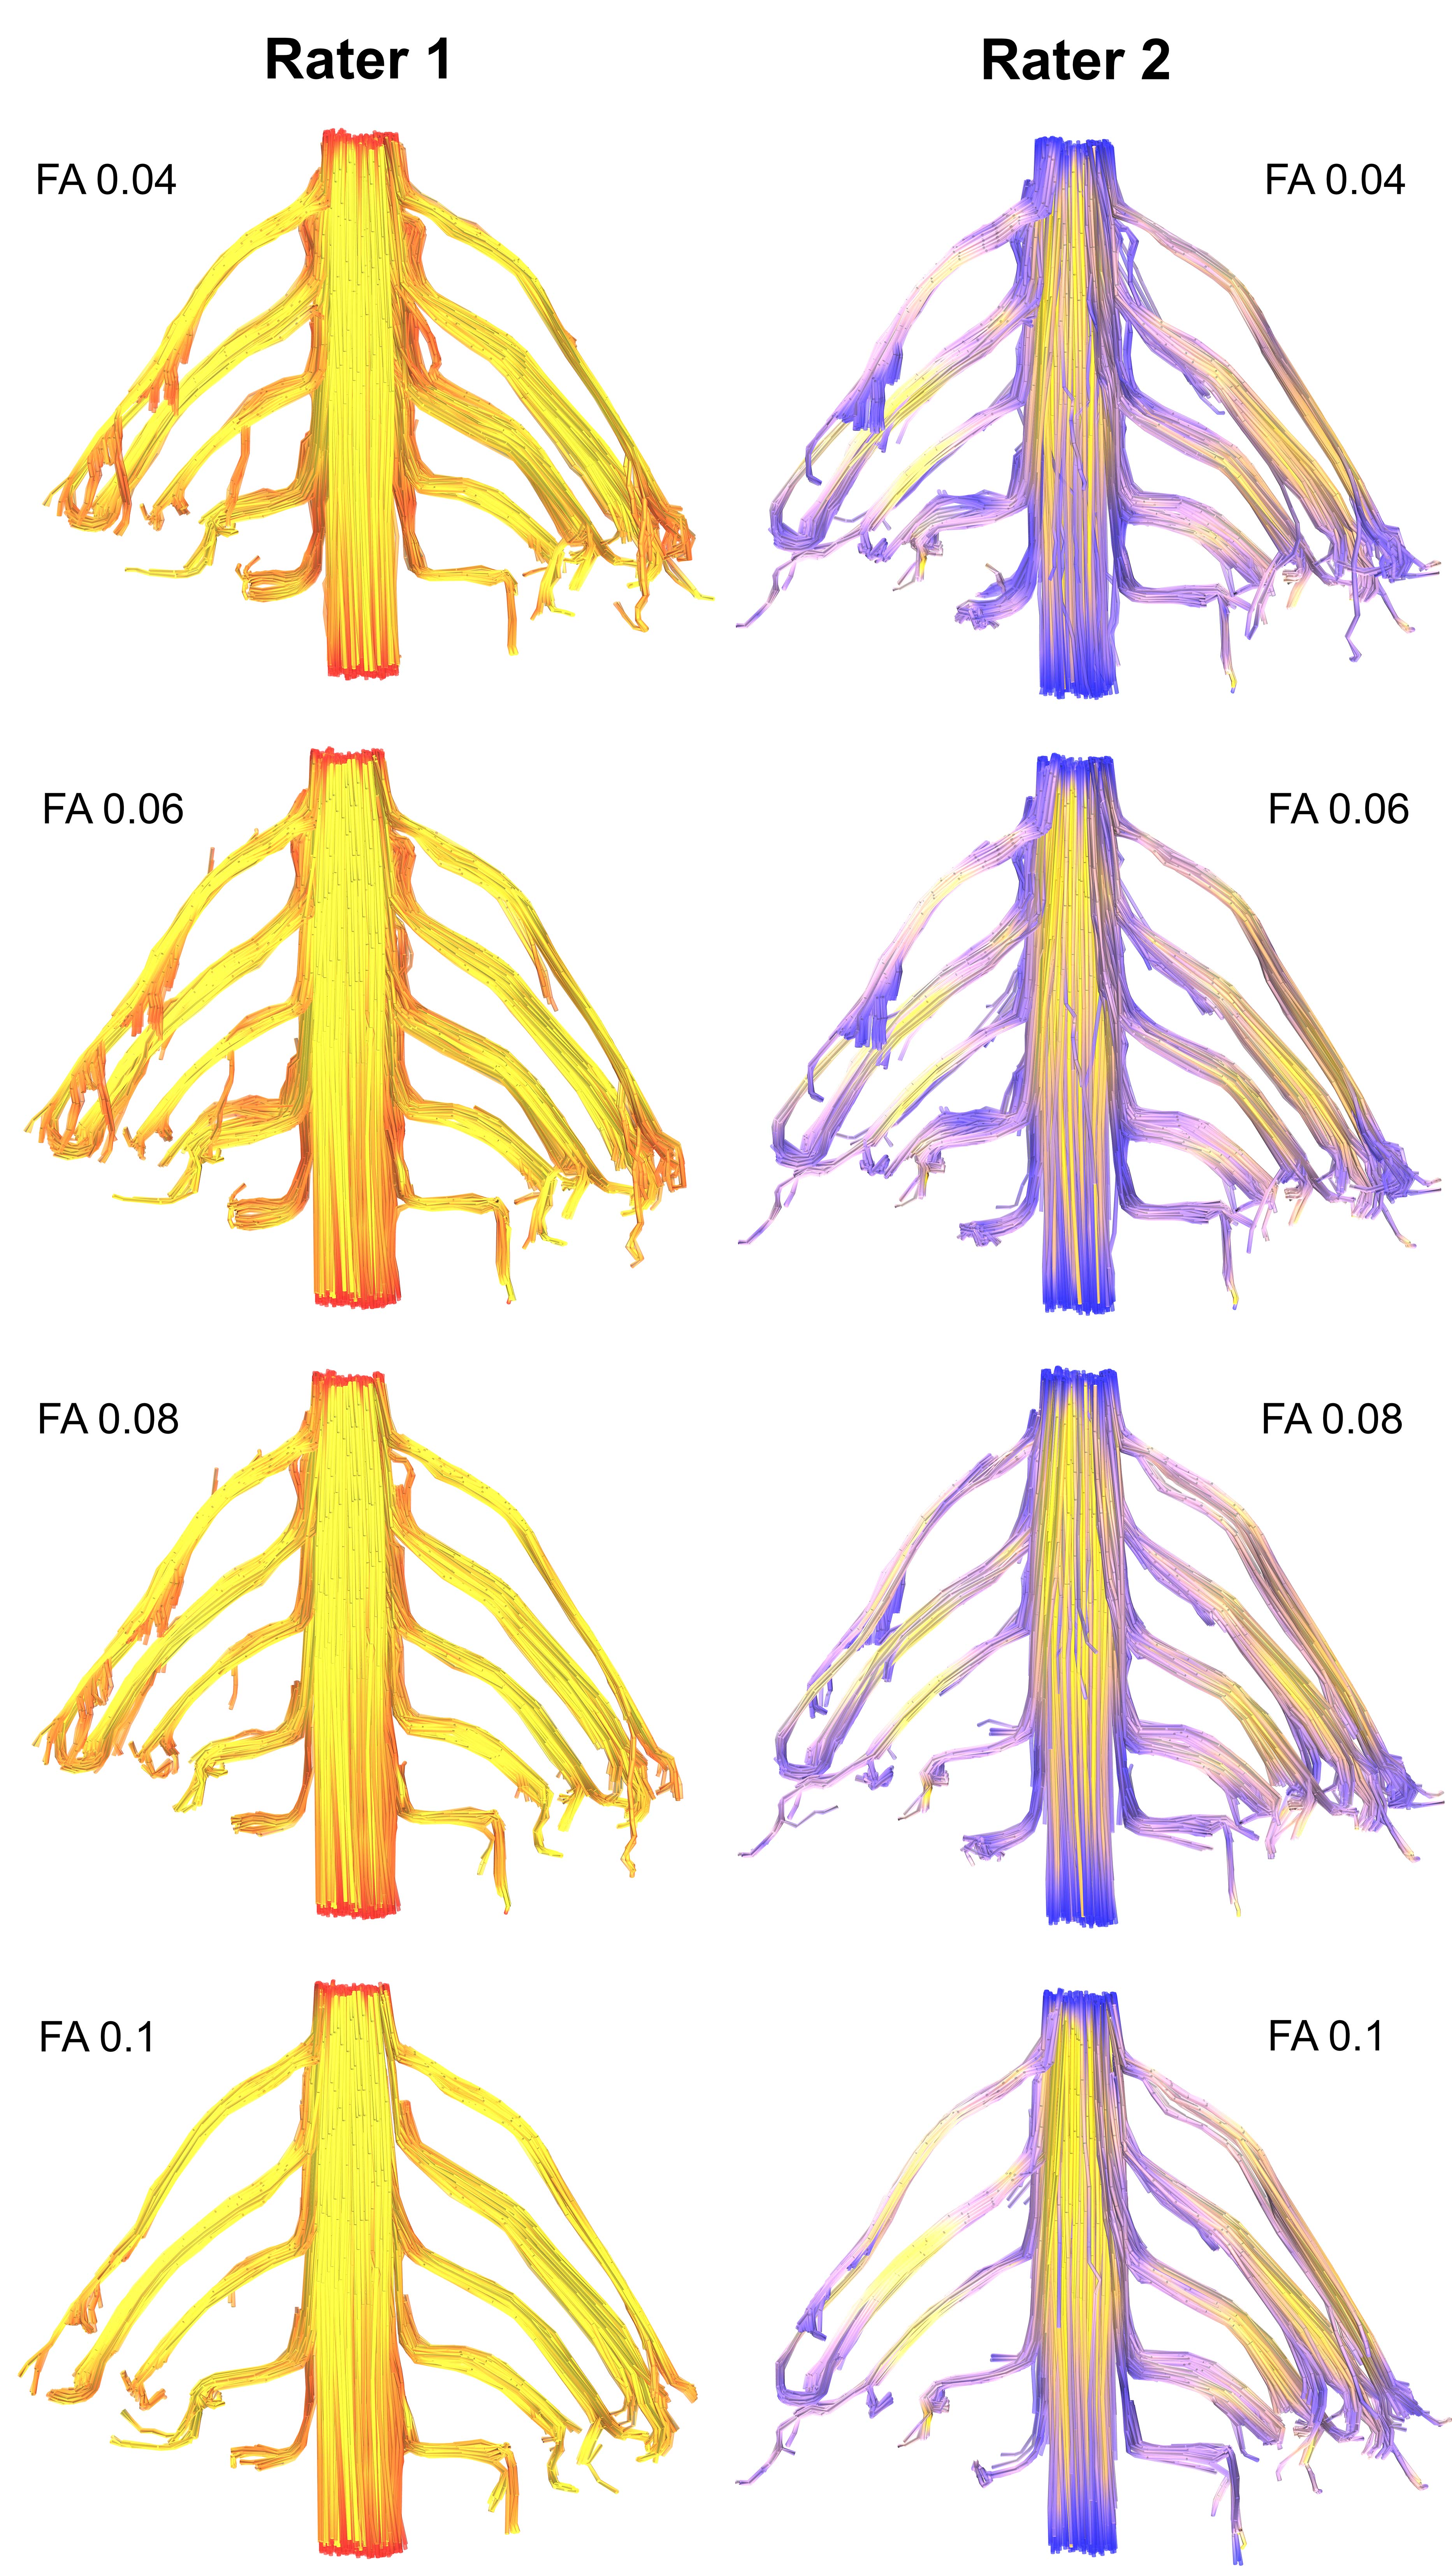
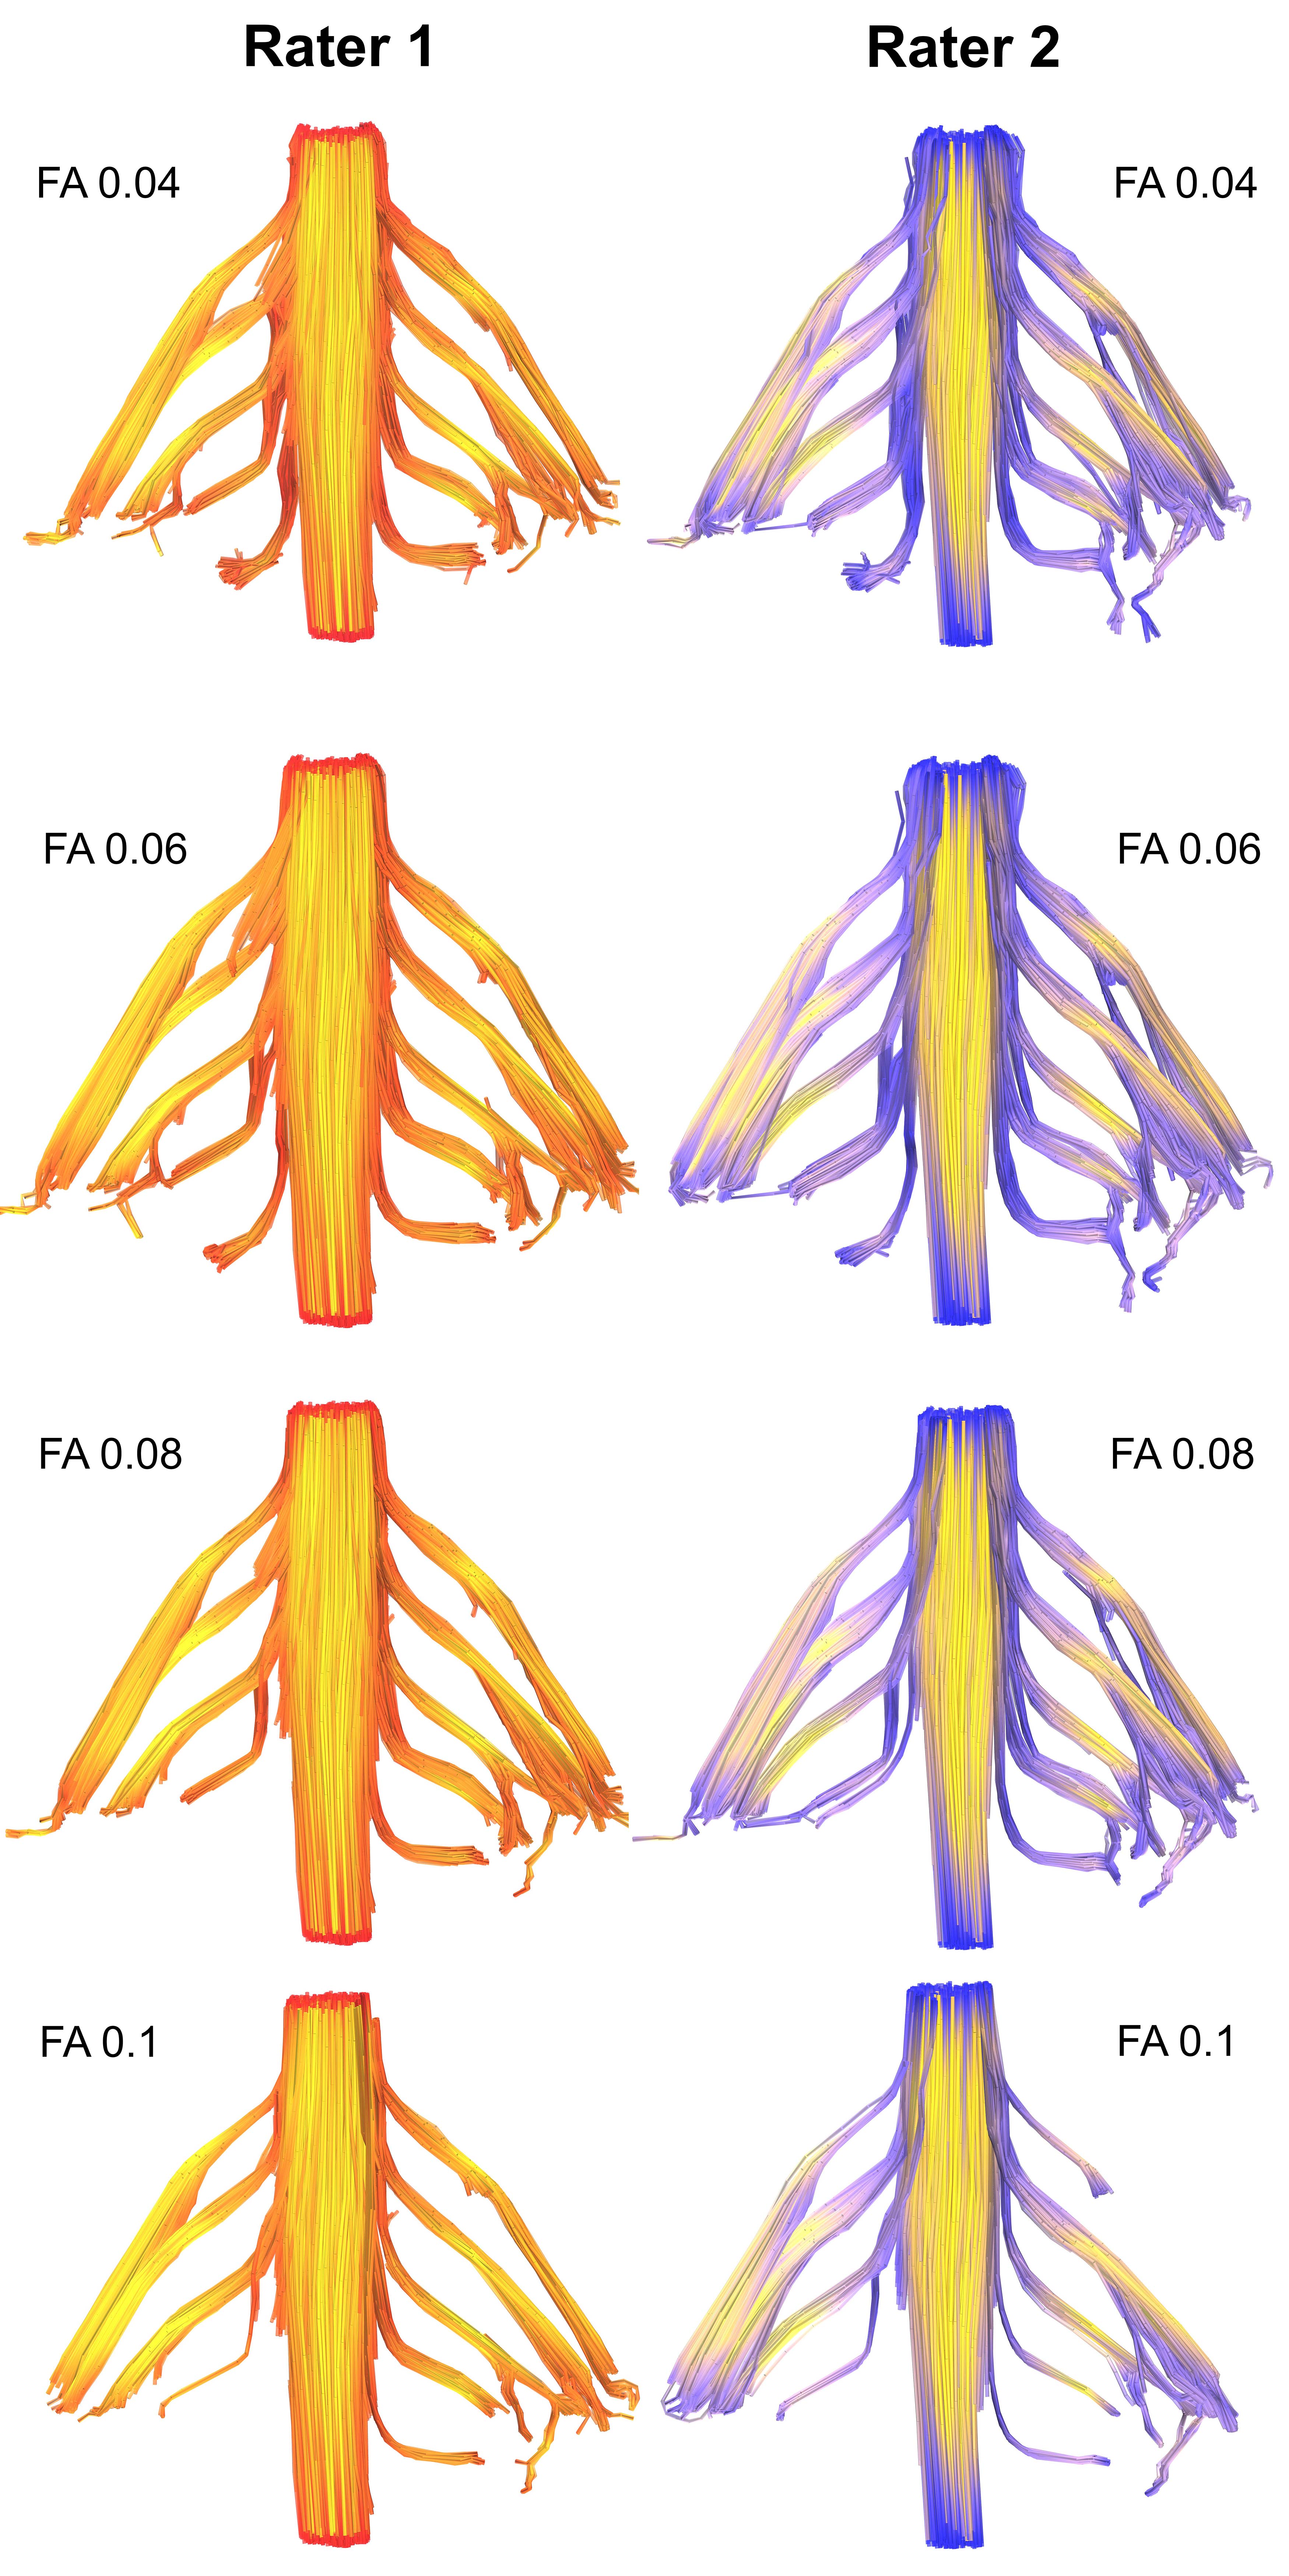
The mean FA varied between subjects by 2% (95% CI 1%, 3%). At higher FA thresholds fewer tracts were propagated (Figure 1) which was largely due to the failure to render tracts representing the T1 spinal nerve root (Figure 2). FA thresholds of 0.04, 0.05 and 0.06 all propagated 96% of tracts representing the roots. Increasing the FA threshold to 0.07 yielded 4% fewer tracts (p=0.2), 0.08 yielded 11% fewer tracts (p=0.008), 0.09 yielded 15% fewer tracts (p=0.001) and 0.1 yielded 20% fewer tracts (p<0.001). There was <0.1% inter-rater variability in the measured FA (mean difference 0.008 [95% CI -0.004, 0.01]; ICC 0.001) and 99% agreement for tractography (Cohen’s kappa 0.92, p<0.001; Figures 3-5).Discussion
We show that the FA thresholds conventionally used for tractography in the brain are too high for the brachial plexus roots. The normal FA of white matter pathways in the brain are 0.36 to 0.54[5], depending on the structure, which is substantially higher than the anisotropy estimates we provide. The discrepancies in FA between central white matter pathways and the roots of the brachial plexus are likely to be (at least in part) due to the 7-fold lower axon density of the roots (38,000 fibres mm-2 in the corpus callosum vs. 7914 mm-2 in the roots of the brachial plexus) and substantial fascicular bifurcation, merging, weaving and exchange throughout the length of the brachial plexus[6–8]. Our FA estimates are also slightly lower than those found in other studies[9–15]; it likely that other studies report upwardly biased estimates of FA because they used lower b-values and fewer diffusion encoding directions[16–19].Conclusions
The fractional anisotropy threshold required to generate tractograms of the roots of the brachial plexus appears to be lower than those used in the brain. We provide estimates of the probability of generating true tracts for each spinal nerve root of the brachial plexus, at different fractional anisotropy thresholds.Acknowledgements
No acknowledgement found.References
1. Wade RG, Takwoingi Y, Wormald JCR, Ridgway JP, Tanner S, Rankine JJ, et al. MRI for Detecting Root Avulsions in Traumatic Adult Brachial Plexus Injuries: A Systematic Review and Meta-Analysis of Diagnostic Accuracy. Radiology. 2019;293:125–33.
2. Heckel A, Weiler M, Xia A, Ruetters M, Pham M, Bendszus M, et al. Peripheral Nerve Diffusion Tensor Imaging: Assessment of Axon and Myelin Sheath Integrity. PLoS One. 2015;10:e0130833.
3. Andersson G, Orädd G, Sultan F, Novikov LN. In vivo Diffusion Tensor Imaging, Diffusion Kurtosis Imaging, and Tractography of a Sciatic Nerve Injury Model in Rat at 9.4T. Sci Rep. 2018;8:12911.
4. Friedrich P, Fraenz C, Schlüter C, Ocklenburg S, Mädler B, Güntürkün O, et al. The Relationship between Axon Density, Myelination, and Fractional Anisotropy in the Human Corpus Callosum. Cereb Cortex. 2020;30:2042–56.
5. Lebel C, Gee M, Camicioli R, Wieler M, Martin W, Beaulieu C. Diffusion tensor imaging of white matter tract evolution over the lifespan. Neuroimage. Elsevier Inc.; 2012;60:340–52.
6. Yokoyama I. [Study on the intraneural topography of the brachial plexus]. Nihon Seikeigeka Gakkai Zasshi. Japan; 1989;63:1085–102.
7. Sinha S, Prasad GL, Lalwani S. A cadaveric microanatomical study of the fascicular topography of the brachial plexus. J Neurosurg. 2016;125:355–62.
8. Chen Z, Zhang J, Chen T, Chen Z, Li H, Zhang EW, et al. Study of Sensory and Motor Fascicles in Brachial Plexus and Establishment of a Digital Three-Dimensional Graphic Model. Ann Plast Surg. 2011;67:615–9.
9. Oudeman J, Verhamme C, Engbersen MP, Caan MWA, Maas M, Froeling M, et al. Diffusion tensor MRI of the healthy brachial plexus. Gelderblom M, editor. PLoS One. 2018;13:e0196975.
10. Tagliafico A, Calabrese M, Puntoni M, Pace D, Baio G, Neumaier CE, et al. Brachial plexus MR imaging: accuracy and reproducibility of DTI-derived measurements and fibre tractography at 3.0-T. Eur Radiol; 2011;21:1764–71.
11. Su X, Kong X, Liu D, Kong X, Alwalid O, Wang J, et al. Multimodal magnetic resonance imaging of peripheral nerves: Establishment and validation of brachial and lumbosacral plexi measurements in 163 healthy subjects. Eur J Radiol. Elsevier; 2019;117:41–8.
12. Gasparotti R, Lodoli G, Meoded A, Carletti F, Garozzo D, Ferraresi S, et al. Feasibility of diffusion tensor tractography of brachial plexus injuries at 1.5 T. Invest Radiol. 2012/12/20. R. Gasparotti, Neuroradiology Unit, Department of Diagnostic Imaging, Brescia University School of Medicine, Piazzale Spedali Civili 1, 25123 Brescia, Italy. E-mail: gasparo@med.unibs.it: Lippincott Williams and Wilkins (530 Walnut Street,P O Box 327, Philadelphia PA 19106-3621, United States); 2013;48:104–12.
13. Ho MJ, Ciritsis A, Manoliu A, Stieltjes B, Marcon M, Andreisek G, et al. Diffusion Tensor Imaging of the Brachial Plexus: A Comparison between Readout-segmented and Conventional Single-shot Echo-planar Imaging. Magn Reson Med Sci. 2019;18:150–7.
14. Ho MJ, Manoliu A, Kuhn FP, Stieltjes B, Klarhöfer M, Feiweier T, et al. Evaluation of Reproducibility of Diffusion Tensor Imaging in the Brachial Plexus at 3.0 T. Invest Radiol. United States: Lippincott Williams and Wilkins (E-mail: kathiest.clai@apta.org); 2017;52:482–7.
15. Wade RG, Whittam A, Teh I, Andersson G, Yeh FC, Wiberg M, et al. Diffusion tensor imaging of the roots of the brachial plexus : a systematic review and meta ‑ analysis of normative values. Clin Transl Imaging. Springer International Publishing; 2020; https://doi.org/10.1007/s40336-020-00393
16. Haakma W, Pedersen M, Froeling M, Uhrenholt L, Leemans A, Boel LWT. Diffusion tensor imaging of peripheral nerves in non-fixed post-mortem subjects. Forensic Sci Int. Elsevier Ireland Ltd; 2016;263:139–46.
17. Giannelli M, Cosottini M, Michelassi MC, Lazzarotti G, Belmonte G, Bartolozzi C, et al. Dependence of brain DTI maps of fractional anisotropy and mean diffusivity on the number of diffusion weighting directions. J Appl Clin Med Phys. 2010;11:176–90.
18. Schilling KG, Nath V, Blaber J, Harrigan RL, Ding Z, Anderson AW, et al. Effects of b-value and number of gradient directions on diffusion MRI measures obtained with Q-ball imaging. Styner MA, Angelini ED, editors. Proc SPIE Int Soc Opt Eng. 2017;101330N.
19. Seo Y. Effects of different field strengths, gradient directions, and acquisitions on fractional anisotropy in diffusion tensor imaging: A tract-based spatial statistics study. Concepts Magn Reson Part B Magn Reson Eng. 2013;43B:41–8.
Figures