4309
Comparison of differences in brain structure area and differences through tractography analysis: patients with subclinical depression1Gacheon University, Incheon, Korea, Republic of, 22Department of Psychiatry, Chungbuk National University College of Medicine, Cheongju, Korea, Republic of, 3Department of Psychiatry, Chungbuk National University College of Medicine, Cheongju, Korea, Republic of
Synopsis
Structural and functional changes in the subcortical area affect cognitive function and can cause increased vulnerability to mood symptoms such as anxiety and depression. However, studies on changes in subcortical structures show inconsistencies. This research shows the structural differences in segmented subcortical regions between control and depression groups and visualizes the pathway between structures according to the connection strength through tractography analysis to confirm functional differences.
Introduction
Subclinical depression(SD), a condition that does not meet the criteria for depressive disorder despite having depressive symptoms is known to have a significant effect on the quality of life, such disorders can persist over a serious combination of serious symptoms, as well as mild grief and numbness. In addition, a previous study confirmed that the risk of developing minor depression from subclinical depression is increased in subjects with subclinical depression1. Tractography analysis using DTI allows the mapping of neural connectivity by reconstructing each voxel containing diffusion information into a fiber path2-4. Such analyses can show how many various related pathologies of the brain may be involved in changes in behavior, learning, and aging. However, further investigation is needed because relatively little is known about connectivity patterns between subcortical areas. This study provides a comprehensive cross-sectional analysis of changes in the brain structure related to depression in two groups of elderly populations using 3T MRI. The results of this study can be served as a reference database for the study of depression-related brain connectivity.Method
The recruited participants, a total of 39, were divided into two groups: 20 in the controls and 19 in the diseased group. Participants who agreed to the test were given a mini-mental status examination in the Korean version of the CERAD assessment packet(MMSE-KC)5 and the Korean version of the short geriatric depression scale(GDS-K)6. Image data acquisition was conducted on a 3 Tesla Philips Achieve MRI scanner(Philips Medical System, Netherlands). For signal reception, a Sensitivity encoding(SENSE) 8-channel head coil was applied. The pulse sequence used for this acquisition was High-resolution T1-weighted three-dimensional magnetization-prepared rapid gradient echo(T1-MPRAGE) (Gradient echo sequence with a Repetition Time(TR) = 6.8 ms, Echo Time(TE) = 3.2 ms, Flip Angle(FA) = 9°, Bandwidth = 241.1Hz, Field Of View(FOV) = 256x240 mm, Slice Thickness = 1.2 mm, Matrix size = 256x240, Voxel size = 1×1×1.2 mm³, Number of Slice = 170, Scan time = 5 m 34 s) and 2D EPI-Diffusion tensor (Spin echo sequence with a Repetition Time(TR) = 6033 ms, Echo Time(TE) = 70 ms, Flip Angle(FA) = 90°, Bandwidth = 29.8 Hz, Field Of View(FOV) = 224x224 mm, Matrix size = 112x109, Slice Thickness = 3 mm, Voxel size = 2×2.04× 3 mm³, Number of Slice = 50, Diffusion gradient pulse duration(δ) = 34.4 ms, Diffusion gradient separation(Δ) = 12.3 ms, B-value = 1000 s/mm², Scan time = 3 m 31 s). Pipelines used for image data analysis were processed using FMRIB software library version 5.0.1(FSL, Created by the Analysis Group, Oxford, UK)7 and MRtrix3 (Brain Research Institute, Melbourne, Australia)8. First, all DICOM data were converted to NIFTI format, and brain images were extracted from the input data. After registering each extracted brain images to Montreal Neurological Institute(MNI) 152 space, the segmentation of volume estimation was performed to calculate the total brain tissue volume9. Second, using the FIRST tool, we acquired extracted subcortical regions(Nucleus Accumbens, Amygdala, Caudate, Hippocampus, Globus Pallidus, Putamen, and Thalamus) of the brain10. Third, the volume data of 7 subcortical structures were measured. Lastly, DTI data was preprocessed through noise removal, and neural connectivity analyzed and quantified through diffusion analysis11. The image Data processing pipeline is shown in Fig 1.Result
The visualized subcortical areas are presented in Fig. 2, and detailed positions and shapes of them are identified on each slide. Also, the segmentation results are 3D rendered in Fig. 3. Table 1 shows the statistical difference of all average volume, FA, and ADC values between the controls and the depressions. Although there were no significant differences in volume and the FA values between the control group and the depression group, ADC value on the Left Hippocampus area was significantly different (p: 4.69E-02). However, after FDR correction was done, the significant difference disappeared (p>0.05). The probabilistic tractography analysis is presented in the form of a linked matrix (Fig 4-A,B), with the T-test comparison each group's connectivity strength are compared (Fig 4-C,D). The connectivities between structures that show the significant difference from the T-test statistical analysis are 3D rendered and visible in Figure 5. The aforementioned results are consistent with the connectivity matrix shown in Figure 4, the control group showing stronger connectivity strength than the disease group's connectivity.Discussion and conclusion
This study aims to investigate structural and functional differences in subcortical regions of aged patients with depression using 3Tesla MRI. Structural analysis showed that in the majority of measured subcortical volumes, FA, and ADC were smaller in the depression group volumes, with measured values on the left hemisphere larger than that of the right hemisphere in all groups. Functional analysis using probabilistic tractography indicated that the connection intensity between each subcortical area was higher in the control group than the depression group, especially between left accumbense-left hippocampus, left accumbense-right hippocampus, and right thalamus-right caudate. Such differences of connection strength showed that emotional and cognitive disorders, such as anxiety and sadness, can affect the subcortical connectivity of depression groups, and the analysis of cross-regional network measures can help assess cognitive impairment across clinical conditions12. The results of this study can be used as a reference for other brain connection related research in depression.Acknowledgements
No acknowledgement found.References
[1] Cuijpers P, Smit F et al. Subclinical depression: a clinically relevant condition?. Tijdschrift voor psychiatrie. 2008;50(8):519.
[2] Zeineh MM, Holdsworth S, Skare S et al. Ultra-high resolution diffusion tensor imaging of the microscopic pathways of the medial temporal lobe. Neuroimage. 2012;62(3):2065-2082.
[3] Abhinav K, Yeh FC, Pathak S et al. Advanced diffusion MRI fiber tracking in neurosurgical and neurodegenerative disorders and neuroanatomical studies: a review. Biochimica et Biophysica Acta (BBA)-Molecular Basis of Disease. 2014;1842(11):2286-2297.
[4] Tae WS, Ham BJ, Pyun SB et al. Current clinical applications of diffusion-tensor imaging in neurological disorders. Journal of Clinical Neurology. 2018;14(2):129-140.
[5] Lee JH, Lee KU, Lee DY et al. Development of the Korean Version of the Consortium to Establish a Registry for Alzheimer's Disease Assessment Packet (CERAD-K) clinical and neuropsychological assessment batteries. The Journals of Gerontology Series B: Psychological Sciences and Social Sciences. 2002;57(1):P47-P53.
[6] Bae JN, Cho MJ et al. Development of the Korean version of the Geriatric Depression Scale and its short form among elderly psychiatric patients. Journal of psychosomatic research. 2004;57(3):297-305.
[7] Woolrich MW, Jbabdi S et al. Bayesian analysis of neuroimaging data in FSL. Neuroimage. 2009;45(1):S173-S186.
[8] Jenkinson M, Bannister P, Brady M et al. Improved optimization for the robust and accurate linear registration and motion correction of brain images. Neuroimage. 2002;17(2):825-841.
[9] Zhang Y, Brady M, Smith S et al. Segmentation of brain MR images through a hidden Markov random field model and the expectation-maximization algorithm. IEEE transactions on medical imaging. 2001;20(1):45-57.
[10] Koch S, Mueller S, Foddis M et al. Atlas registration for edema-corrected MRI lesion volume in mouse stroke models. Journal of Cerebral Blood Flow & Metabolism. 2019;39(2):313-323.
[11] Shen X, Reus LM, Cox SR et al. Subcortical volume and white matter integrity abnormalities in major depressive disorder: findings from UK Biobank imaging data. Scientific reports. 2017;7(1):1-10.
Figures
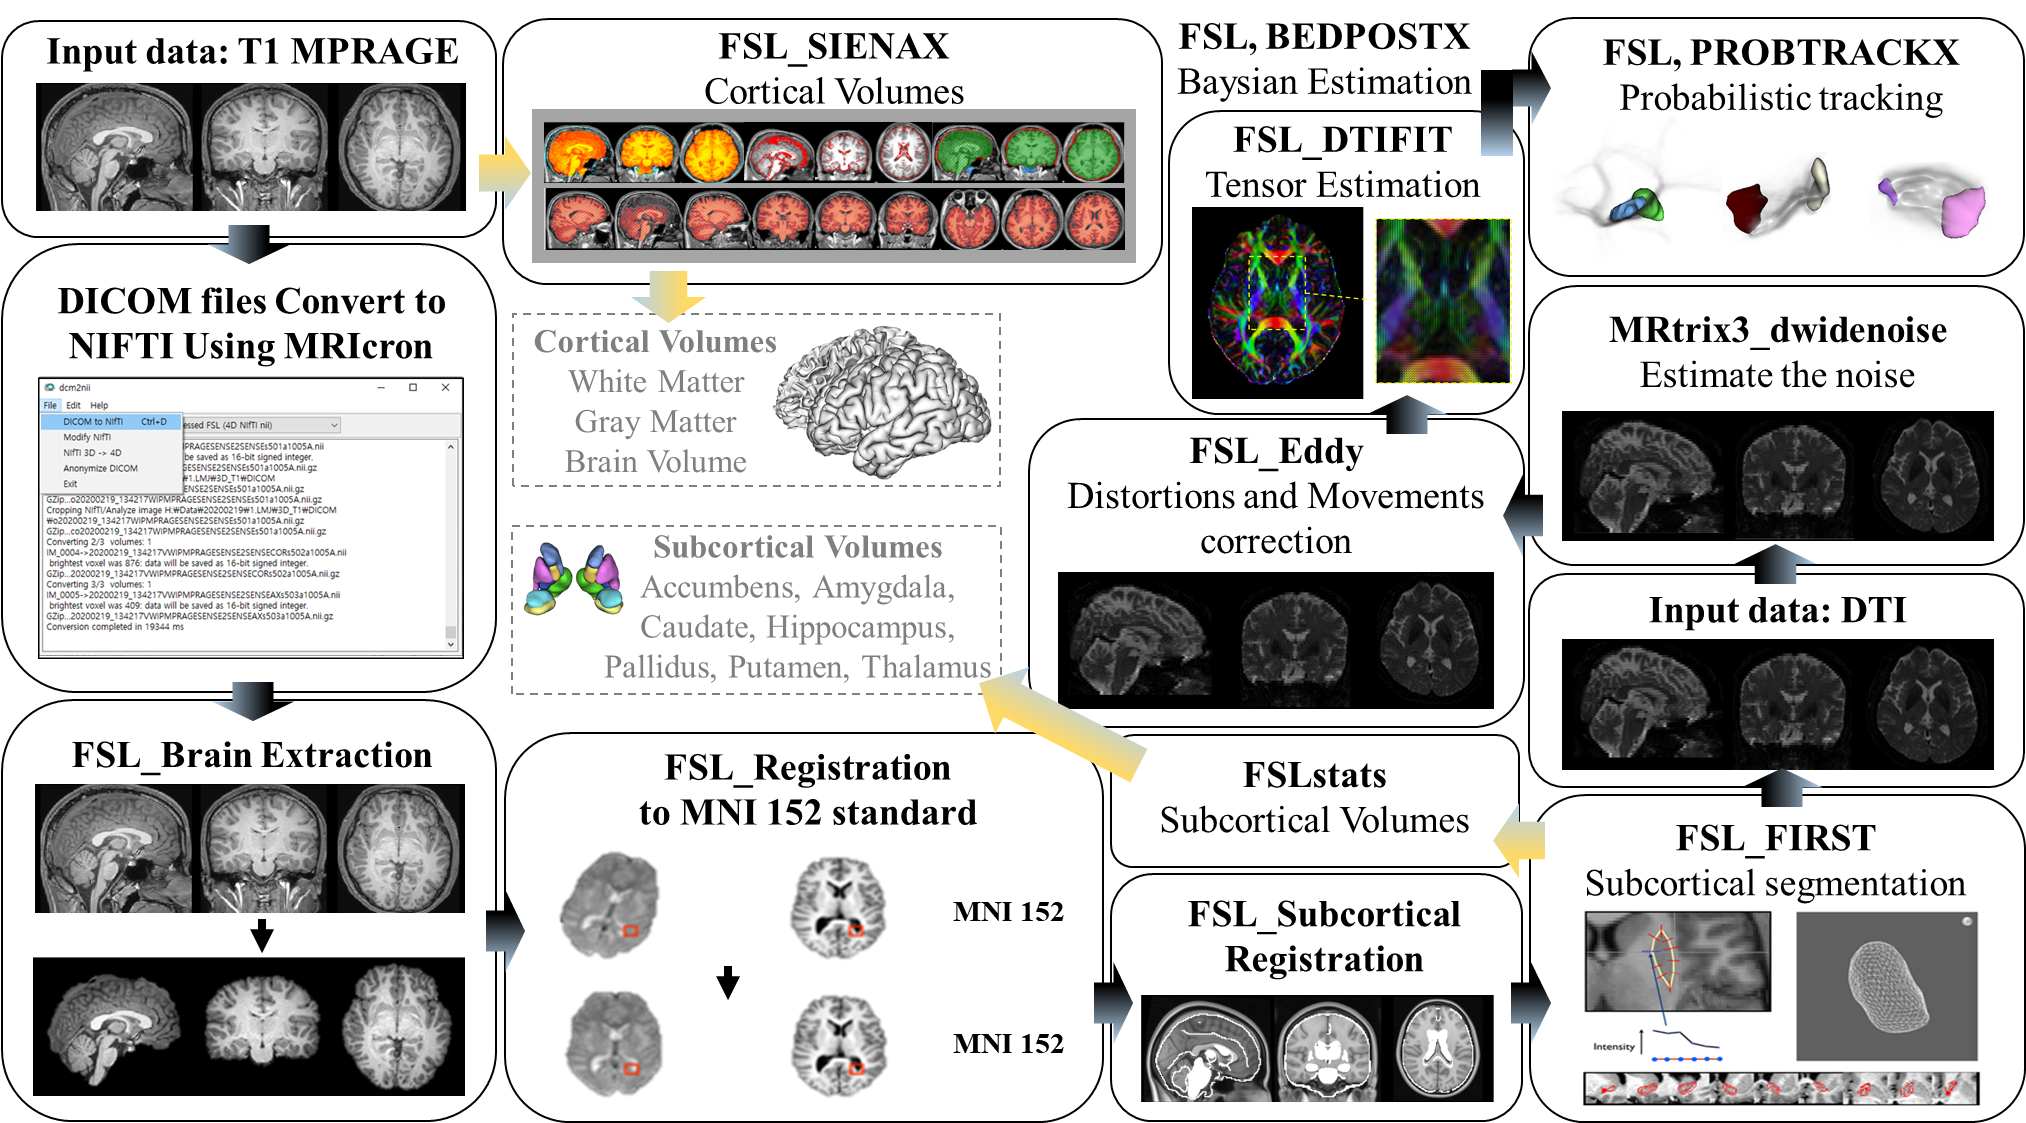
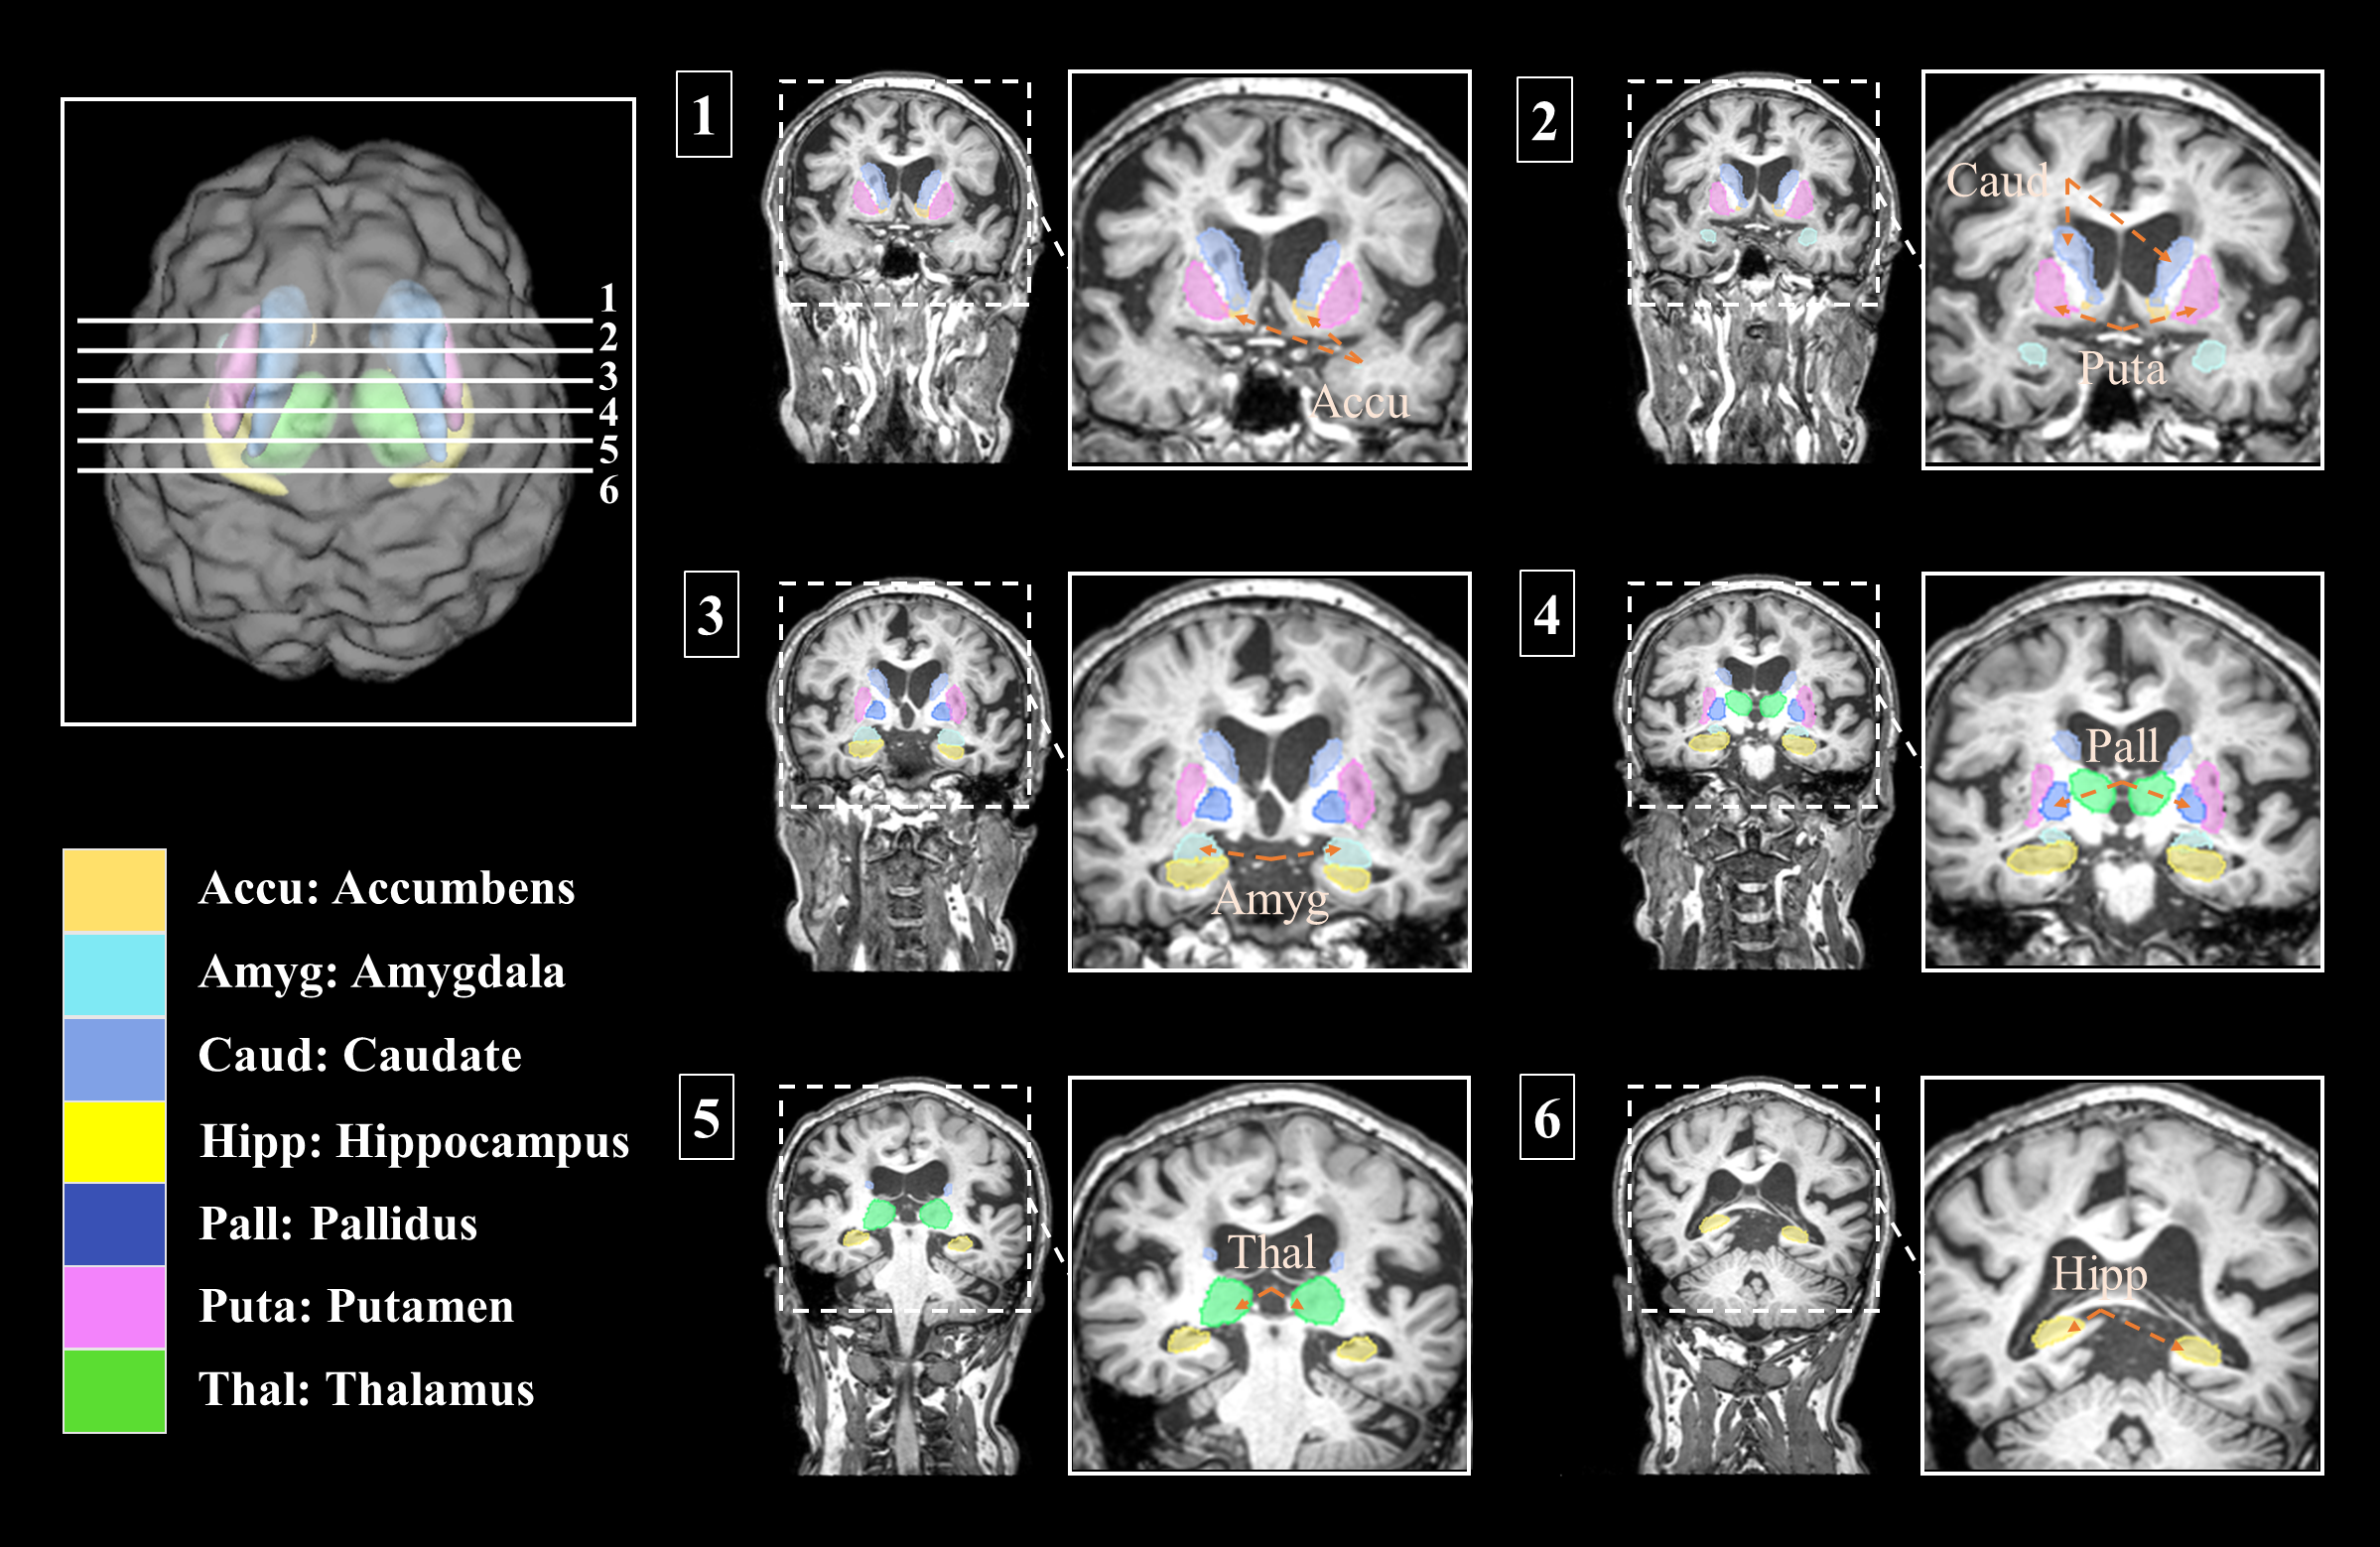
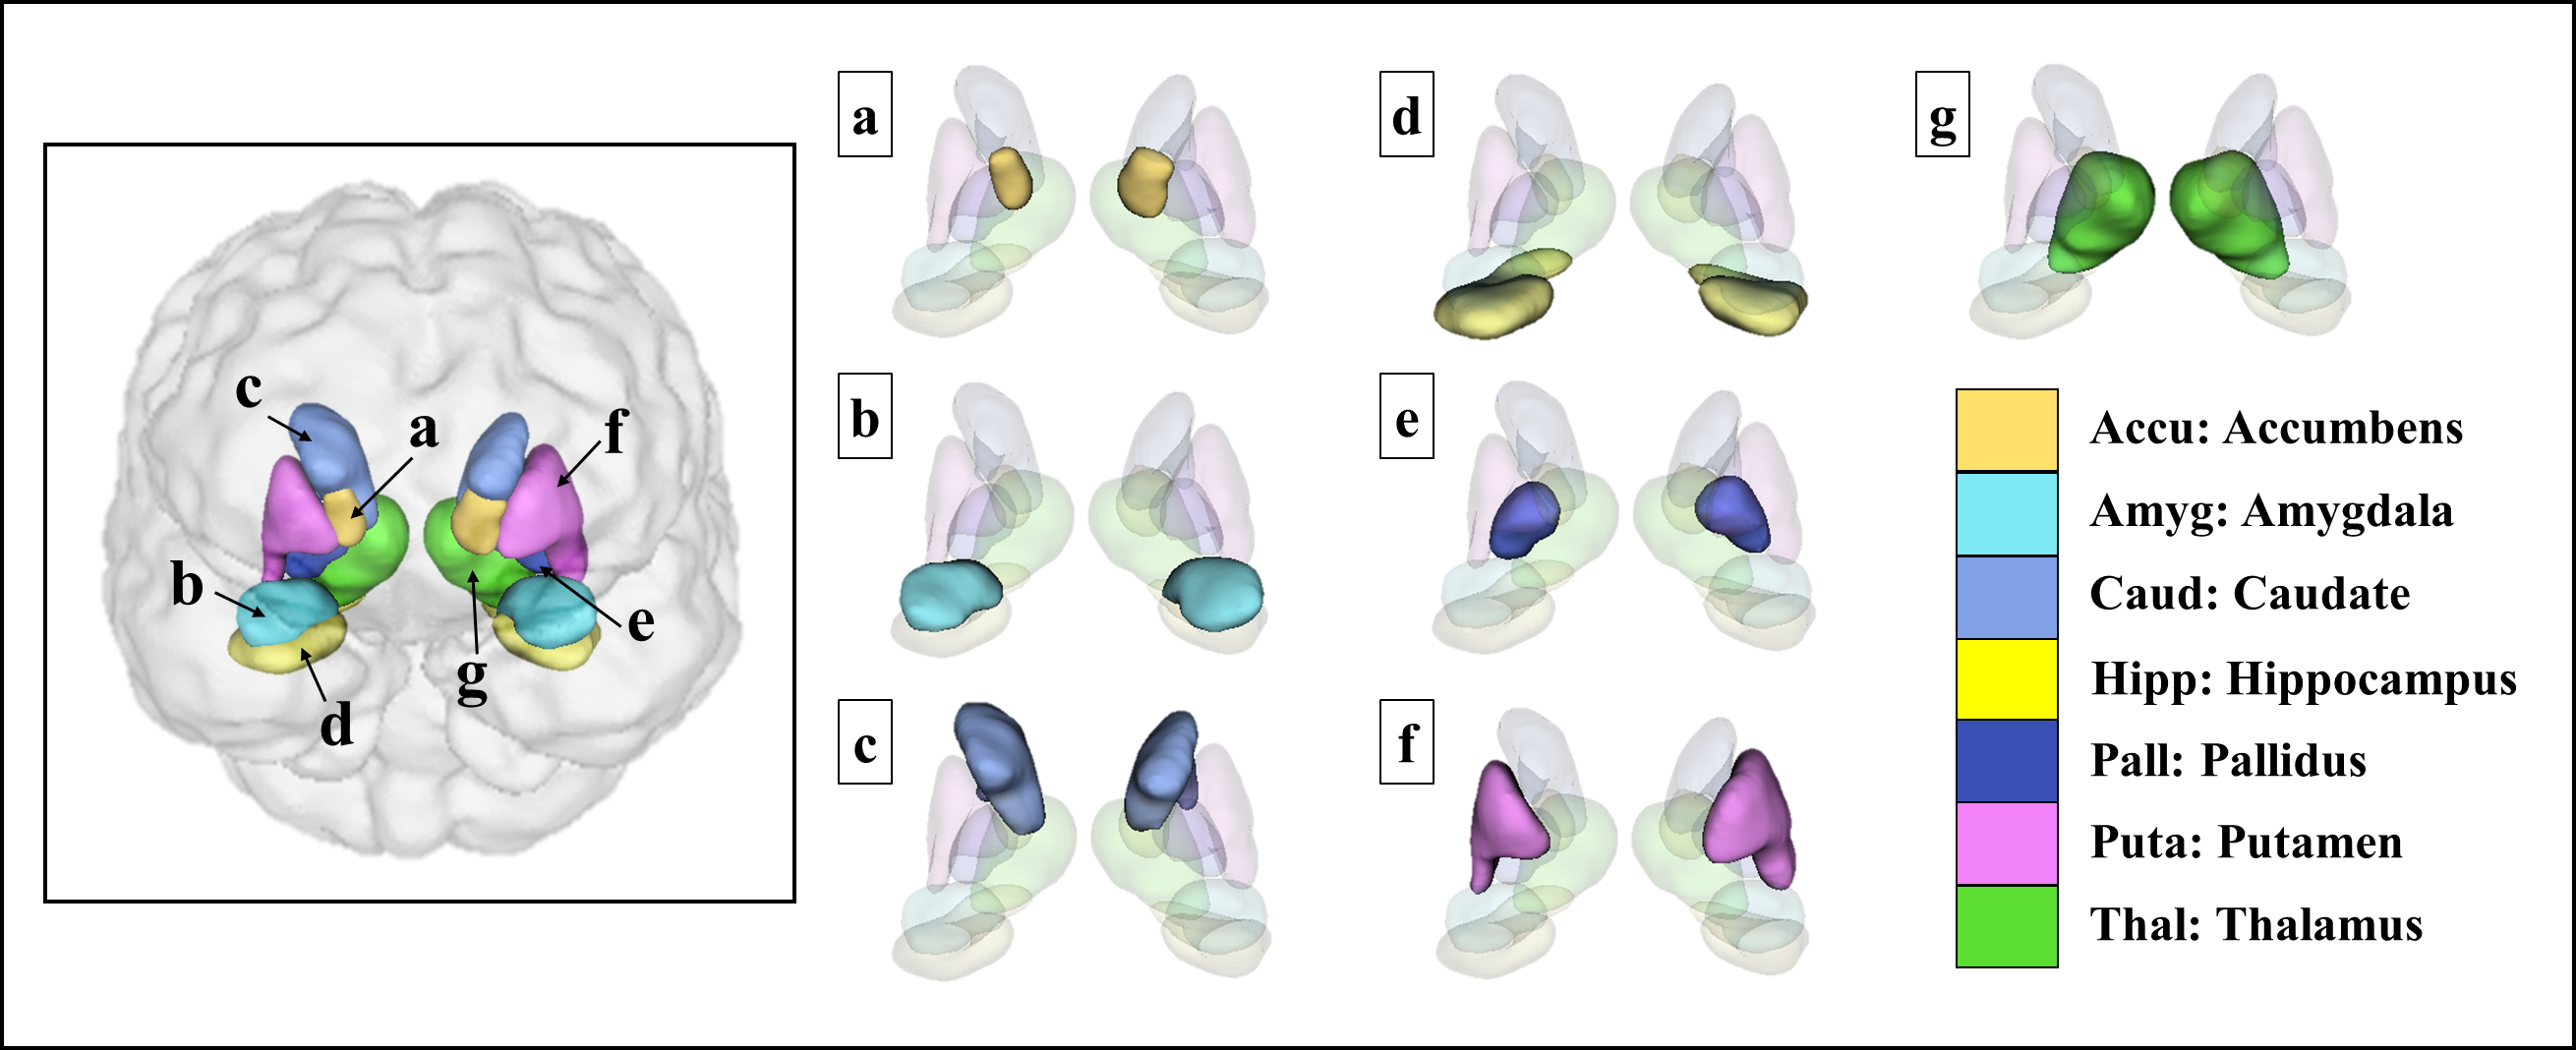
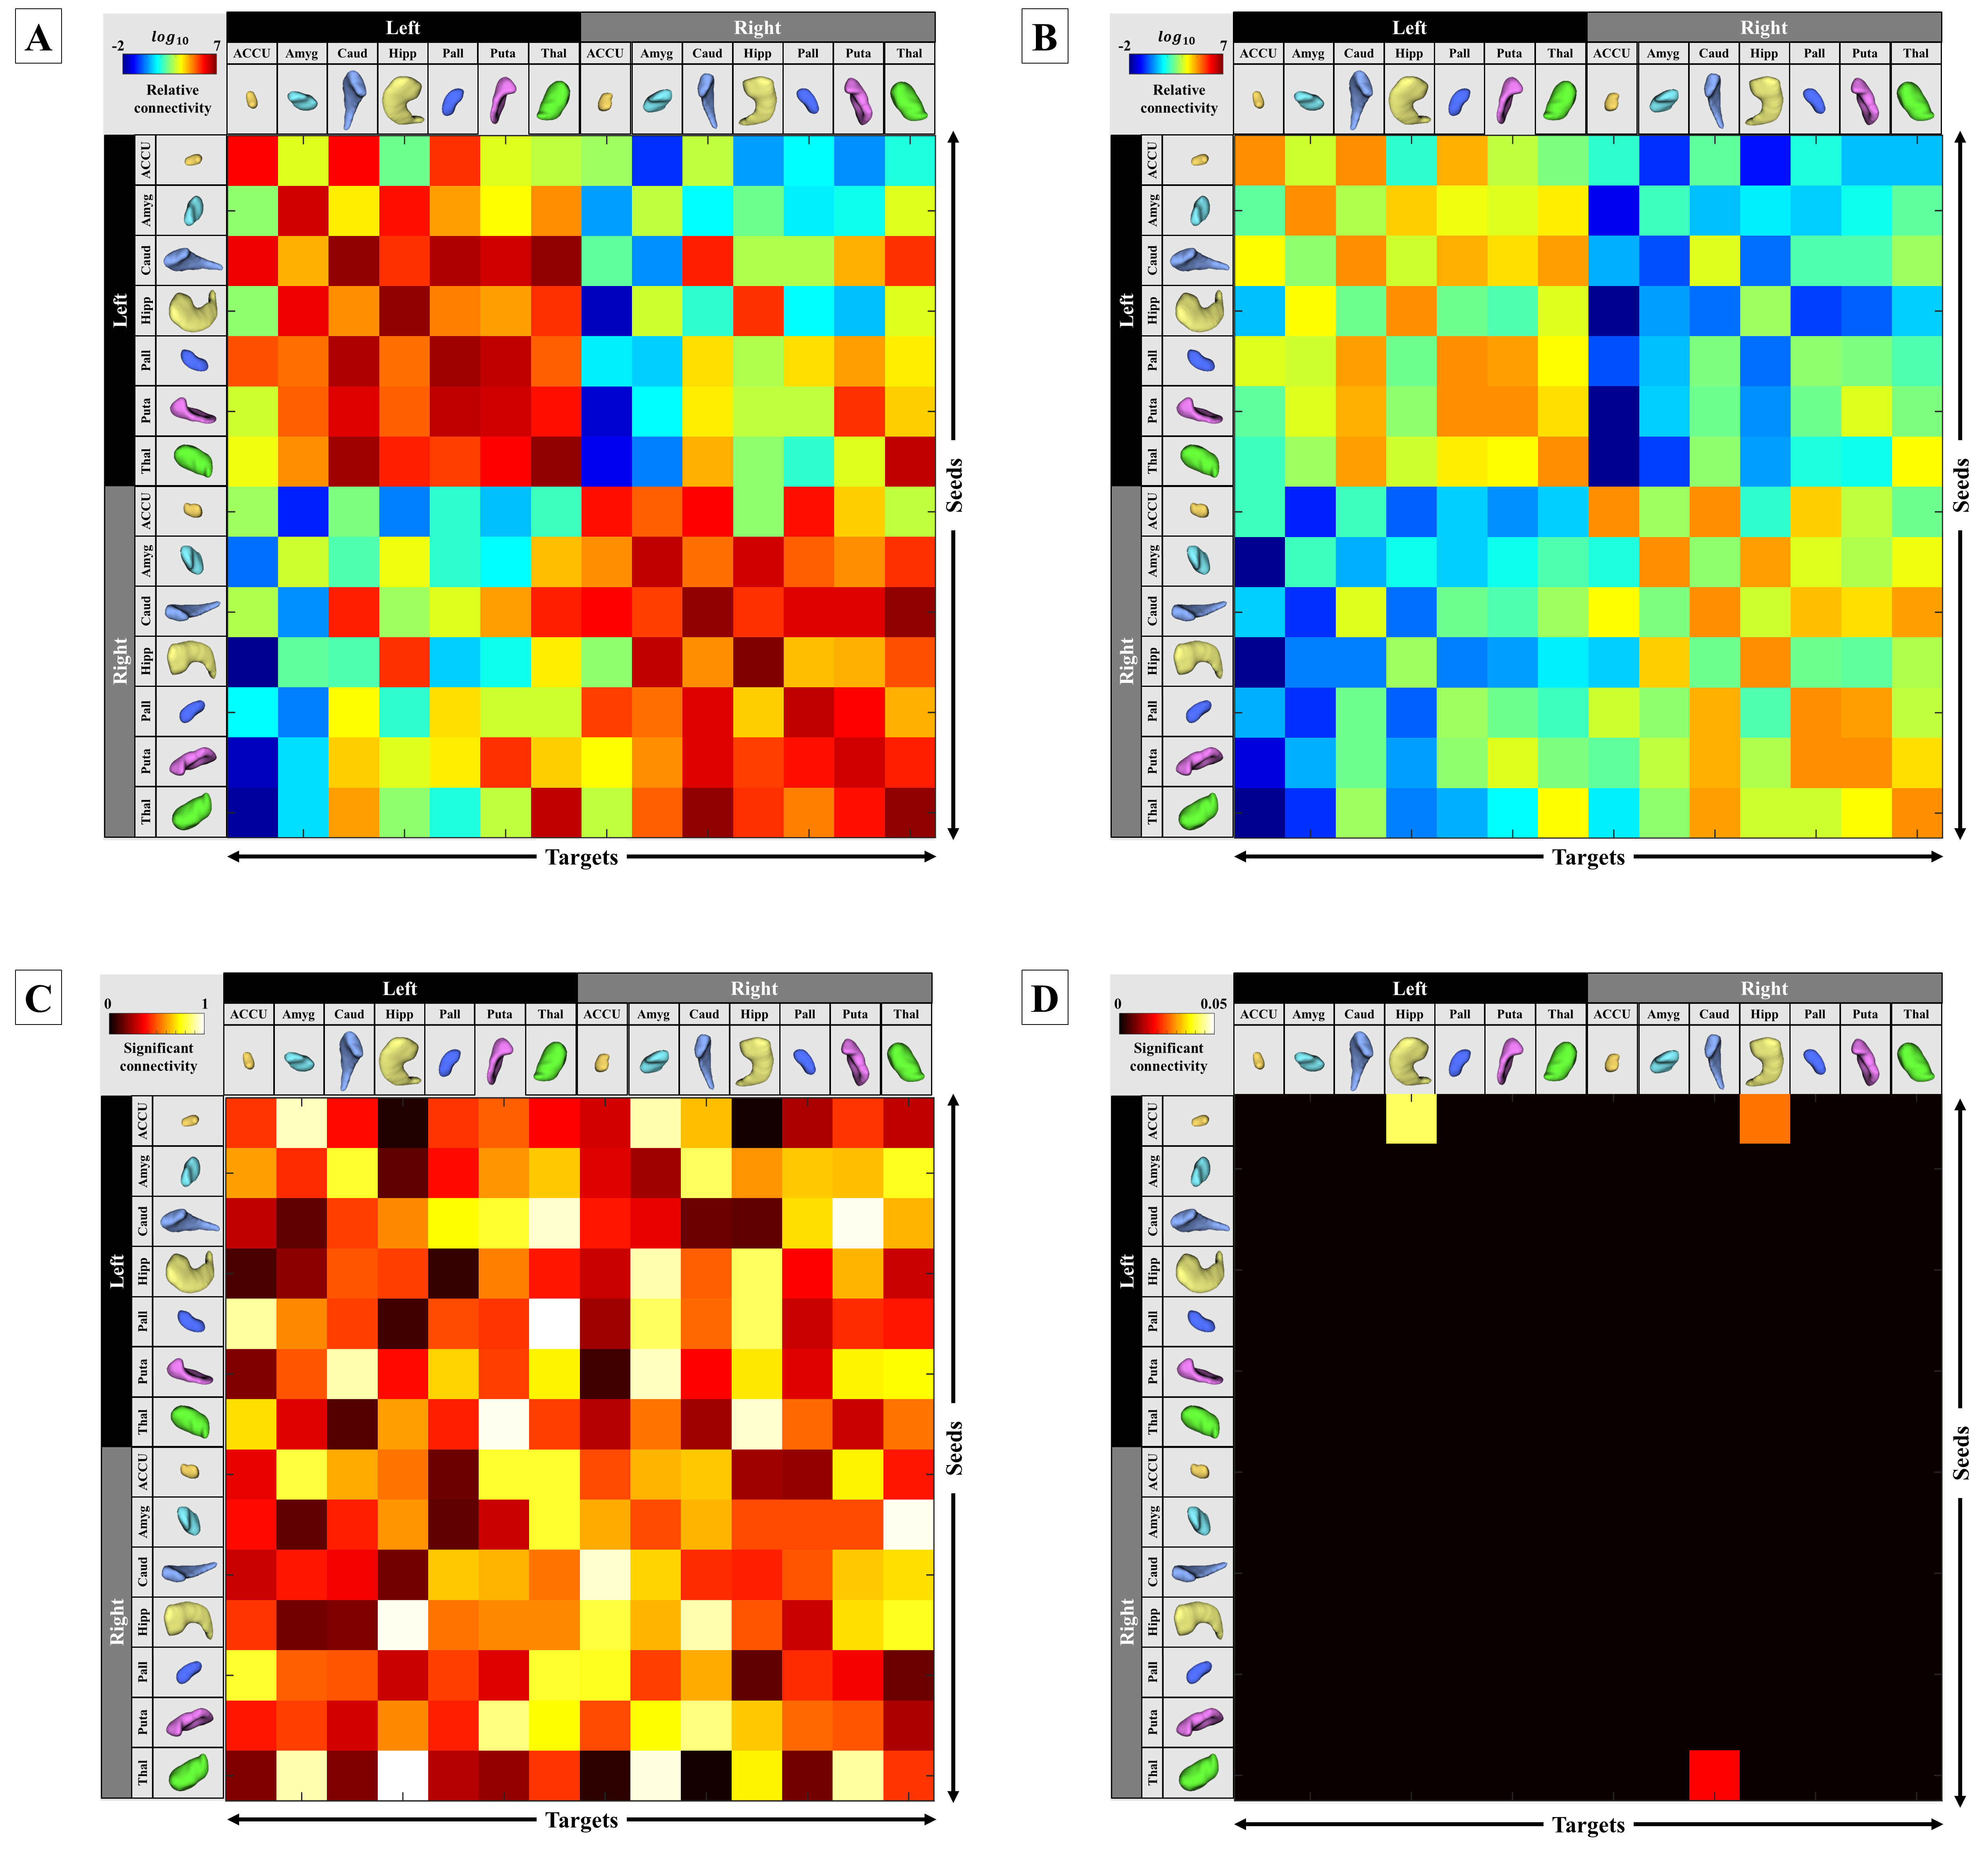
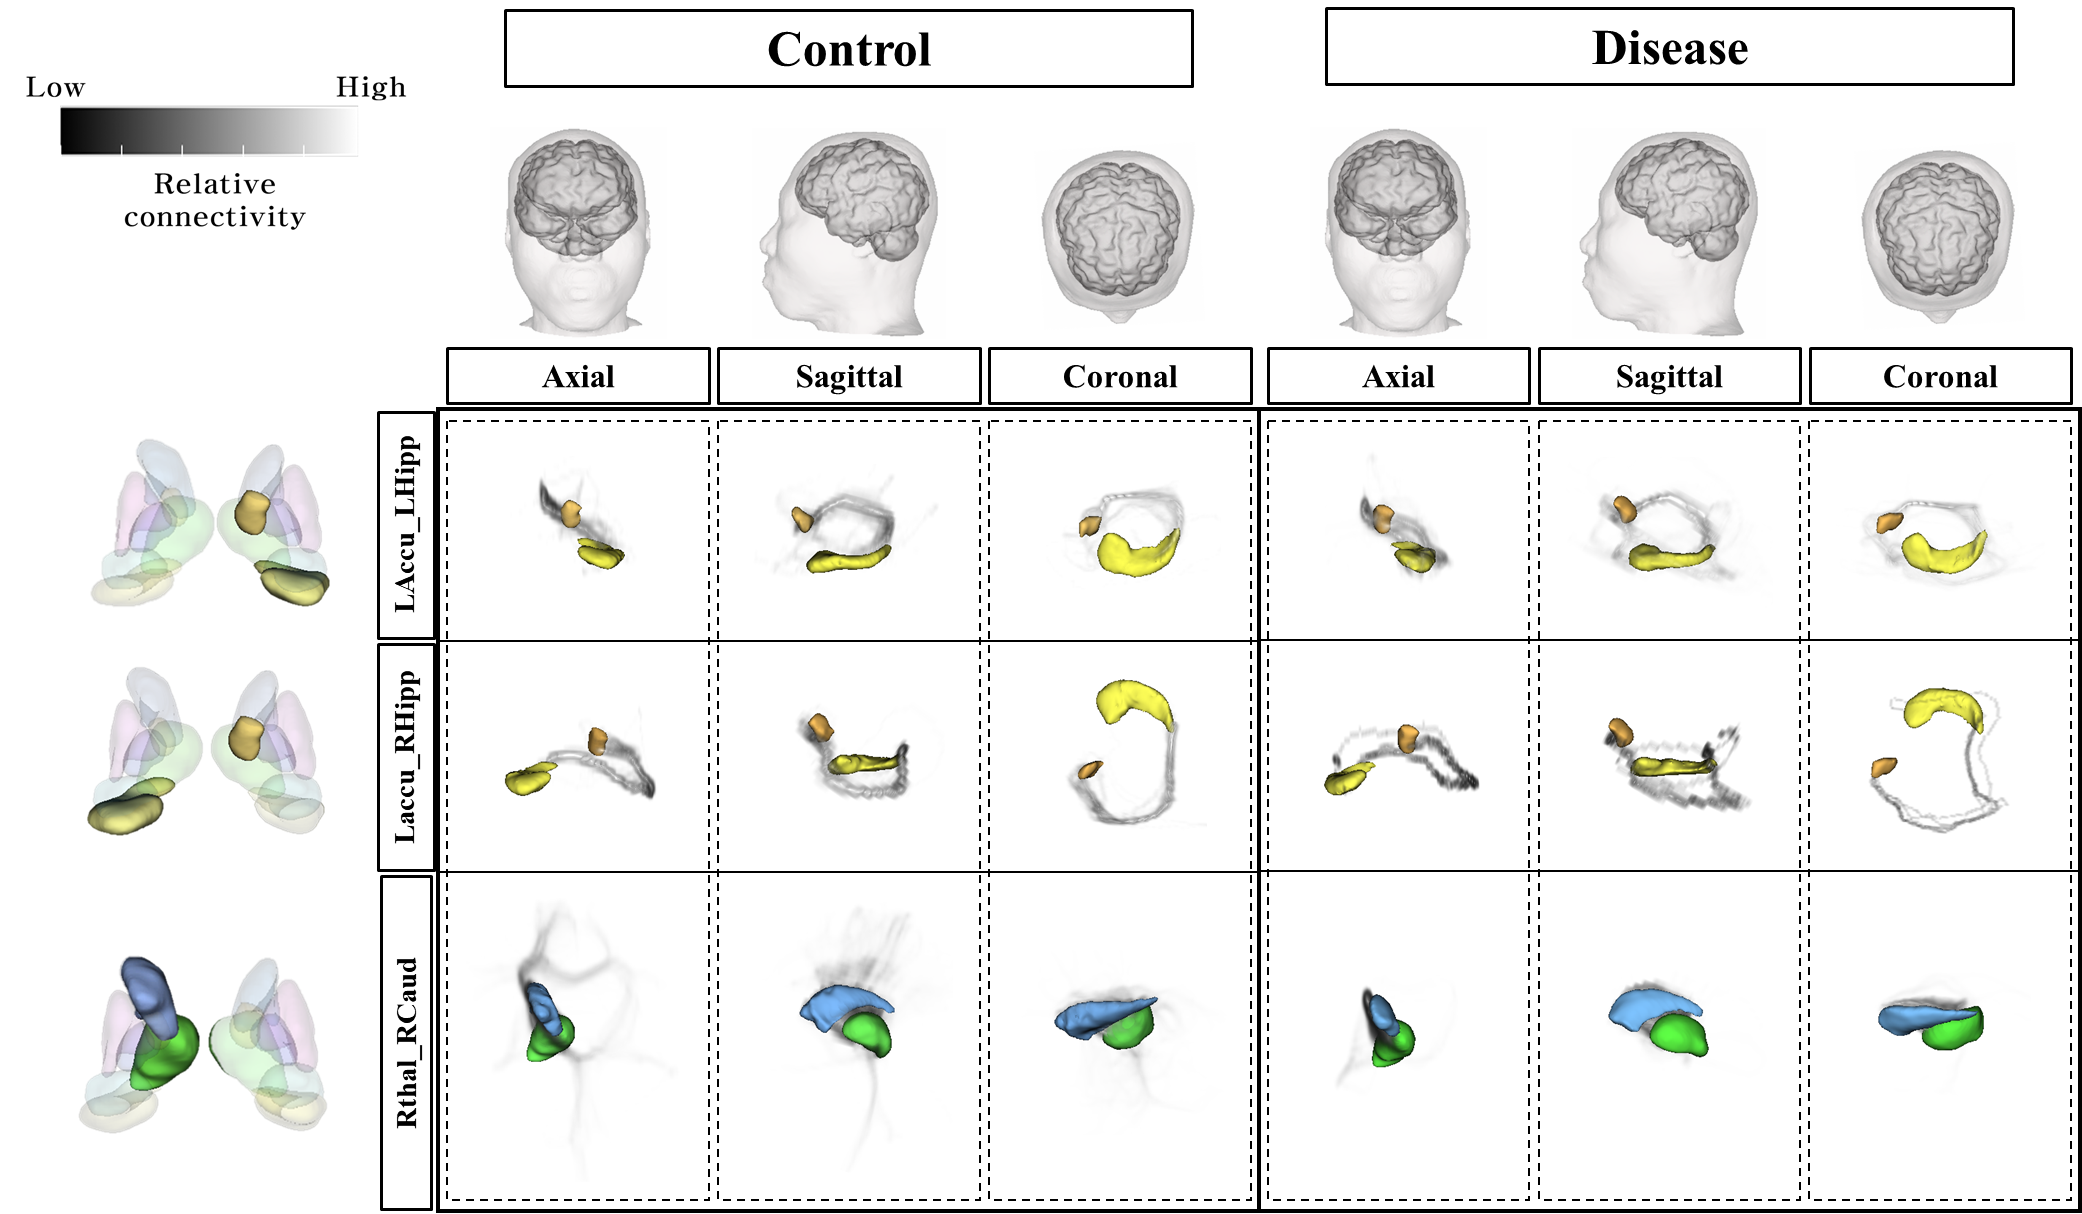

Table 1. Volume, FA and ADC of Subcortical Structures.
Volume is measured in cubic units (1 voxel = 1mm3). ADC is measured in millimeter squared per seconds (mm2/s). Displays the Significant P-value in bold type.