4306
Assessment of structural connectivity matrices sensitivity to tractography termination criteria in glioma patients1Department of Information Engineering, University of Padova, Padova, Italy, 2Padova Neuroscience Center, University of Padova, Padova, Italy, 3Department of Neuroscience, University of Padova, Padova, Italy, 4Department of Neurosurgery, University of Firenze, Firenze, Italy, 5Department of Medicine, Unit of Nuclear Medicine, University of Padova, Padova, Italy
Synopsis
Varying termination criteria values of tractography algorithms produce tangible effects on the reconstructed tractograms. While these effects are extensively documented in the state-of-the-art literature for healthy subjects, little is known about streamline reconstruction differences in presence of brain tumours. In this work we apply a statistical framework to assess the impact of the cut-off value on the resulting structural connectivity matrices in 11 patients suffering from gliomas. Results show how varying the cut-off value in the studied range does not produce significant changes in the matrix structure, thus validating literature recommendations for healthy subjects in the case of glioma patients.
Introduction
The implementation of tractography algorithms relies on the setup of several options. Among others, the track termination criterion and in particular its cut-off value is one of the most influencing parameters. In the most commonly used algorithm, the cut-off represents the fractional anisotropy amplitude or the fibre orientation distributions’ peaks amplitude under which the streamlines’ reconstruction stops [1].Considering the tracking algorithms based on Constrained Spherical Deconvolution implemented in the MRtrix software [2], current literature suggests a cut-off value of 0.1. In healthy subjects, such a value has been shown to allow the reconstruction of reliable tractograms both in terms of tracts visual inspection and of comparison with actual brain anatomy [1]. This threshold represents a compromise between specificity and sensitivity of the obtained reconstructions [3][4].
Structural connectivity (SC) matrices based on white matter tracts quantified by tractography have been recently proposed as an appropriate tool to assess impact of tumours on the patient’s whole brain connectivity [5]. However, currently no studies have evaluated the sensitivity of the SC matrices to the cut-off values.
Thus, the aim of this work was to verify that the tract termination criterion default cut-off value was suitable for studies on gliomas patients, and that it does not affect the estimates of SC matrices.
Methods
11 patients affected by glioma at different grades (from grade I to IV) and positions were included in our dataset. Diffusion weighted images (DWI) were acquired with a 3T Siemens Biograph mMR scanner following to the optimized NODDI protocol [6] (TR/TE5355ms/104ms; 2x2x2mm).DWI data standard pre-processing, tractography and SC computation have been performed with the MRtrix [2] software. For each patient, we reconstructed six different tractograms using the iFOD2 algorithm [7], 100 millions of streamlines, the gray/white matter interface as seeding area, and six different values of cut-off (0.1, 0.09, 0.08, 0.07, 0.06, 0.05). Anatomically Constrained Tractography [8] was applied excluding the binary tumour mask from the application of anatomical priors. The final number of tractogram streamlines was reduced to 10 millions by pruning of unreliable streamlines via the spherical-deconvolution informed filtering of tractogram (SIFT) framework [9]. For each patient and tractogram we computed both the SC matrix based on the Number of streamlines (SCNS) and the SC matrix based on the Mean streamline length (SCMSL) as metrics. Cortical parcels have been defined according to the Schaefer functional atlas (200 parcels, i.e., 100 regions per hemisphere) [10]. Connections consisting in only one streamline in SCNS has been considered physiologically implausible and thus set to zero in both SCNS and SCMSL. To assess the impact of the cut-off value on the SCNS and SCMSL we applied the principal component analysis (PCA) and the Krzanowsky test [11] separately on the two matrices. Concerning PCA, the analysis was performed to evaluate whether there was a common structure across the SC matrices obtained at different cut-off values at the single subject level. Specifically, PCA has been computed separately for each patient using the upper triangular values of the SC matrices. Besides PCA, the Krzanowsky test has been used to test the hypothesis that the two population SC matrices obtained respectively with a cut-off value of 0.1 and of 0.05 (the extreme values of the cut-off range) shared similar eigenvectors and eigenvalues. We used here 1000 permutations and a significance value of 0.05.
Results&Discussion
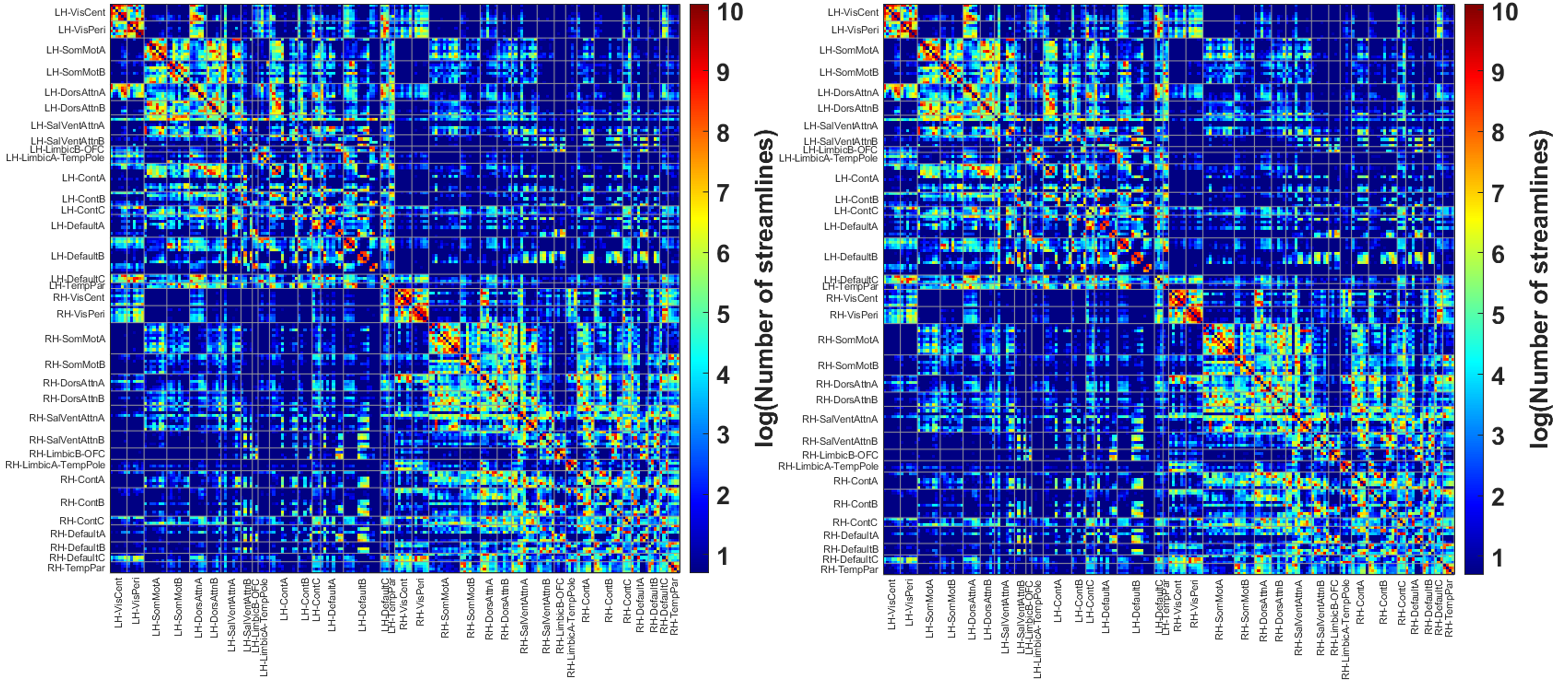
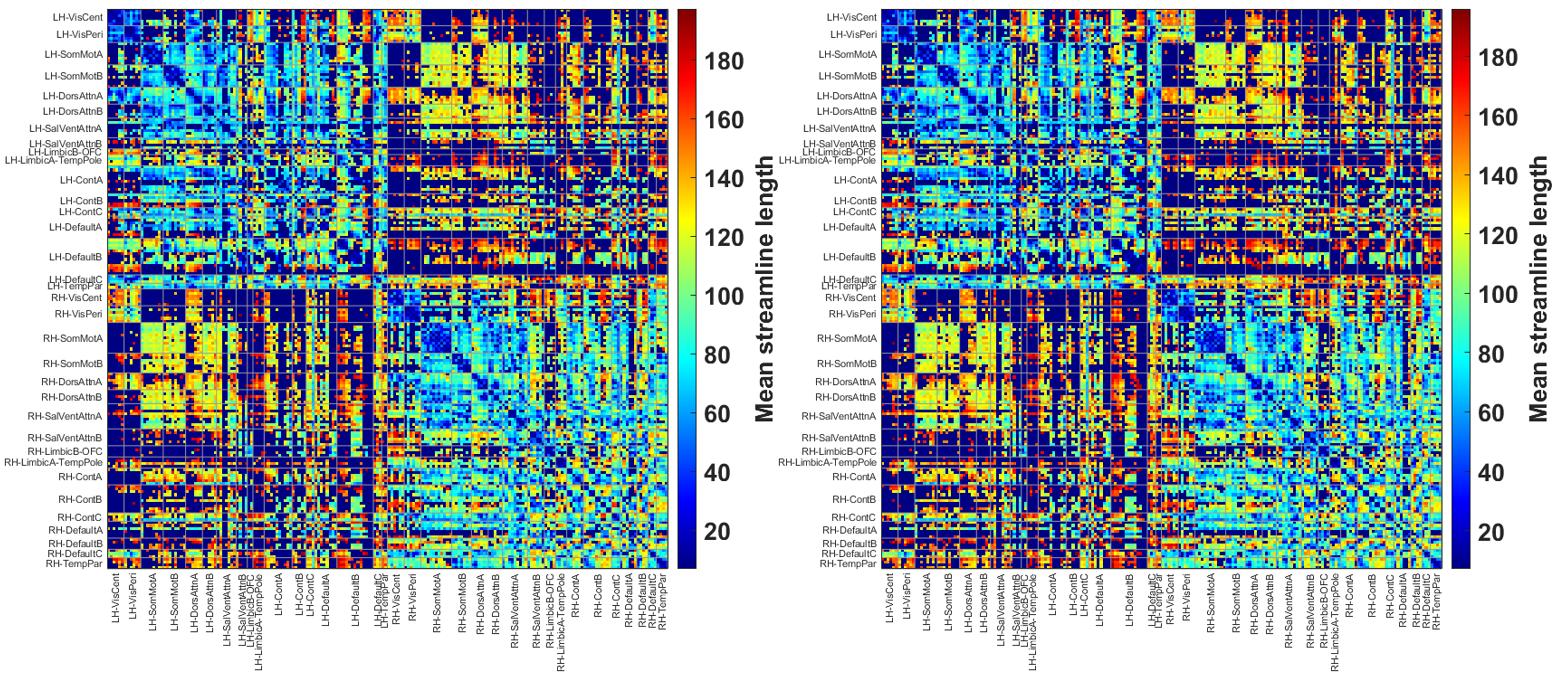
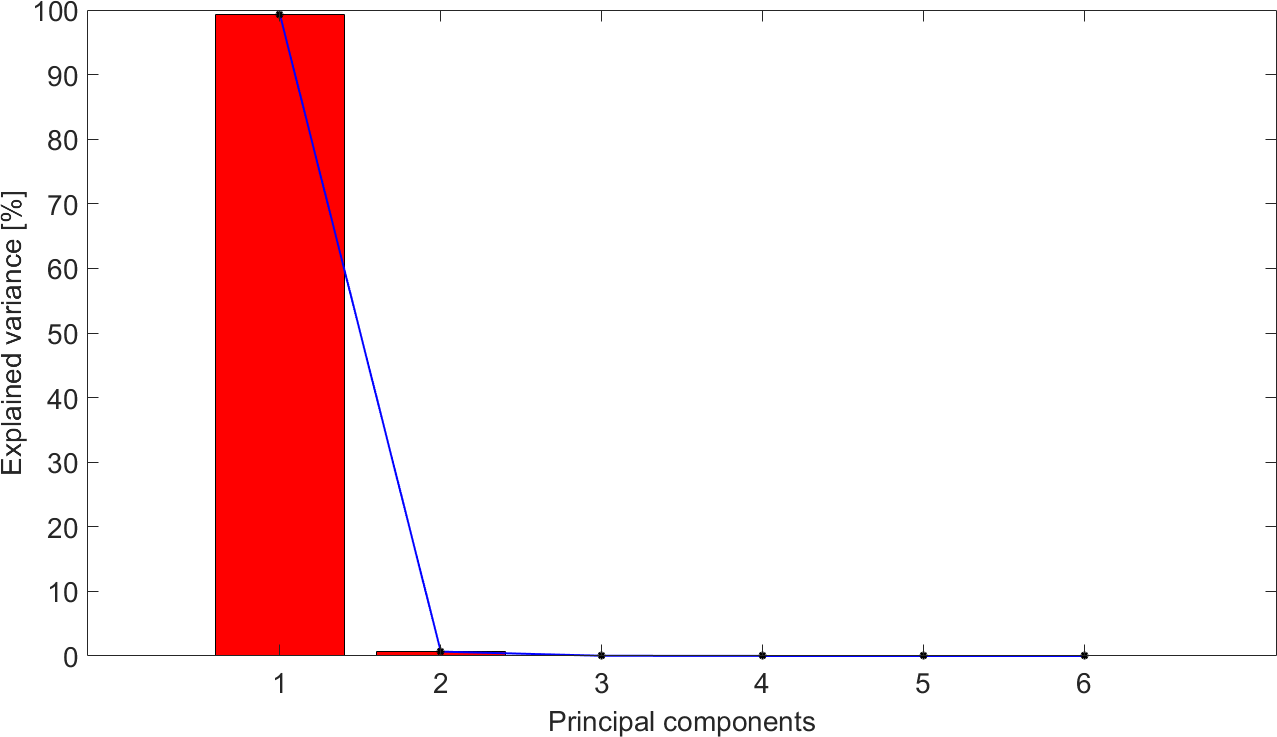
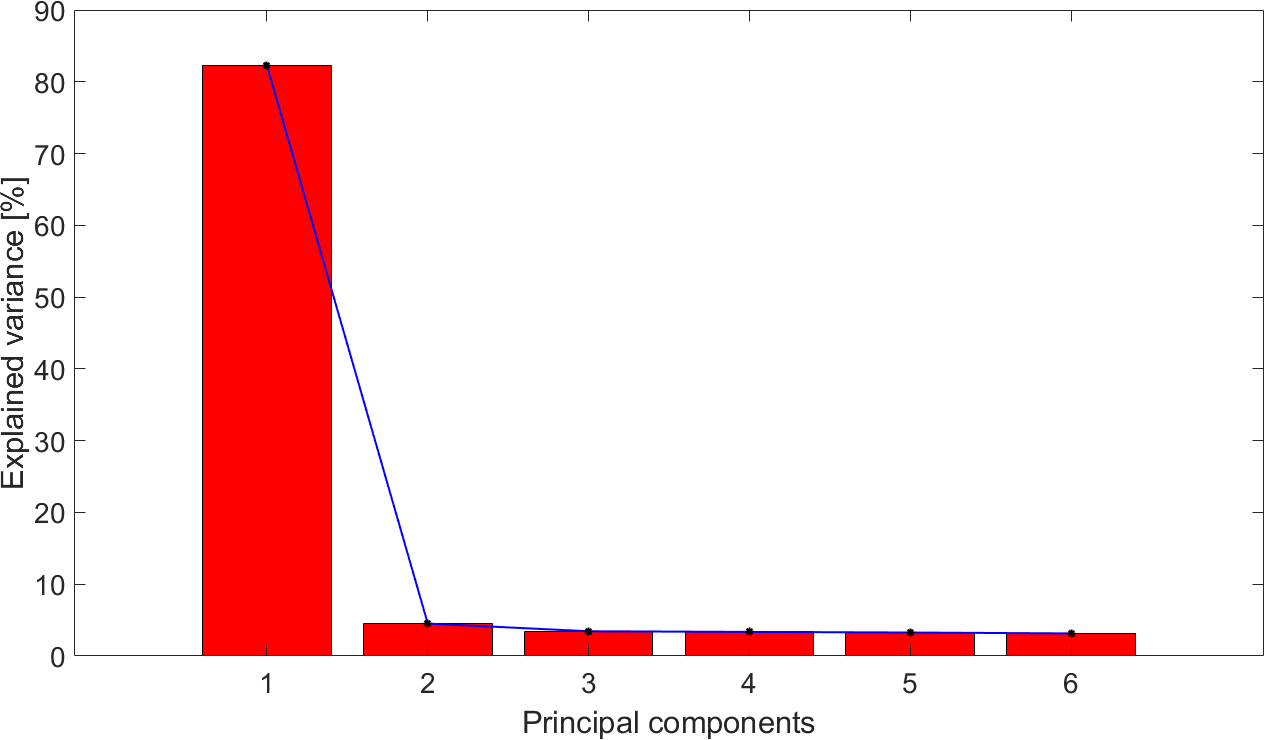
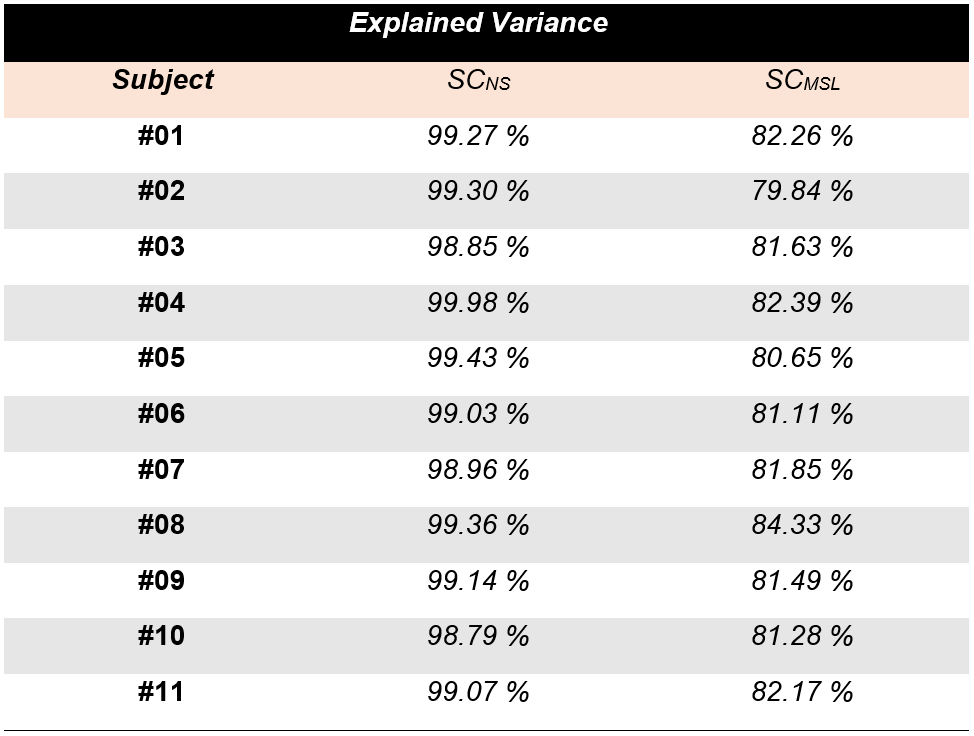
Figure 1 and Figure 2 show respectively the SCNS and SCMSL matrices obtained for a representative patient using a cut-off value of 0.1 and of 0.05. By visual inspection no clear difference between the two cut-offs can be highlighted.For each patient, Table 1 reports the variance explained (EV) by the first principal component (PC1) obtained with the PCA on both SCNS and SCMSL. EV is equal on average to 99.2% (STD 0.33%) for the SCNS matrix and to 81.73% (STD 1.14%) for the SCMSL matrix. In addition, in all patients the variance explained by the second principal component computed on the SCNS and on the SCMSL matrices is respectively lower than 1% and 5% (EVs of the principal components of a representative subject for each metric are reported in Figure 3 and Figure 4). These results suggest the presence of a strong common structure across the SC matrices.
The PCA results are confirmed at the group level by the Krzanowski test, where no statistically significant differences have been found between the two distributions with a p-value of 0.87 and 0.38 for respectively the SCNS and SCMSL matrices.
Conclusions
Considering the obtained results, lowering the cut-off down to a value of 0.05 does not significantly affect the structure of the SC matrices. Therefore, when performing structural connectivity studies on glioma patients, the tract termination criterion default cut-off value suggested in literature for healthy subjects can be reliably applied on this cohort of patients too.Acknowledgements
No acknowledgement found.References
[1] J. D. Tournier, F. Calamante, and A. Connelly, “MRtrix: Diffusion tractography in crossing fiber regions,” Int. J. Imaging Syst. Technol., vol. 22, no. 1, pp. 53–66, 2012, doi: 10.1002/ima.22005.
[2] J. D. Tournier et al., “MRtrix3: A fast, flexible and open software framework for medical image processing and visualisation,” Neuroimage, vol. 202, no. August, p. 116137, 2019, doi: 10.1016/j.neuroimage.2019.116137.
[3] B. Jeurissen, A. Leemans, D. K. Jones, J. D. Tournier, and J. Sijbers, “Estimating the number of fiber orientations in diffusion MRI voxels: a constrained spherical deconvolution study,” Proc. Int. Soc. Magn. Reson. Med., vol. 18, no. 5, p. 573, 2010.
[4] B. Jeurissen, A. Leemans, D. K. Jones, J. D. Tournier, and J. Sijbers, “Probabilistic fiber tracking using the residual bootstrap with constrained spherical deconvolution,” Hum. Brain Mapp., vol. 32, no. 3, pp. 461–479, 2011, doi: 10.1002/hbm.21032.
[5] Y. Liu et al., “Altered Rich-Club Organization and Regional Topology Are Associated With Cognitive Decline in Patients With Frontal and Temporal Gliomas,” Front. Hum. Neurosci., vol. 14, no. February, pp. 1–13, 2020, doi: 10.3389/fnhum.2020.00023.
[6] H. Zhang, T. Schneider, C. A. Wheeler-Kingshott, and D. C. Alexander, “NODDI: Practical in vivo neurite orientation dispersion and density imaging of the human brain,” Neuroimage, vol. 61, no. 4, pp. 1000–1016, 2012, doi: 10.1016/j.neuroimage.2012.03.072.
[7] J.-D. Tournier and and a. C. , F. Calamante, “Improved probabilistic streamlines tractography by 2 nd order integration over fibre orientation distributions,” Ismrm, vol. 88, no. 2003, p. 2010, 2010.
[8] R. E. Smith, J. D. Tournier, F. Calamante, and A. Connelly, “Anatomically-constrained tractography: Improved diffusion MRI streamlines tractography through effective use of anatomical information,” Neuroimage, vol. 62, no. 3, pp. 1924–1938, 2012, doi: 10.1016/j.neuroimage.2012.06.005.
[9] R. E. Smith, J. D. Tournier, F. Calamante, and A. Connelly, “SIFT: Spherical-deconvolution informed filtering of tractograms,” Neuroimage, vol. 67, pp. 298–312, 2013, doi: 10.1016/j.neuroimage.2012.11.049.
[10] A. Schaefer et al., “Local-Global Parcellation of the Human Cerebral Cortex from Intrinsic Functional Connectivity MRI,” Cereb. Cortex, vol. 28, no. 9, pp. 3095–3114, 2018, doi: 10.1093/cercor/bhx179.
[11] W. J.
Krzanowski, “Permutational tests for correlation matrices,” Stat. Comput.,
vol. 3, no. 1, pp. 37–44, 1993, doi: 10.1007/BF00146952.
Figures