4305
Quantitative evaluation of white matter tracts reconstruction with an anatomically curated atlas in patients with brain tumours1Padova Neuroscience Center, University of Padova, Padova, Italy, 2Department of Information Engineering, University of Padova, Padova, Italy, 3Department of Neuroscience, University of Padova, Padova, Italy, 4Department of Neurosurgery, University of Firenze, Firenze, Italy, 5Department of Medicine, Unit of Nuclear Medicine, University of Padova, Padova, Italy
Synopsis
We propose an application of the open-source whitematteranalysis software which moves a step towards the goal of reproducible and quantitative evaluation of anatomical tracts reconstruction by dMRI tractography. We quantify the tractogram in 11 patients suffering from brain tumours with four different algorithms, perform the automated spectral clustering procedure implemented in the software and evaluate simple metrics to compare the tractograms to an available anatomically curated atlas. Independently from the tumour position, the four investigated algorithms failed to properly reconstruct certain anatomical tracts. Evaluating the overall streamline representation of all tracts, the iFOD2 algorithm was found to perform best.
Introduction
The physiological plausibility of axonal fibers reconstructed by diffusion-MRI (dMRI) is a central problem for the clinical application of tractography algorithms [1]. The diffidence against these techniques is exarcerbated by the presence of a plethora of possible options, amongst which the choice of the underlying diffusion model and the sampling method of the diffusion orientation play an important rol. In the present work, we investigate an atlas-based method for objectively comparing different tractography strategies in a pathological dataset in terms of how accurately white matter tracts are reconstructed.Methods
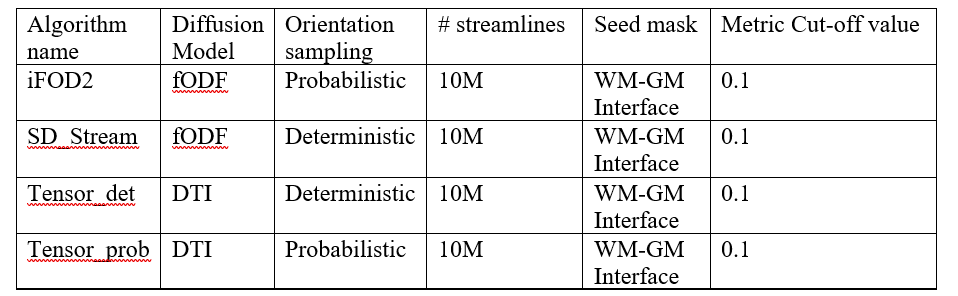
The procedure we explain here consists in employing suitable metrics to compare a given tractogram to an anatomically curated atlas of reference. We firstly reconstructed the whole-brain tractograms in 11 brain tumours patients with four different algorithms. Diffusion images were acquired on a 3T Siemens Biograph mmR MR/PETscanner with the optimized NODDI protocol [2] (TR/TE5355ms/104ms; 2x2x2mm). All volumes were scanned in both Anterior-Posterior and Posterior-Anterior phase encoding directions for preprocessing needs [3]. Anatomically constrained tractography [4] was performed entirely within the MRtrix software; tractography details are given in Table 1. The subjects’ neoplasies were heterogeneous in terms of WHO grading and location within the brain. With the tools provided by the open-source whitematteranalysis package [5], we performed the implemented spectral clustering procedure [6] to automatically reconstruct 73 deep white matter tracts (the complete list of segmented tracts can be found in [7]). Clustering was performed independently for each of the algorithms of Table 1. Reconstruction and physiological validation of the anatomical pathways with the present software was previously tested in recent brain tumour studies[8].The atlas we use for the comparison is publicly available and is explained in detail in [7]: it is composed of a high number of subjects and features a subsequent manual annotation of anatomical segments by expert neuroanatomists. Moreover, this streamline-based atlas was created with a two-tensor unscented Kalman filter tractography [9], an option which is not object of our comparisons, thus eliminating any same-algorithm-tracking bias.
For each tractogram, we wish to understand how the streamlines are subdivided into each defined bundle and compare this distribution to the one of the anatomically curated atlas. Mathematically, for any given tract, let $$$n_{t}(alg)$$$ be the number of streamlines which the clustering procedure assigned to the anatomical tract $$$t$$$ from the original tractogram quantified with algorithm $$$alg$$$. We then define the normalized number of streamlines of the anatomical tract as:
$$p_{t}(alg)= \frac{n_{t}(alg)}{\sum_{t \in T} n_{t}(alg)}$$
Where $$$T$$$ is the set of all the 73 clustered tracts in [6]. Such a normalization is necessary even in the case of input tractograms having an equal number of streamlines, as the outlier rejection procedure present in whitematteranalysis may behave differently in dependence of the tracking algorithm used. We then define the normalized ratio of streamlines of the anatomical tract as:
$$r_{t}(alg)= \frac{p_{t}(alg)}{p_{t}(atlas)}$$
Examining the different $$$r_{t}(alg)$$$ gives an understanding of how a given tract is under/overrepresented in terms of number of streamlines with respect to the anatomically curated atlas of our choice (i.e. $$$r_{CST}(alg)>>1$$$ highlights how the given tractogram employs a higher portion of its total number of streamlines to represent the Cortico-Spinal Tract with respect to the anatomically curated atlas). By quantifying $$$r_{t}$$$ in our dataset, we wish to understand which of the algorithms in Table 1 comes closer to the atlas representation in terms of streamlines anatomical distribution.
Results&Discussion
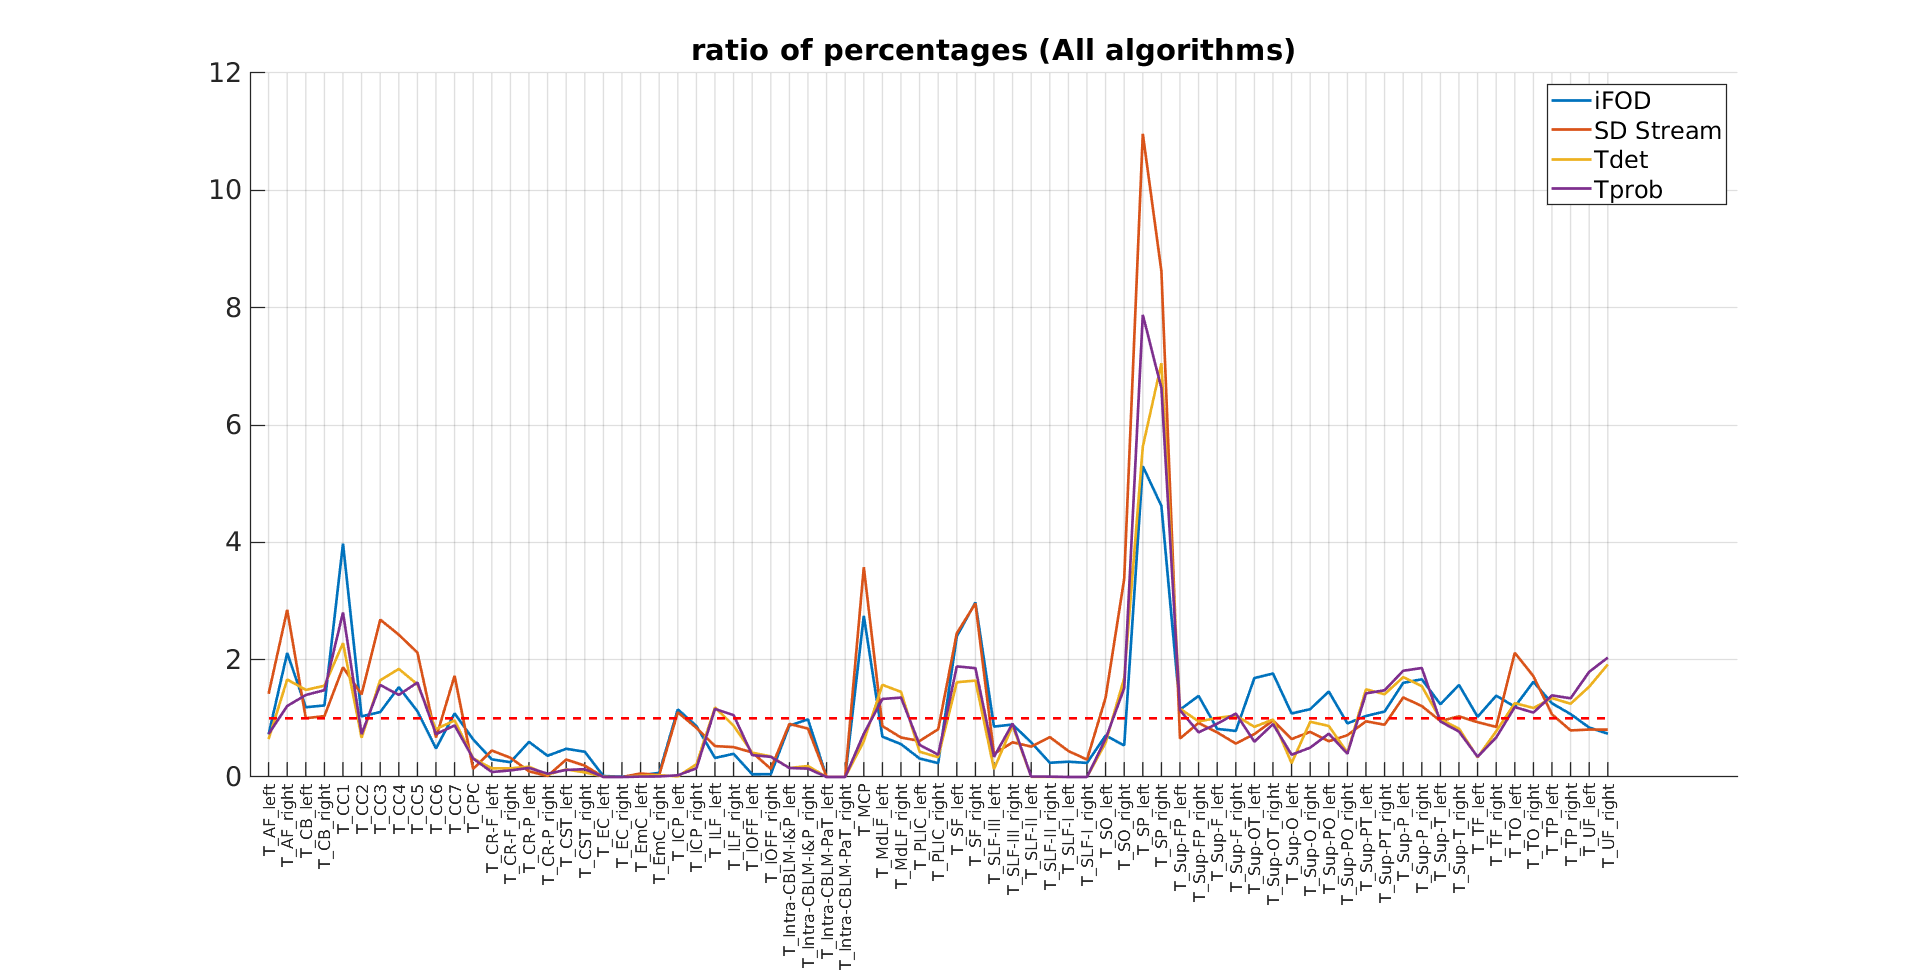
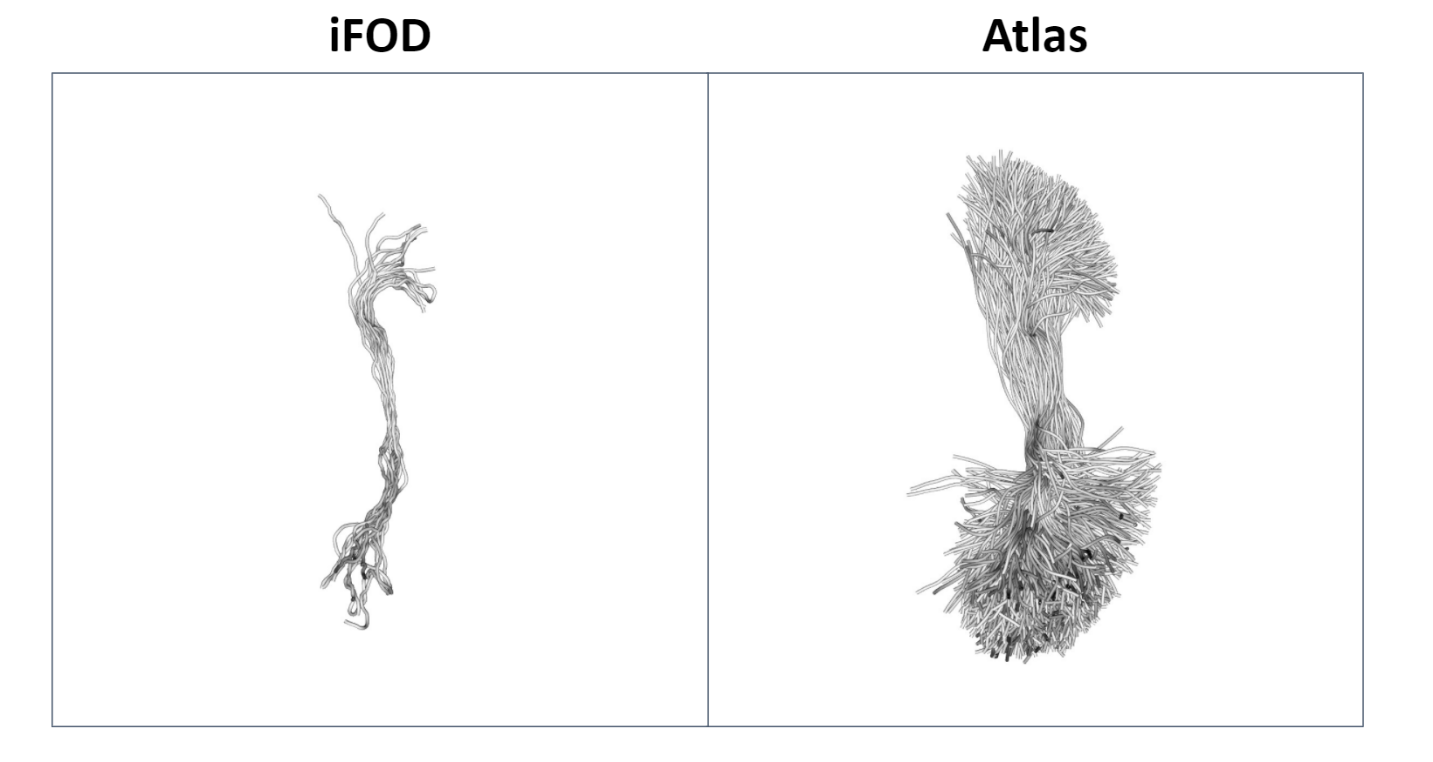
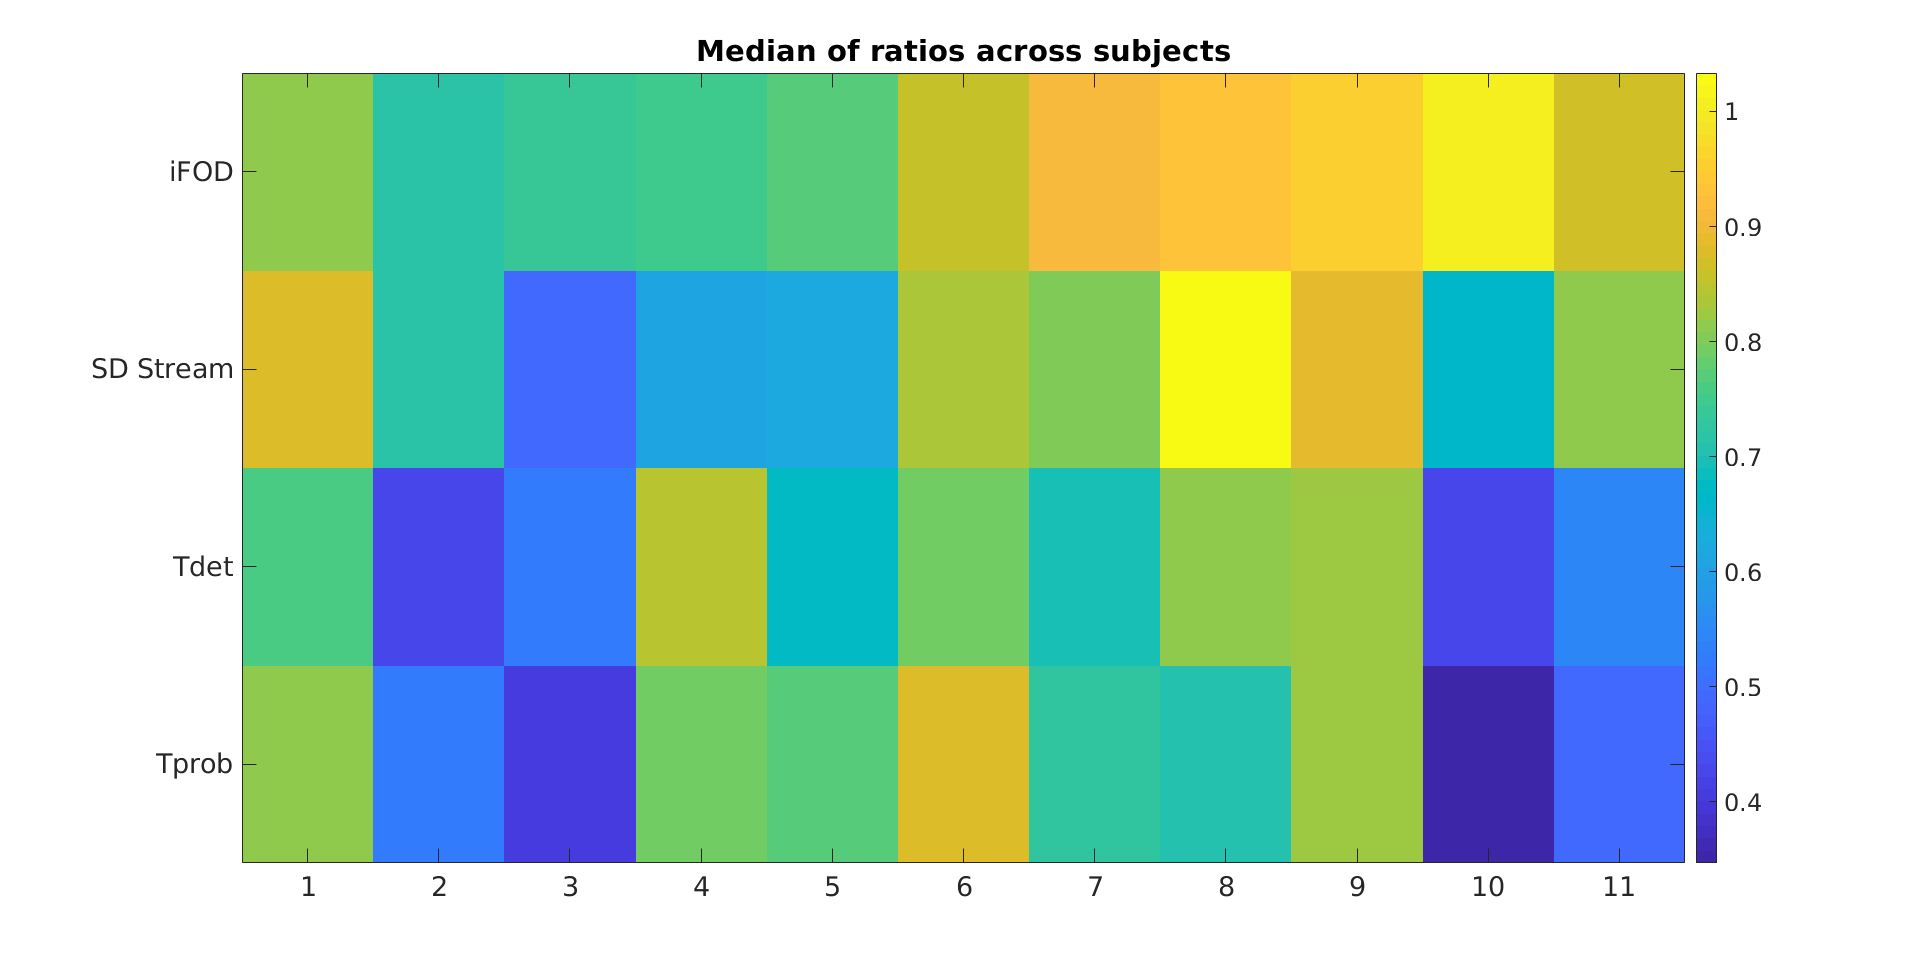
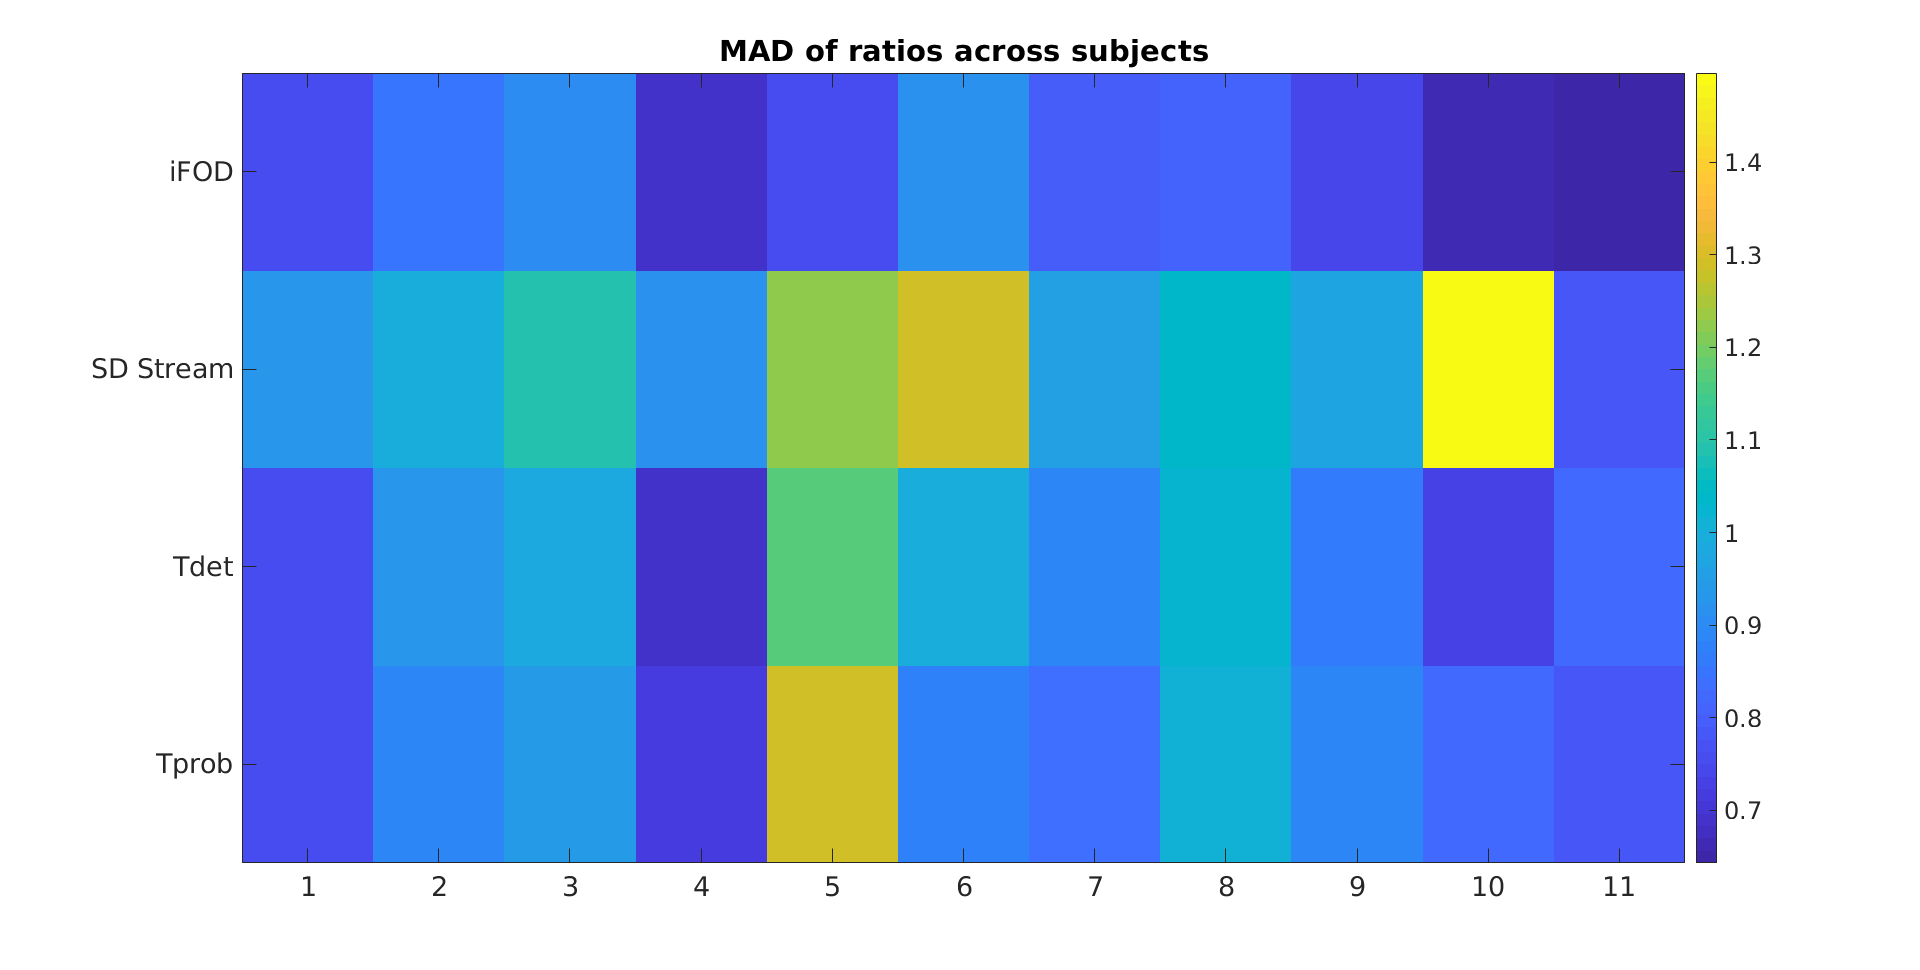
Figure 2 shows the median $$$r_{t}$$$ across all 73 tracts for the 11 subjects and the four investigated algorithms. Several trends can be noticed in terms of streamlines distribution between different anatomical parts, and that they are usually followed by all the 4 proposed tracking alternatives. Most notably, all of them tend to employ a higher number of streamlines with respect to the anatomically curated atlas to form the striato-parietal (SP) tract. Several other anatomical tracts in the left portion of the graph, however, remain highly underrepresented: the most notable examples here are the external (EC) and extreme (Emc) capsules (a representative example is shown in Figure 2). Figure 3 and Figure 4 show, respectively, the median and its mean absolute deviation (MAD) across the 11 subjects for the 73 tracts and the four investigated algorithms. The agreement of a tractogram’s streamline distribution to the one of the anatomically curated atlas can be represented by a median close to one and as low as possible dispersion (i.e., MAD). From both figures it can be seen that both properties are scored consistently for the iFOD algorithm across all subjects, with the other three fiber tracking options being generally worse(subject averages of Figure 3 and Figure 4: median(iFOD)=0.85; MAD(iFOD)=0.77; median(SD_Stream)=0.75; MAD(SD_Stream)=1.06; median(Tensor_det)=0.66; MAD(Tensor_det)=0.89; median(Tensor_prob)=0.66; MAD(Tensor_prob=0.89)).Conclusions
We presented an application of the recently proposed whitematteranalysis software which allows for an objective comparison of different tractograms in terms of overall anatomical tracts reconstruction. We studied 4 different tracking algorithms in 11 patients with brain tumours and found the iFOD algorithm to perform best in terms of median and MAD of the measure. Further studies will concern the involvement of more patients and additional tracking options.Acknowledgements
No acknowledgement found.References
[1] Jeurissen B, Descoteaux M, Mori S, Leemans A. Diffusion MRI fiber tractography of the brain. NMR Biomed. 2019 Apr;32(4):e3785. doi: 10.1002/nbm.3785. Epub 2017 Sep 25. PMID: 28945294.
[2] Zhang H, Schneider T, Wheeler-Kingshott CA, Alexander DC. NODDI: practical in vivo neurite orientation dispersion and density imaging of the human brain. Neuroimage. 2012 Jul 16;61(4):1000-16. doi: 10.1016/j.neuroimage.2012.03.072. Epub 2012 Mar 30. PMID: 22484410.
[3] Andersson JL, Skare S, Ashburner J. How to correct susceptibility distortions in spin-echo echo-planar images: application to diffusion tensor imaging. Neuroimage. 2003 Oct;20(2):870-88. doi: 10.1016/S1053-8119(03)00336-7. PMID: 14568458.
[4] Smith, Robert E., et al. "Anatomically-constrained tractography: improved diffusion MRI streamlines tractography through effective use of anatomical information." Neuroimage 62.3 (2012): 1924-1938.
[5] https://github.com/SlicerDMRI/whitematteranalysis
[6] O'Donnell LJ, Westin CF. Automatic tractography segmentation using a high-dimensional white matter atlas. IEEE Trans Med Imaging. 2007 Nov;26(11):1562-75. doi: 10.1109/TMI.2007.906785. PMID: 18041271.
[7] Zhang F, Wu Y, Norton I, Rigolo L, Rathi Y, Makris N, O'Donnell LJ. An anatomically curated fiber clustering white matter atlas for consistent white matter tract parcellation across the lifespan. Neuroimage. 2018 Oct 1;179:429-447. doi: 10.1016/j.neuroimage.2018.06.027. Epub 2018 Jun 18. PMID: 29920375; PMCID: PMC6080311.
[8] O'Donnell LJ, Suter Y, Rigolo L, et al. Automated white matter fiber tract identification in patients with brain tumors. Neuroimage Clin. 2016;13:138-153. Published 2016 Nov 25. doi:10.1016/j.nicl.2016.11.023
[9] Malcolm, James G et al. “Filtered multitensor tractography.” IEEE transactions on medical imaging vol. 29,9 (2010): 1664-75. doi:10.1109/TMI.2010.2048121
Figures