4303
Spatial Entropy Mapping of the Connectome using White Matter Fibrography: Quantifying the Effects of Age.1Boston University, Boston, MA, United States, 2Boston University Medical Center, Boston, MA, United States, 3Center for Translational Neuroimaging, Boston, MA, United States
Synopsis
Purpose: To develop algorithms for mapping the spatial entropy (SE); extending white matter fibrography (WMF) for quantifying whole-brain information content. Methods: SE algorithms were applied to WM texture images of four individuals of increasing age, optimized for maximum information content, and implemented to calculate the whole-brain WM complexity. Results: SE was positively correlated with subject age. Conclusion: SE is a promising quantitative metric for objectively distinguishing the state of WM architecture from fibrograms, particularly as it relates to age effects.
Introduction
White matter fibrography (WMF) is a recently described application of R1-weighted Synthetic-MRI for in vivo brain connectomics that does not use pulsed field gradient diffusion MRI. This technique can generate detailed visual renderings of the connectome at high spatial resolution. Visual assessment of such complicated fibrograms is not straightforward and there is a need for deriving objective measures for characterizing fiber organization and order. One logical metric is spatial entropy (SE), which is an objective measure of the information content of a locality of pixels. SE therefore reports on the complexity contained in each neighborhood in the connectome defined through WMF1,2. The purposes of this work were to develop and optimize an SE mapping technique for the human connectome and to study possible WM fiber organizational changes as function of age.Methods
All in vivo images used for this study were obtained with Institutional Review Board approval and informed consent. Four subjects 15-52 years of age were scanned with a 3T MRI protocol using the triple turbo spin echo pulse sequence, a triple weighting acquisition of concatenated spin echoes. Two extremely preterm born adolescent participants were scanned as part of the ELGAN-ECHO study. Multispectral qMRI algorithms were derived according to the Bloch equation of the Tri-TSE pulse sequence that is applicable across three vendors (Philips, Siemens, and GE), and developed with Python 3.7 in the Enthought Deployment Manager. The WM texture latent in PD maps was uncovered via R1-weighted Synthetic-MRI according to Eq. 13.Eq. 1: $$$I_{Synth}(Ω)=PD\cdot\exp\left(-\frac{Ω}{R1}\right)$$$
Here, $$$Ω$$$ is a weighting parameter characteristic to the individual, where the optimal texture conspicuity is revealed at four times the mean white matter R1. The spatial entropy of this WM texture, a pixelwise measure of the amount of local structural information, was mapped to calculate to complexity of the white matter texture images. The SE of a WM texture image, A, at pixel (m, n) is calculated with equation 22.
E1. 2: $$$SE\left\{A\right\}_{m,n}=-\sum_{disk\left(j,k,R\right)}h\left(m,n\right)_{\left(j,k\right)}\log_{2}{\left(h\left(m,n\right)_{\left(j,k\right)}\right)}$$$
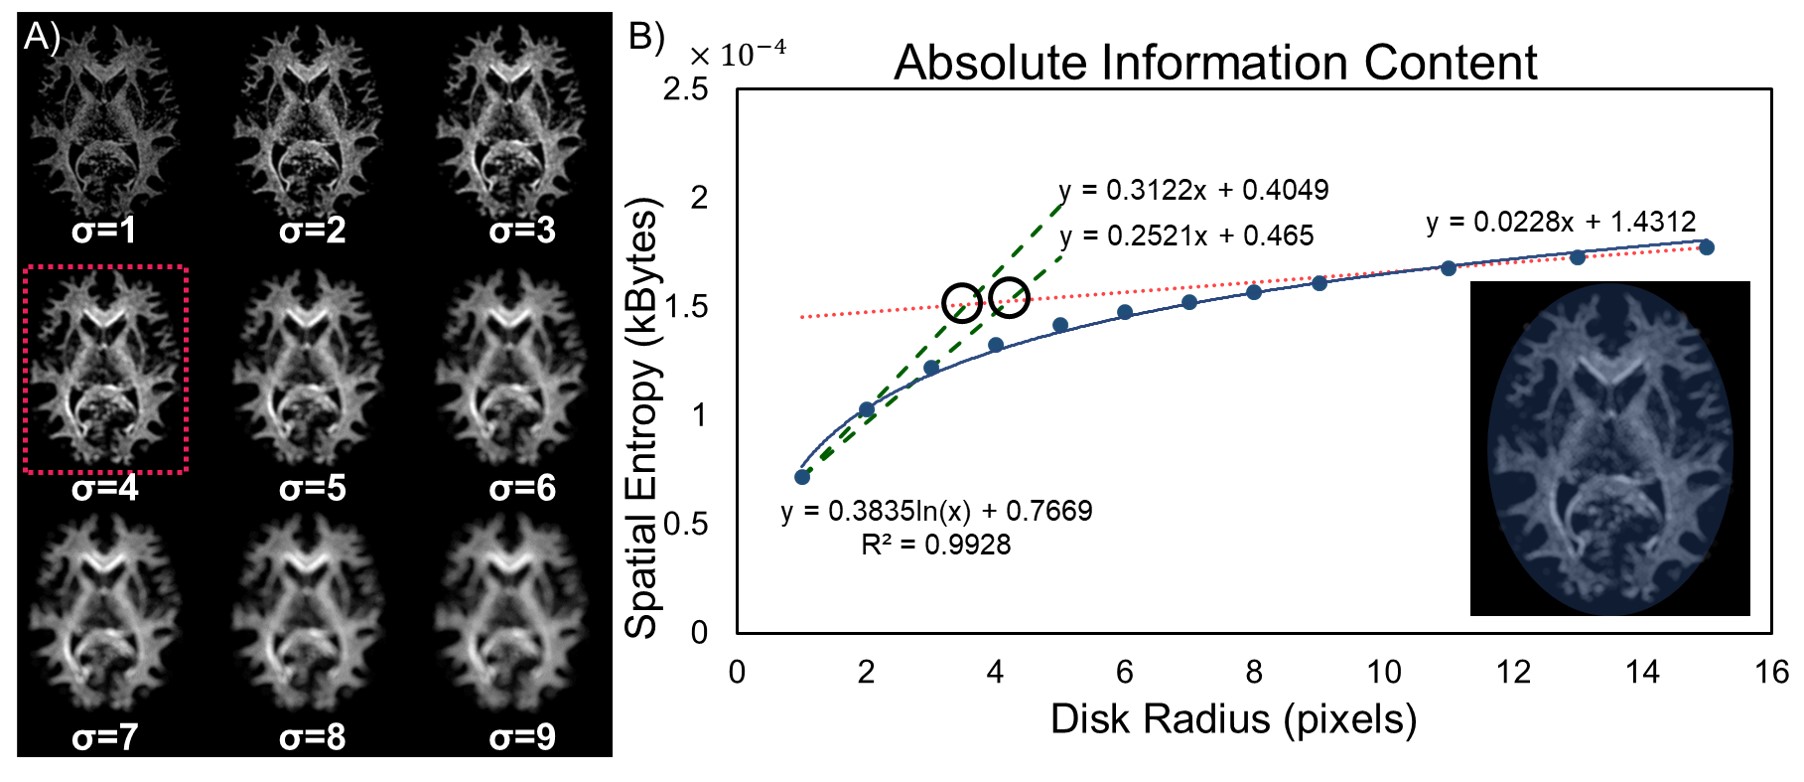
Here, $$$h\left(m,n\right)_{\left(j,k\right)}$$$ is the histogram value of the gray-levels in a disk of radius R centered around $$$\left(m,n\right)$$$. The size of the circular disk was optimized by balancing the tradeoff between maximum spatial information and minimal structural overlap. Radii from 1 to 20 were selected, and mean SE was calculated for a single slice at the level of the corpus callosum. Logarithmic curve fitting is applied, where the knee of the curve corresponds to the optimal radii. The points of intersection are calculated for three lines (Figure 1) approximating two distinct regimes of the logarithmic fit. Two lines were used to approximate small radii because of the rapid rate of change for information content in this regime. The average of the intersection points gives an optimal integer disk radius. This radius was incorporated into the SE algorithm (Eq. 2) to calculate the total information content of the 4 subjects imaged in this study (Figure 2).
Results
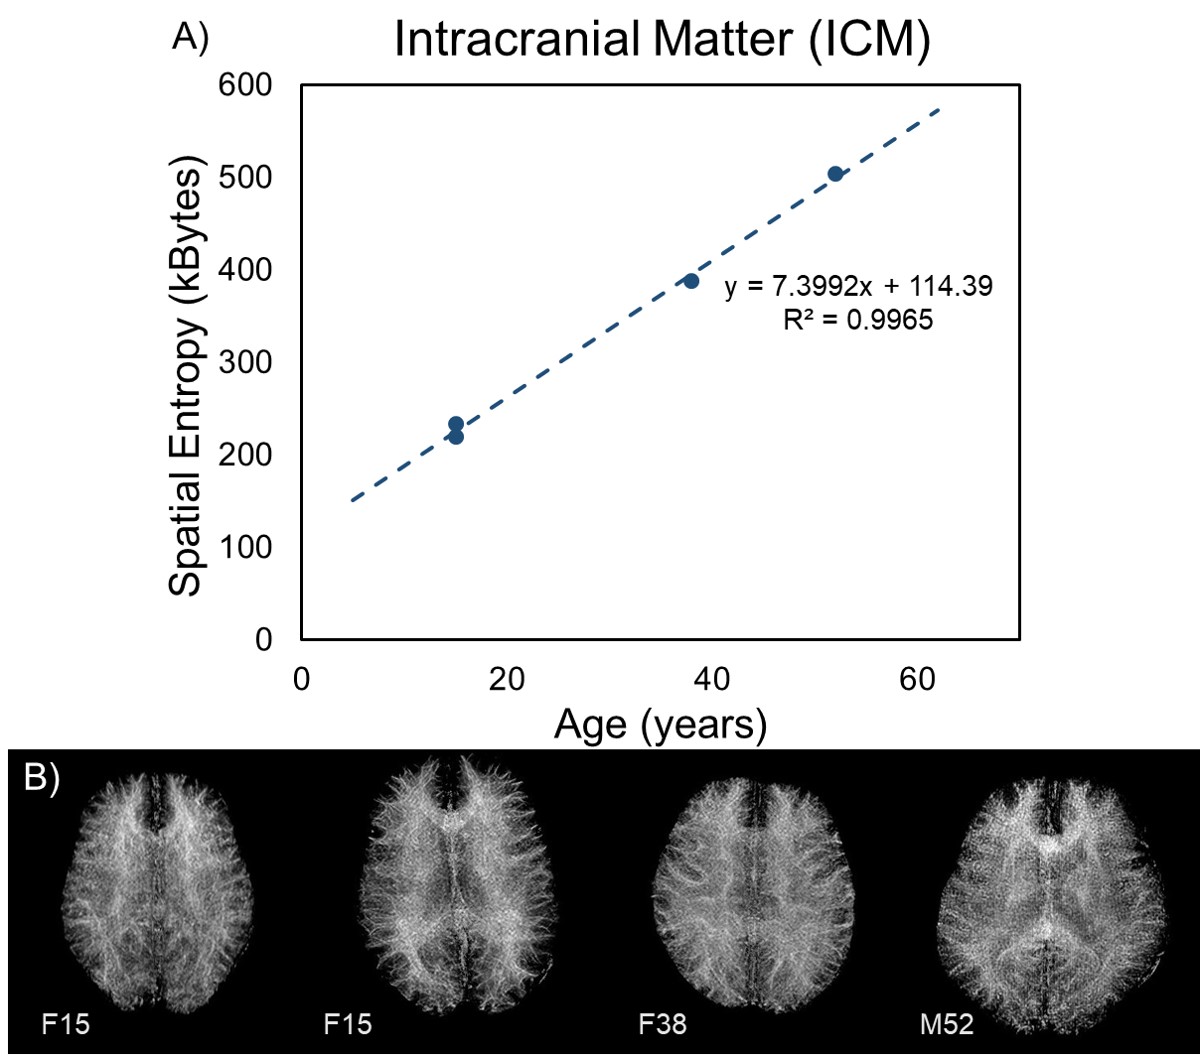
Identification analyses located the maximum curvature of the information content curve at 3.5 and 4.2 pixels for the two lines describing the small radii regime. The spatial entropy algorithm can only interpret integer values of disk size, so the average disk radius was rounded to 4 pixels (Figure 1). The tradeoff between spatial information and structural overlap can be visualized in Figure 1A, where the spatial entropy map becomes increasingly blurred with larger radii. The total spatial entropy was calculated for the whole-brain WM texture calculated through WMF (Eq. 1) and is strongly positively correlated with age (Figure 2A). Fibrograms of the four subjects are shown in Figure 2B; however, no distinguishable difference in fiber content can be identified visually.Discussion and Conclusions
A WMF technique for mapping the SE of the human connectome has been developed and tested as an extension of WMF. Quantifying the organization of the connectome via WMF and SE mapping could lead to imaging biomarkers sensitive to subtle order patterns not easily recognized at visual inspection. In this pilot study, calculation of SE shows highly correlated positive relationships with age, possibly demonstrating the development of the white matter architecture and increasing myeloarchitectural complexity throughout life. This work could be useful for the study of neurodevelopment and neurologic disorders affecting the connectome's organization at local and global scales.Acknowledgements
No acknowledgement found.References
Celik T. Spatial Entropy-Based Global and Local Image Contrast Enhancement. IEEE Transactions on Image Processing 2014;23(12):5298-5308.
Batty M, Morphet R, Masucci P, Stanilov K. Entropy, complexity, and spatial information. Journal of geographical systems 2014;16(4):363-385.
Jara H. White matter fibrography by synthetic magnetic resonance imaging. Google Patents; 2020.
Figures