4302
False-positive potential of tractography-derived connections improves network reconstruction for disease spreading models1Centre for Medical Image Computing, Department of Computer Science, University College London, London, United Kingdom, 2Department of Computer Science, University of Verona, Verona, Italy
Synopsis
Network spreading models of disease propagation utilise functional or anatomical connectivity to predict regional pathology in-vivo. Models based on anatomical connectivity are likely to be disrupted by the inevitable presence of errors from tractography. To mitigate this problem, we propose a method to evaluate the potential of each tractography-derived connection to be false-positive. By incorporating this false-positive potential into a network spreading model, we are able to predict a pattern of tau accumulation more closely aligned with the pathology observed in a cohort of Alzheimer’s Disease patients.
Introduction
Computational models of neurodegenerative disease propagation encode hypotheses on the mechanisms of pathology spread through the brain’s connectivity network. These models predict the evolution of regional pathology enabling evaluation of the competing hypotheses against measured data1, ultimately aiming to inform viable strategies for intervention. Spreading models rely on accurate estimation of network connectivity, either anatomical, determined by tractography, or functional. Whilst spreading models based on functional connectivity often correlate better with measured pathology patterns2, disease spread through anatomical connectivity has been supported by animal studies3. We hypothesise that errors observed in anatomical network spreading models are largely due to the overwhelming presence of connection errors4.In this work, we propose an approach to evaluate the potential of each connection produced by tractography to be false positive (FP). We demonstrate how incorporating this FP-potential into a network spreading model of Alzheimer’s disease (AD) can improve the prediction of tau accumulation.
Methods
Data: Two datasets were used: diffusion and structural (T1) MRI images from the Human Connectome Project (HCP) for tractography, and tau-PET data from the Alzheimer’s Disease Neuroimaging Initiative (ADNI) database (adni.loni.usc.edu) to provide measured tau accumulation patterns in an AD cohort.HCP diffusion images (b=[0,1000,2000,3000]s/mm2, 288 diffusion directions, TE=89.50ms, TR=5500ms) from five healthy, young individuals were used in a probabilistic5, anatomically constrained6 tractography pipeline, processed using MrTrix37, generating four million streamlines. The Desikan-Killiany parcellation mapped the streamlines to the connectivity matrix, with each edge defining a connection.
ADNI inclusion criteria for our study were availability of: AV1451 tau-PET, AV-45 amyloid-PET, and a clinical diagnosis, producing a dataset of 118 AD patients and 168 healthy controls.
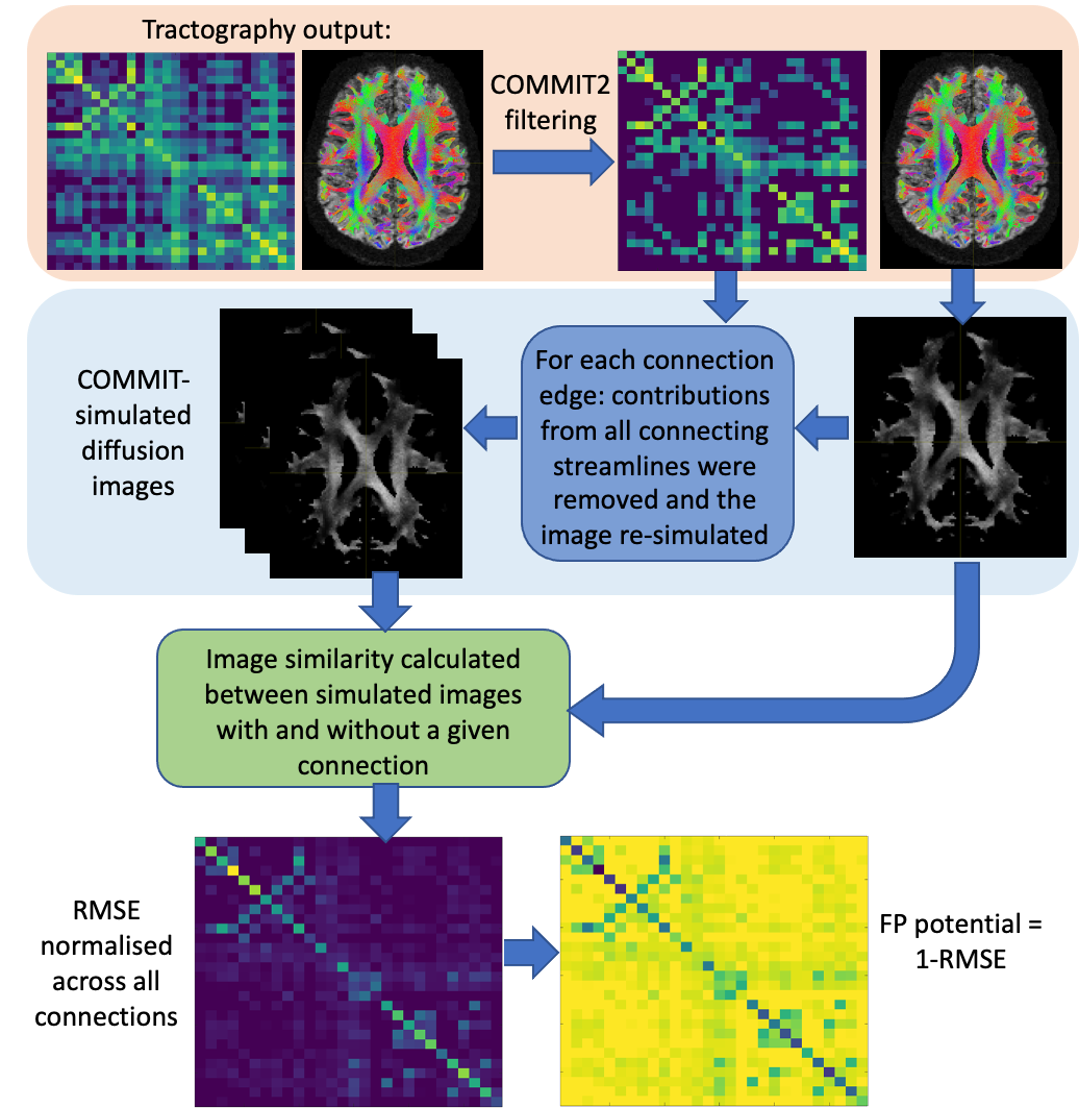
FP-potential: We used Convex optimization modelling for microstructure informed tractography (COMMIT)8 in two stages: to remove implausible connections from the original tractograms using COMMIT29; and to simulate the diffusion images corresponding to filtered tractograms via the forward model in COMMIT8. For each retained connection, we calculated the root-mean-square error (RMSE) between simulated images with and without the connection, see Figure 1. Similarly to 10, we suggest FP-potential is low if removing the connection substantially increases RMSE; high if RMSE is largely unaffected, and so the connection is redundant in reproducing the data. We renormalised the RMSE distribution for all connections to [0,1], and defined the FP-potential for any connection as one minus this rescaled RMSE.
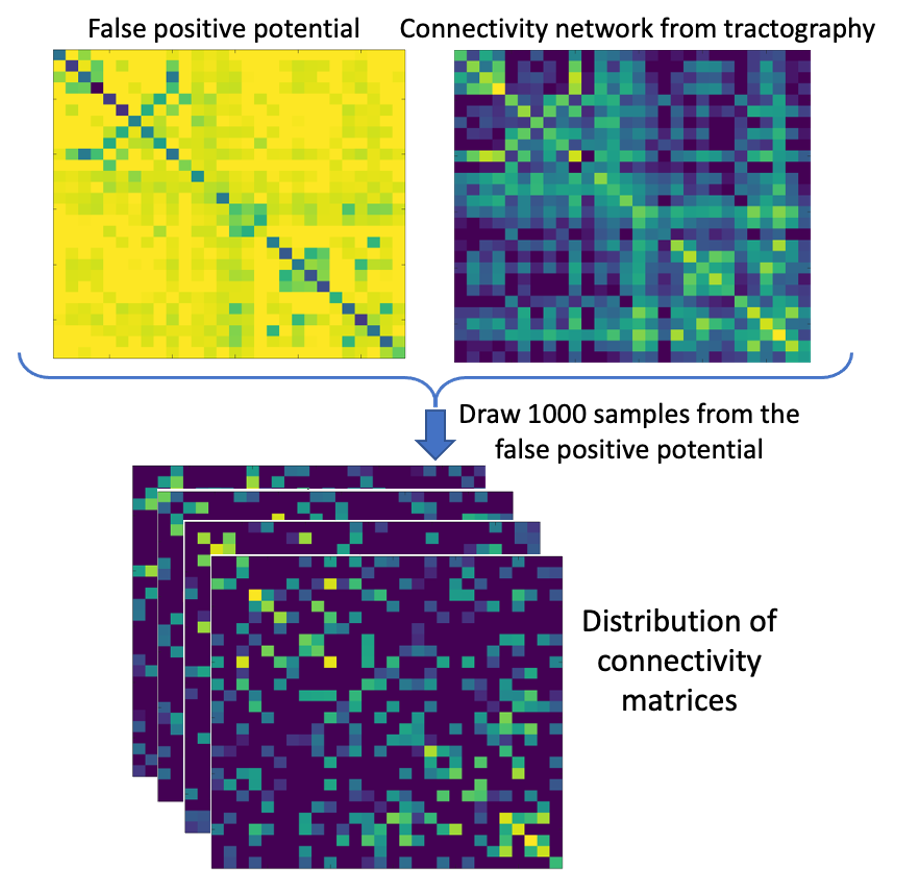
Network spreading model: The FP-potential and original connectivity matrices from tractography were averaged across all five HCP subjects and processed by a spreading model, adapted from 11. Left and right entorhinal cortices, generally considered the first region to accumulate tau pathology in AD12, were used to seed the simulated spread of pathogenic tau. We generated a baseline prediction of tau spreading by running the model using the averaged HCP connectivity matrix. Our FP-potential was incorporated into the spreading model, as described in Figure 2. We evaluated predictions of tau spreading from the baseline and FP-informed models against the observed ADNI data: average t-score of AD individuals against healthy controls.
Results
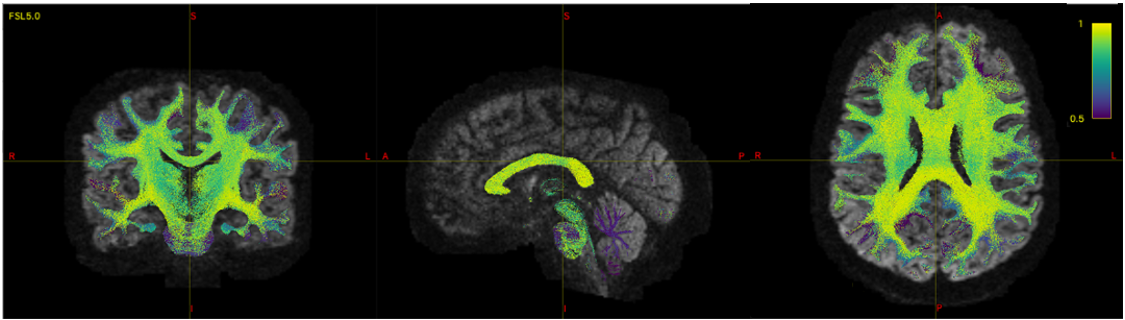
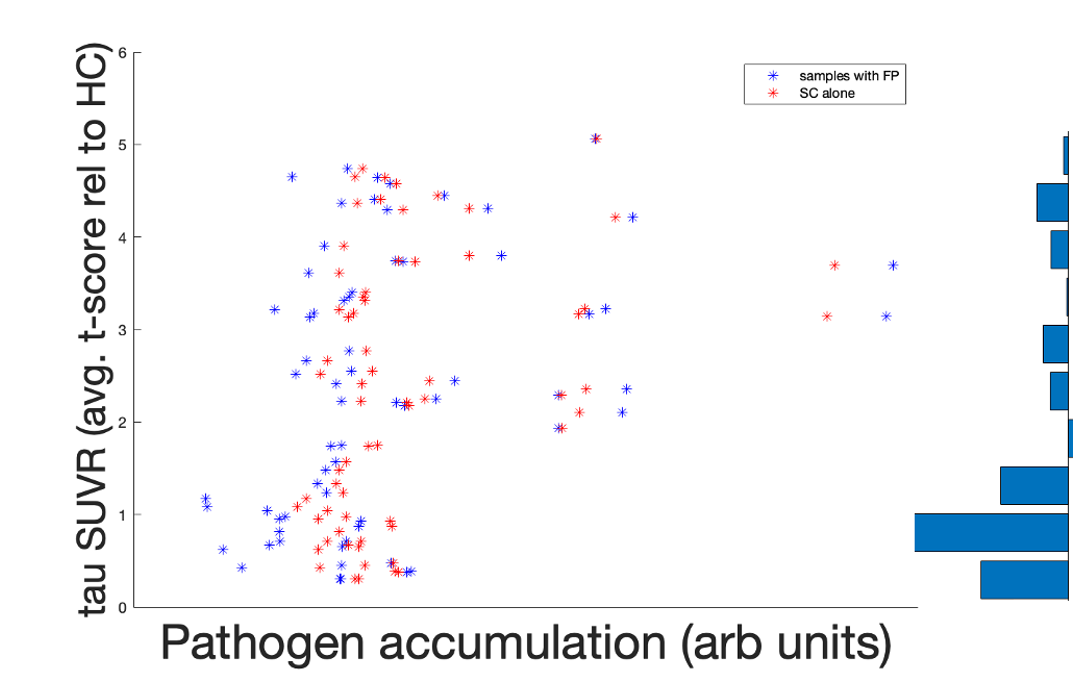
Figure 3 shows the FP-potential mapped onto tractography streamlines. Regions close to the cortex generally resulted in a lower FP-potential, whilst a large proportion of connections running through central regions, such as the corpus callosum, had a higher FP-potential. The broad structure of the corpus callosum supports many potential pathways, meaning any individual pathway is not essential to explain the data, resulting in a high FP-potential. On the other hand, connections in the cortex tend to explain the data more uniquely.Figure 4 shows the observed against predicted tau spread for the baseline and FP-informed models. Whilst predictions from both models are largely consistent across regions of high observed tau accumulation, accounting for FP-potential strongly decreases predicted tau in regions of low observed tau. In these regions the baseline model over-estimates tau pathology, due to over-estimation of the region’s connectivity.
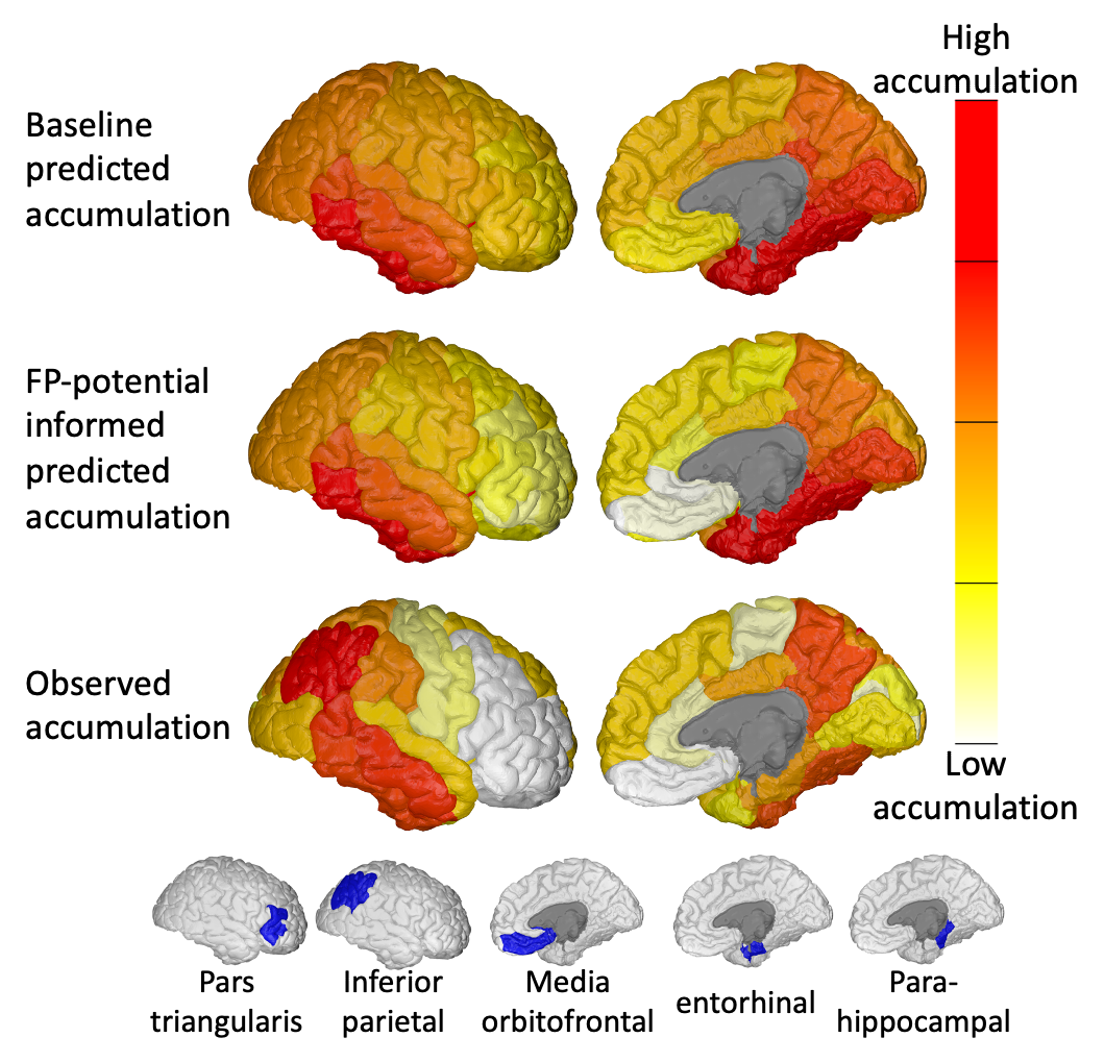
Figure 5 compares regional predicted and observed tau accumulation. The FP-informed model correctly reduces tau accumulation in over-estimated regions such as the media orbitofrontal and pars triangularis. The FP-informed model continues to over-estimate tau accumulation in the entorhinal and parahippocampal regions, likely due to the fixed propagation seed in the entorhinal cortex, which in reality can vary13,14. Tau accumulation in the inferior parietal region continues to be under-estimated by the FP-informed model, which may indicate the presence of false-negative (FN) connections in tractography.
Discussion and conclusion
Here we highlight an important potential application of tractography to the prediction of pathology spread in neurodegenerative diseases, which is heavily disrupted by inevitable connection errors. We propose to mitigate these errors by evaluating and incorporating the potential for each connection to be false. We concentrate here on FP connections, although FN connections are equally important in this application. Future work will explore ways to evaluate FN-potential to further enable tractography to support this important application.Identifying the FP-potential of connections in tractography has a wider application beyond spreading models. Our work demonstrates a novel method to incorporate likelihood-based approaches into tractography applications, encouraging a shift away from the need for restrictive thresholds which determine whether or not a connection is valid. This enables probabilistic output of applications built on tractography supporting inference that accounts for its limitations.
Acknowledgements
Data collection and sharing for this project was funded by the Alzheimer's Disease Neuroimaging Initiative (ADNI) (National Institutes of Health Grant U01 AG024904) and DOD ADNI (Department of Defense award number W81XWH-12-2-0012). ADNI is funded by the National Institute on Aging, the National Institute of Biomedical Imaging and Bioengineering, and through generous contributions from the following: AbbVie, Alzheimer’s Association; Alzheimer’s Drug Discovery Foundation; Araclon Biotech; BioClinica, Inc.; Biogen; Bristol-Myers Squibb Company; CereSpir, Inc.; Cogstate; Eisai Inc.; Elan Pharmaceuticals, Inc.; Eli Lilly and Company; EuroImmun; F. Hoffmann-La Roche Ltd and its affiliated company Genentech, Inc.; Fujirebio; GE Healthcare; IXICO Ltd.; Janssen Alzheimer Immunotherapy Research & Development, LLC.; Johnson & Johnson Pharmaceutical Research & Development LLC.; Lumosity; Lundbeck; Merck & Co., Inc.; Meso Scale Diagnostics, LLC.; NeuroRx Research; Neurotrack Technologies; Novartis Pharmaceuticals Corporation; Pfizer Inc.; Piramal Imaging; Servier; Takeda Pharmaceutical Company; and Transition Therapeutics. The Canadian Institutes of Health Research is providing funds to support ADNI clinical sites in Canada. Private sector contributions are facilitated by the Foundation for the National Institutes of Health (www.fnih.org). The grantee organization is the Northern California Institute for Research and Education, and the study is coordinated by the Alzheimer’s Therapeutic Research Institute at the University of Southern California. ADNI data are disseminated by the Laboratory for Neuro Imaging at the University of Southern California.
Data were provided in part by the Human Connectome Project, WU-Minn Consortium (Principal Investigators: David Van Essen and Kamil Ugurbil; 1U54MH091657) funded by the 16 NIH Institutes and Centers that support the NIH Blueprint for Neuroscience Research; and by the McDonnell Center for Systems Neuroscience at Washington University.
NPO (MR/S03546X/1) and MP (MR/T020296/1) are UKRI Future Leaders Fellows. NPO and DCA acknowledge funding from the EuroPOND project – This project has received funding from the European Union’s Horizon 2020 research and innovation programme under grant agreement No. 666992 – and the National Institute for Health Research University College London Hospitals Biomedical Research Centre.
References
- Garbarino S, Lorenzi M, Oxtoby NP, Vinke EJ, Marinescu RV, Eshaghi A, Ikram MA, Niessen WJ, Ciccarelli O, Barkhof F, Schott JM. Differences in topological progression profile among neurodegenerative diseases from imaging data. Elife. 2019 Dec 3;8:e49298.
- Franzmeier N, Dewenter A, Frontzkowski L, Dichgans M, Rubinski A, Neitzel J, Smith R, Strandberg O, Ossenkoppele R, Buerger K, Duering M, Hansson O, Ewers M. Patient-centered connectivity-based prediction of tau pathology spread in Alzheimer's disease. Sci Adv. 2020 Nov 27;6(48):eabd1327.
- De Calignon A, Polydoro M, Suárez-Calvet M, William C, Adamowicz DH, Kopeikina KJ, Pitstick R, Sahara N, Ashe KH, Carlson GA, Spires-Jones TL. Propagation of tau pathology in a model of early Alzheimer's disease. Neuron. 2012 Feb 23;73(4):685-97.
- Maier-Hein KH, Neher PF, Houde JC, Côté MA, Garyfallidis E, Zhong J, Chamberland M, Yeh FC, Lin YC, Ji Q, Reddick WE. The challenge of mapping the human connectome based on diffusion tractography. Nature communications. 2017 Nov 7;8(1):1-3.
- Tournier JD, Calamante F, Connelly A. Improved probabilistic streamlines tractography by 2nd order integration over fibre orientation distributions. InProceedings of the international society for magnetic resonance in medicine 2010 May (Vol. 1670). Ismrm.
- Smith RE, Tournier JD, Calamante F, Connelly A. Anatomically-constrained tractography: improved diffusion MRI streamlines tractography through effective use of anatomical information. Neuroimage. 2012 Sep 1;62(3):1924-38.
- Tournier JD, Smith R, Raffelt D, Tabbara R, Dhollander T, Pietsch M, Christiaens D, Jeurissen B, Yeh CH, Connelly A. MRtrix3: A fast, flexible and open software framework for medical image processing and visualisation. NeuroImage. 2019 Nov 15;202:116137.
- Daducci A, Dal Palù A, Lemkaddem A, Thiran JP. COMMIT: convex optimization modeling for microstructure informed tractography. IEEE transactions on medical imaging. 2014 Aug 27;34(1):246-57.
- Schiavi S, Ocampo-Pineda M, Barakovic M, Petit L, Descoteaux M, Thiran JP, Daducci A. A new method for accurate in vivo mapping of human brain connections using microstructural and anatomical information. Science advances. 2020 Jul 1;6(31):eaba8245.
- Pestilli F, Yeatman JD, Rokem A, Kay KN, Wandell BA. Evaluation and statistical inference for human connectomes. Nature methods. 2014 Oct;11(10):1058-63.
- Raj A, Kuceyeski A, Weiner M. A network diffusion model of disease progression in dementia. Neuron. 2012 Mar 22;73(6):1204-15
- Braak H, Del Tredici K. The preclinical phase of the pathological process underlying sporadic Alzheimer’s disease. Brain. 2015 Oct 1;138(10):2814-33.
- Zhou J, Gennatas ED, Kramer JH, Miller BL, Seeley WW. Predicting regional neurodegeneration from the healthy brain functional connectome. Neuron. 2012 Mar 22;73(6):1216-27.
- Torok J, Maia PD, Powell F, Pandya S, Raj A. A method for inferring regional origins of neurodegeneration. Brain. 2018 Mar 1;141(3):863-76.
- Marinescu RV, Eshaghi A, Alexander DC, Golland P. BrainPainter: A software for the visualisation of brain structures, biomarkers and associated pathological processes. InMultimodal Brain Image Analysis and Mathematical Foundations of Computational Anatomy 2019 Oct 17 (pp. 112-120). Springer, Cham.
Figures