4299
Improving white matter bundle recovery: A fast & practical ensemble tractography pipeline1Computer Sciences, Université de Sherbrooke, Sherbrooke, QC, Canada, 2Electrical Engineering, Vanderbilt University, Nashville, TN, United States
Synopsis
In most tractography settings, users choose a single tracking algorithm and a single set of tracking parameters, which may limit the quality and impact of the bundle reconstruction results. The present ensemble tractography processing pipeline aims at producing diverse whole brain tractograms faster by tuning and automatically concatenating multiple tractograms from different combinations of parameters and algorithms. Compared to classical tractography, our optimized ensemble tractography obtains improved or similar white matter bundle recovery but in 62% of the processing time.
Introduction
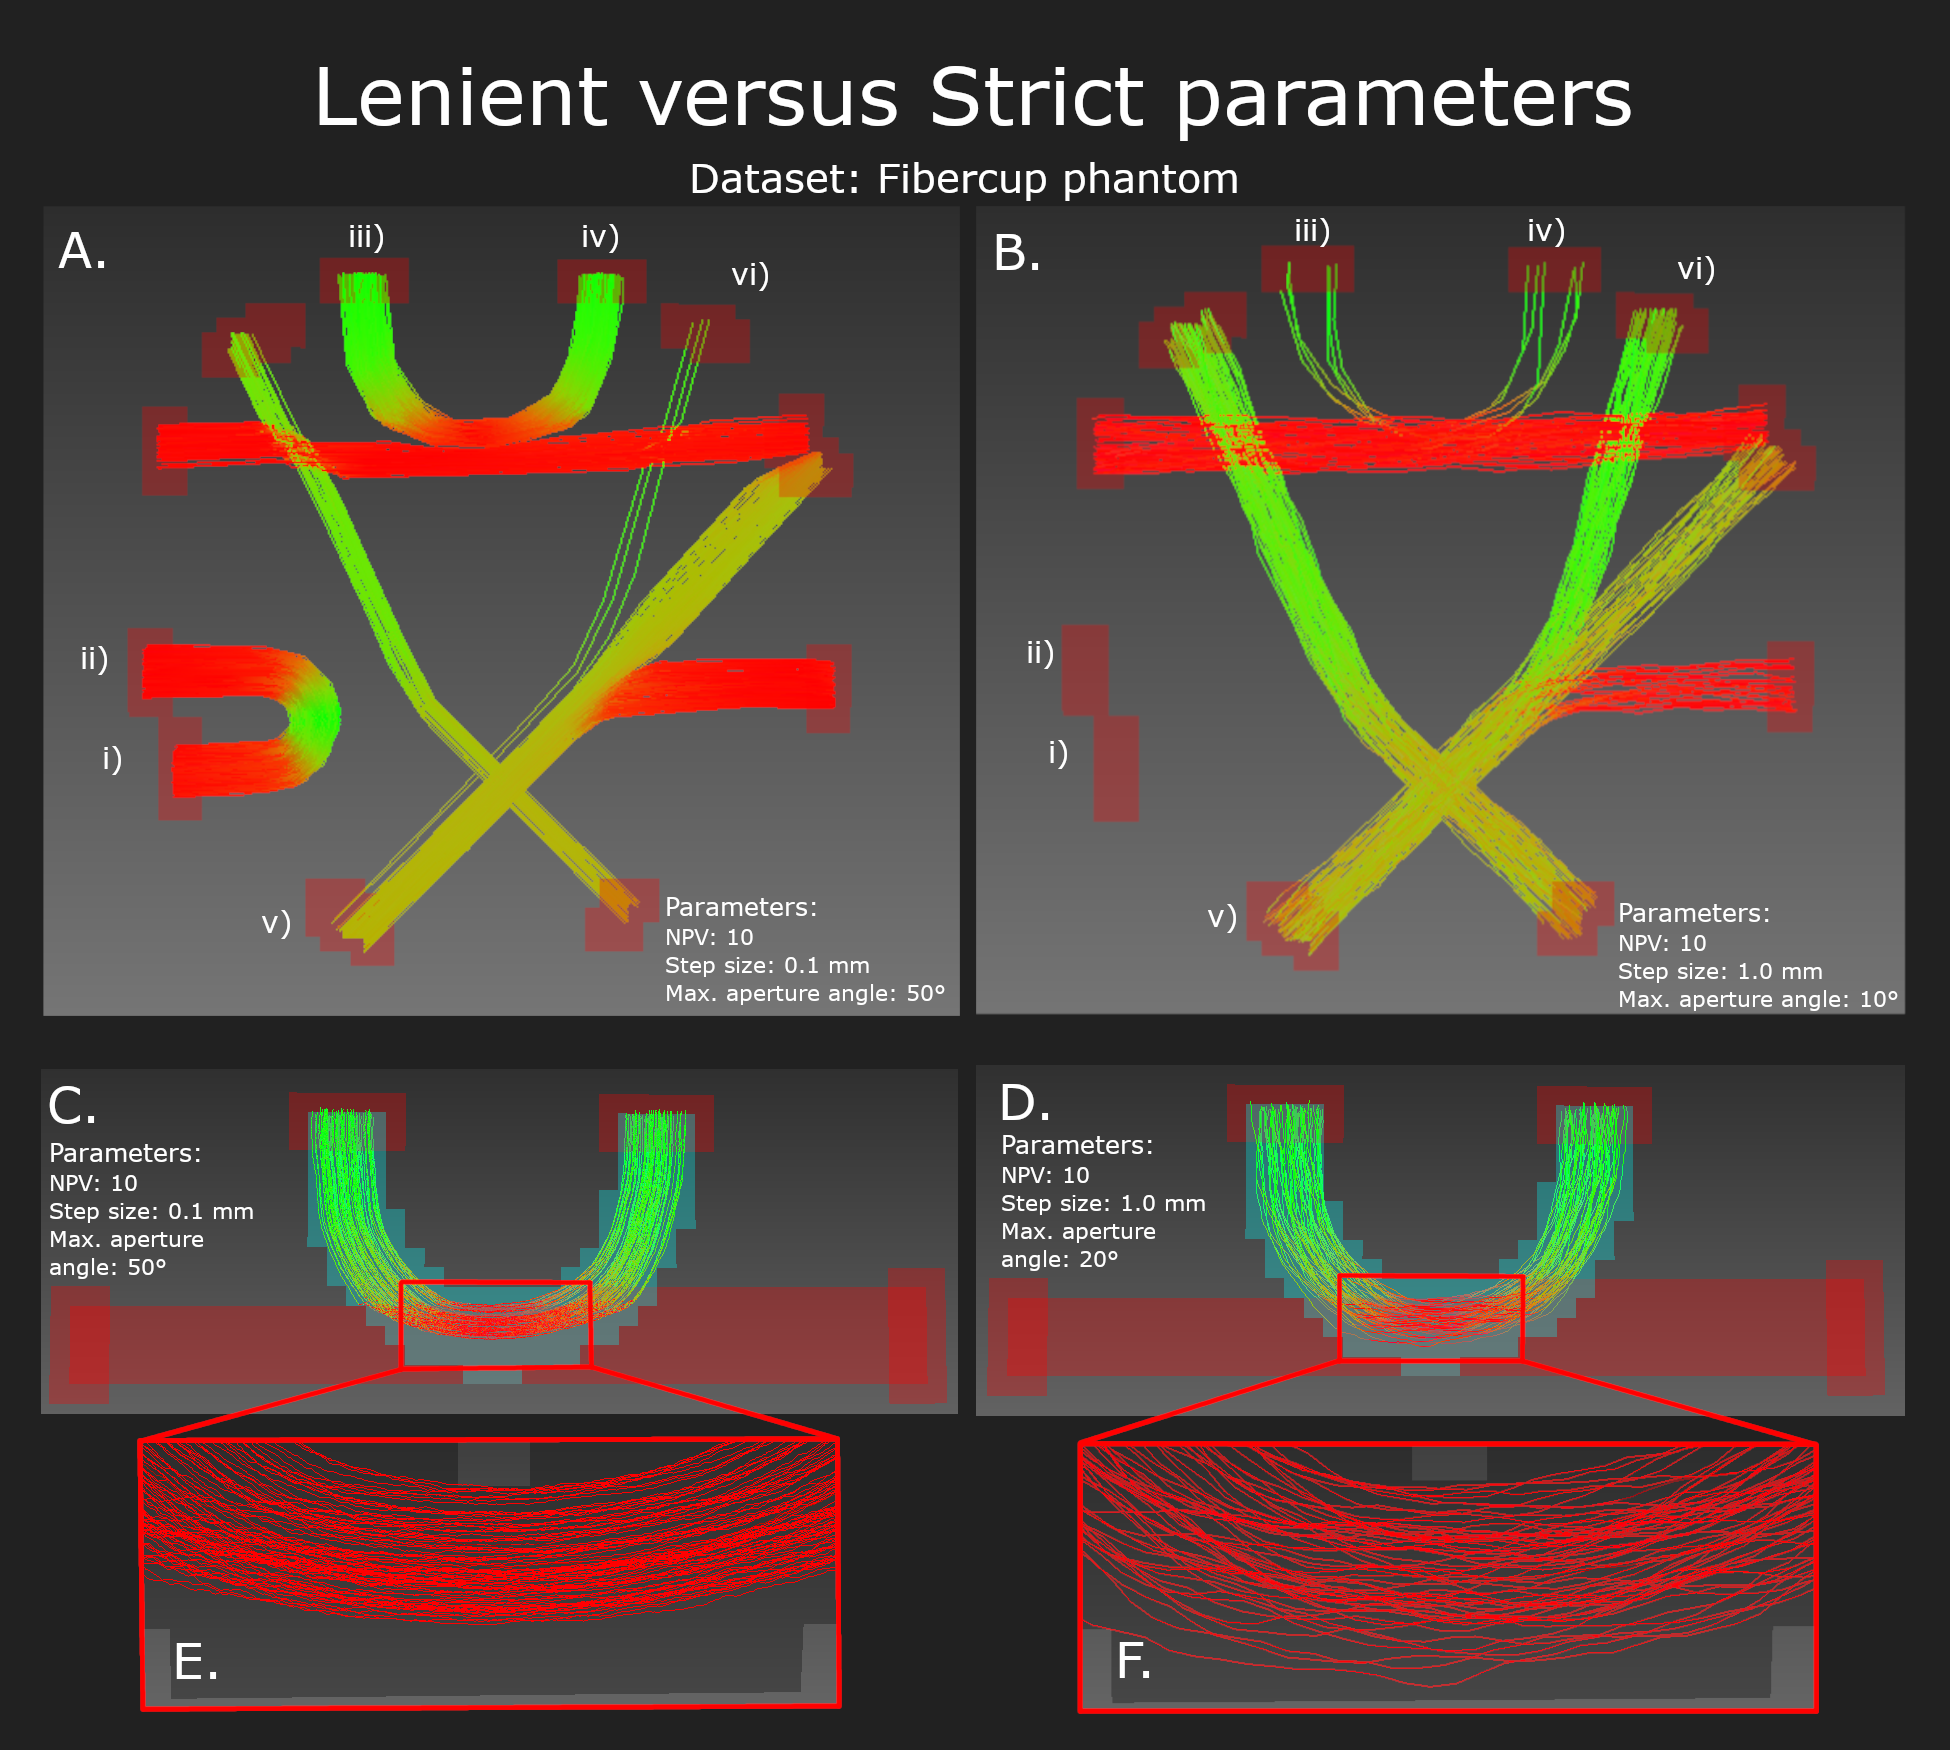
Most current tractography applications are done with a single algorithm and a single set of parameters. Why would the optimal tracking parameters be the same for a short, curving bundle than for a long, straight one? This limitation leads to a poor white matter (WM) spatial coverage and a large number of false negative bundles, i.e. WM regions poorly tracked (see Fig. 1). Real-time tracking1 that modifies parameters on the fly, as well as the global tractography family of techniques2,3,4,5 were introduced to address, in part, this limitation. Another solution is ensemble tractography6, which concatenates multiple tractography runs done with a range of input parameters (e.g. step size, angle, seeding, stopping,…). Takemura et al.6 showed that ensemble tractography with multiple different algorithms and varying parameters, followed by tractogram filtering7, can build better tractograms. Reconstructing a tractogram with all possible true connections is important for advanced filtering techniques such as COMMIT1 & 28,9. But, how should such ensemble tractography be optimized and reconstructed over the large space of potential parameters to tune, without exploding in computation time and amount of streamlines generated? In this abstract, we propose a fast and practical nextflow10 pipeline to do so.Methods
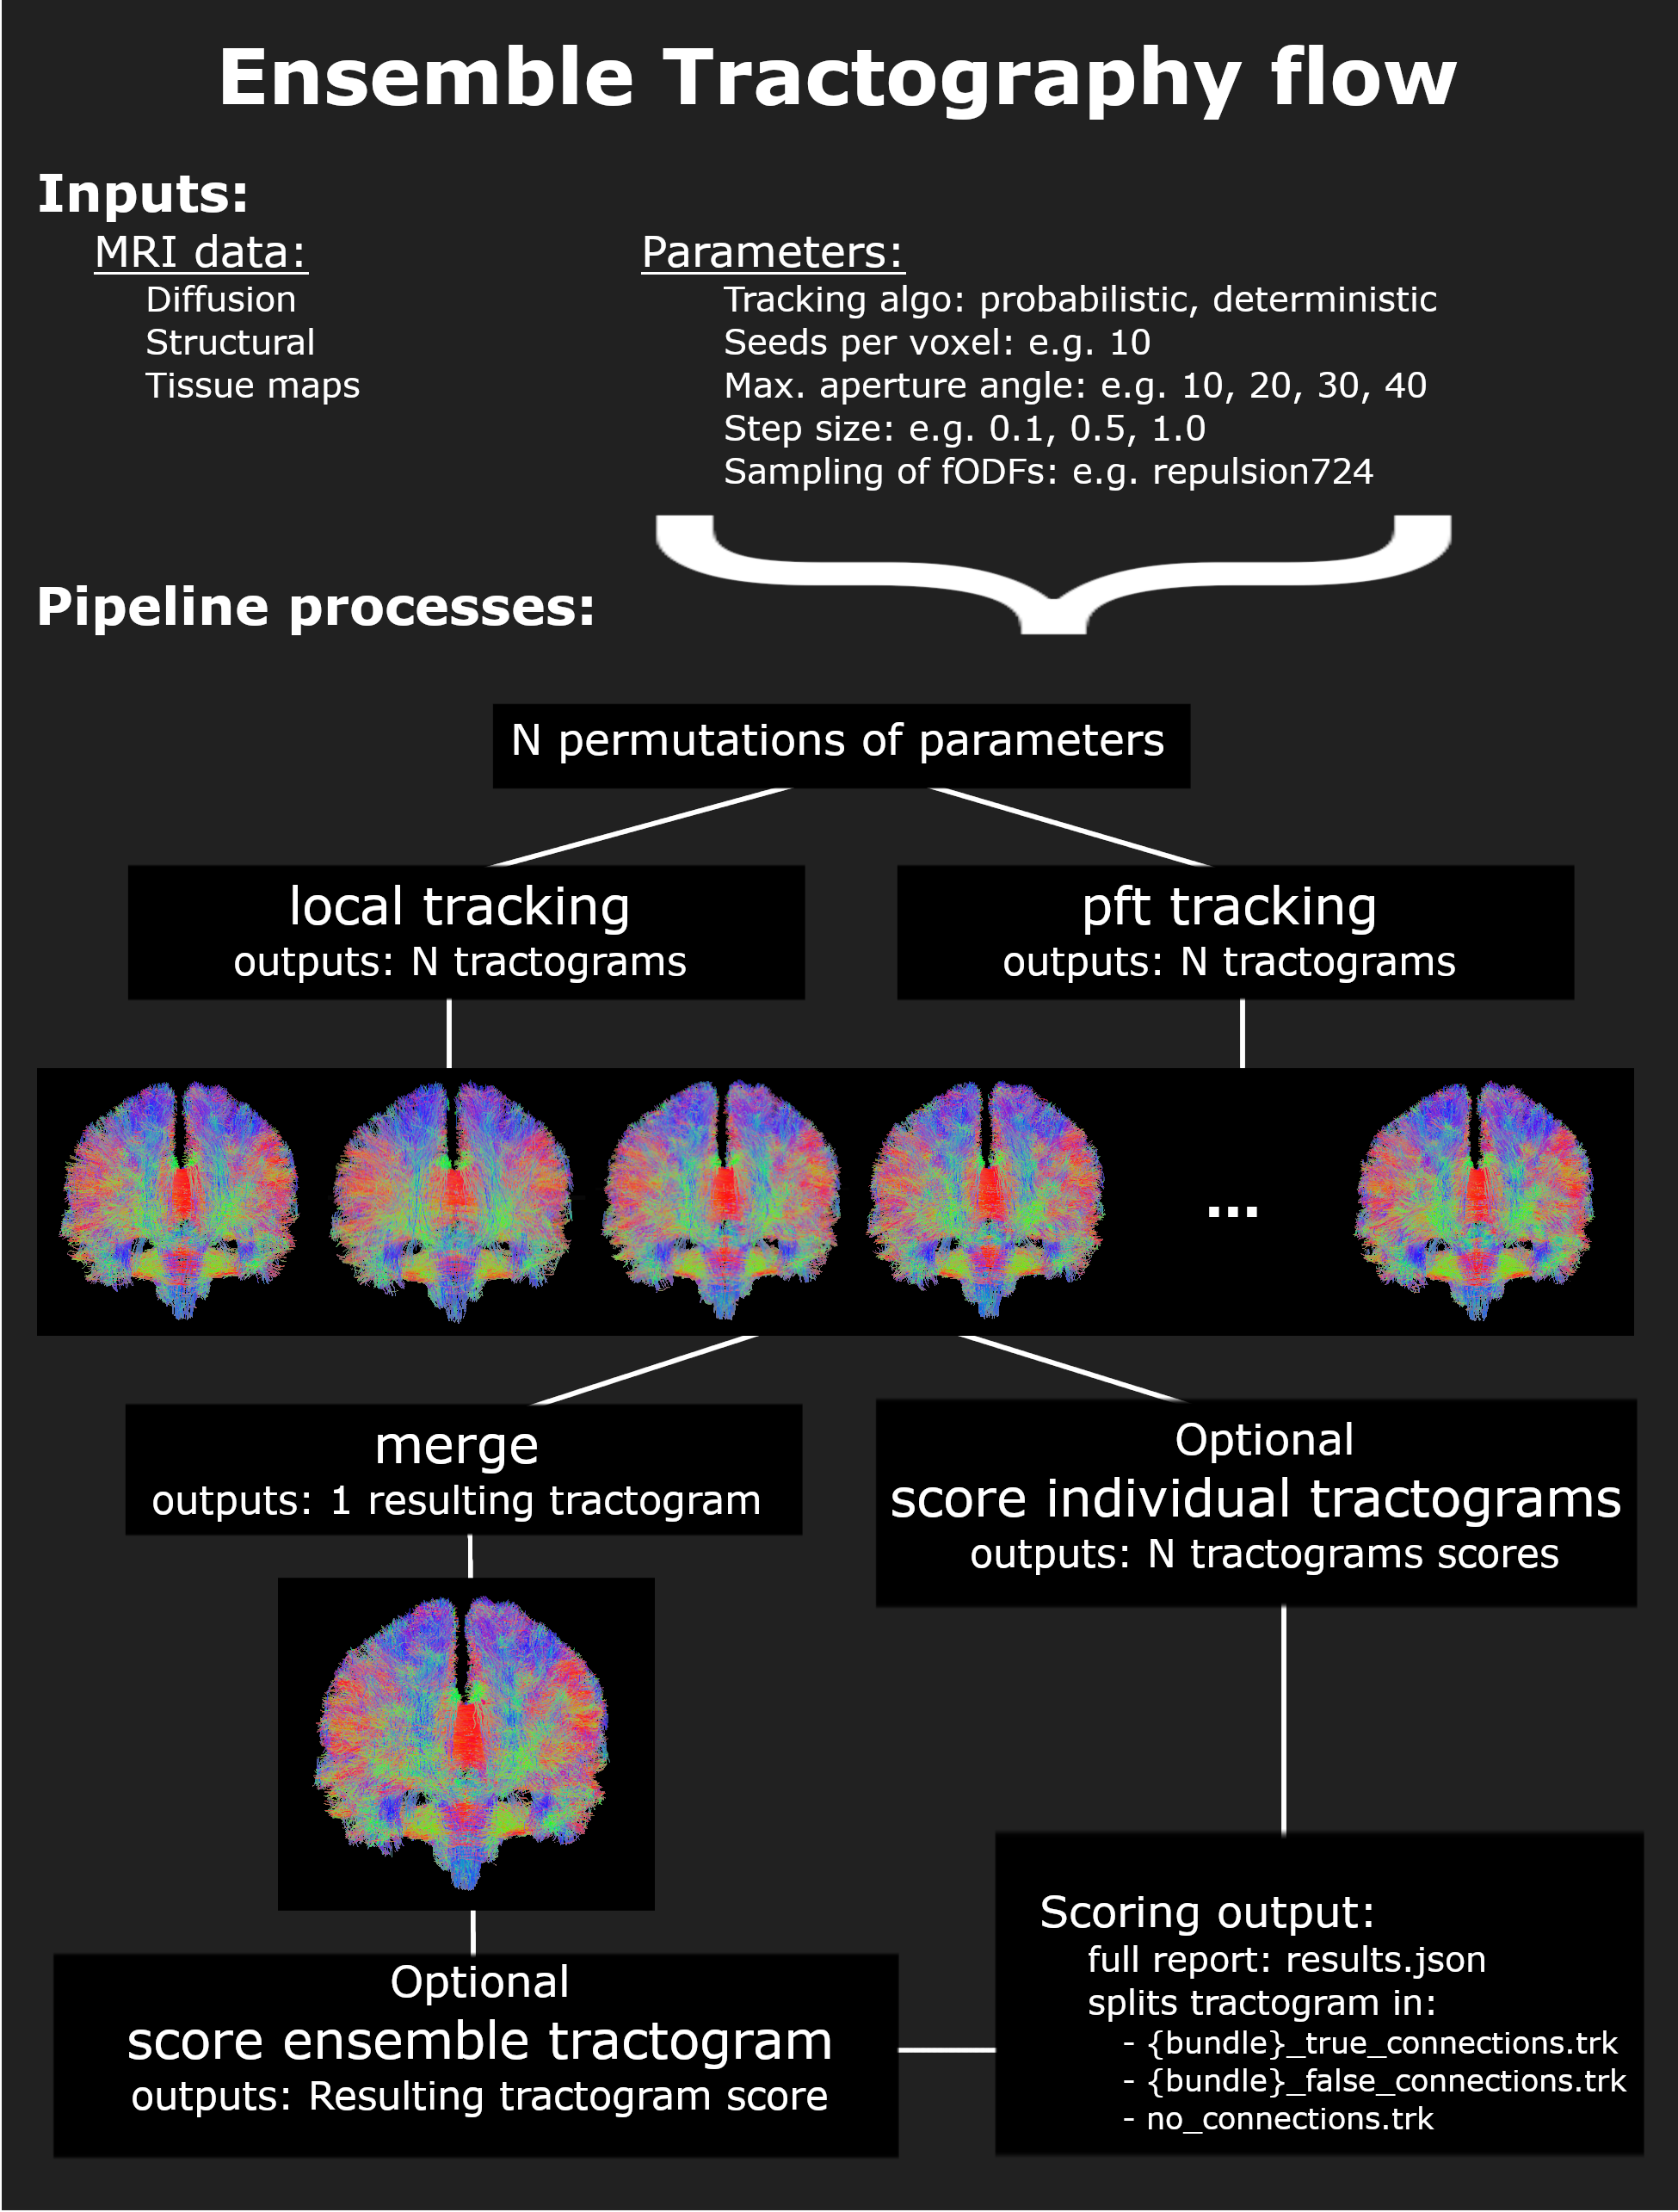
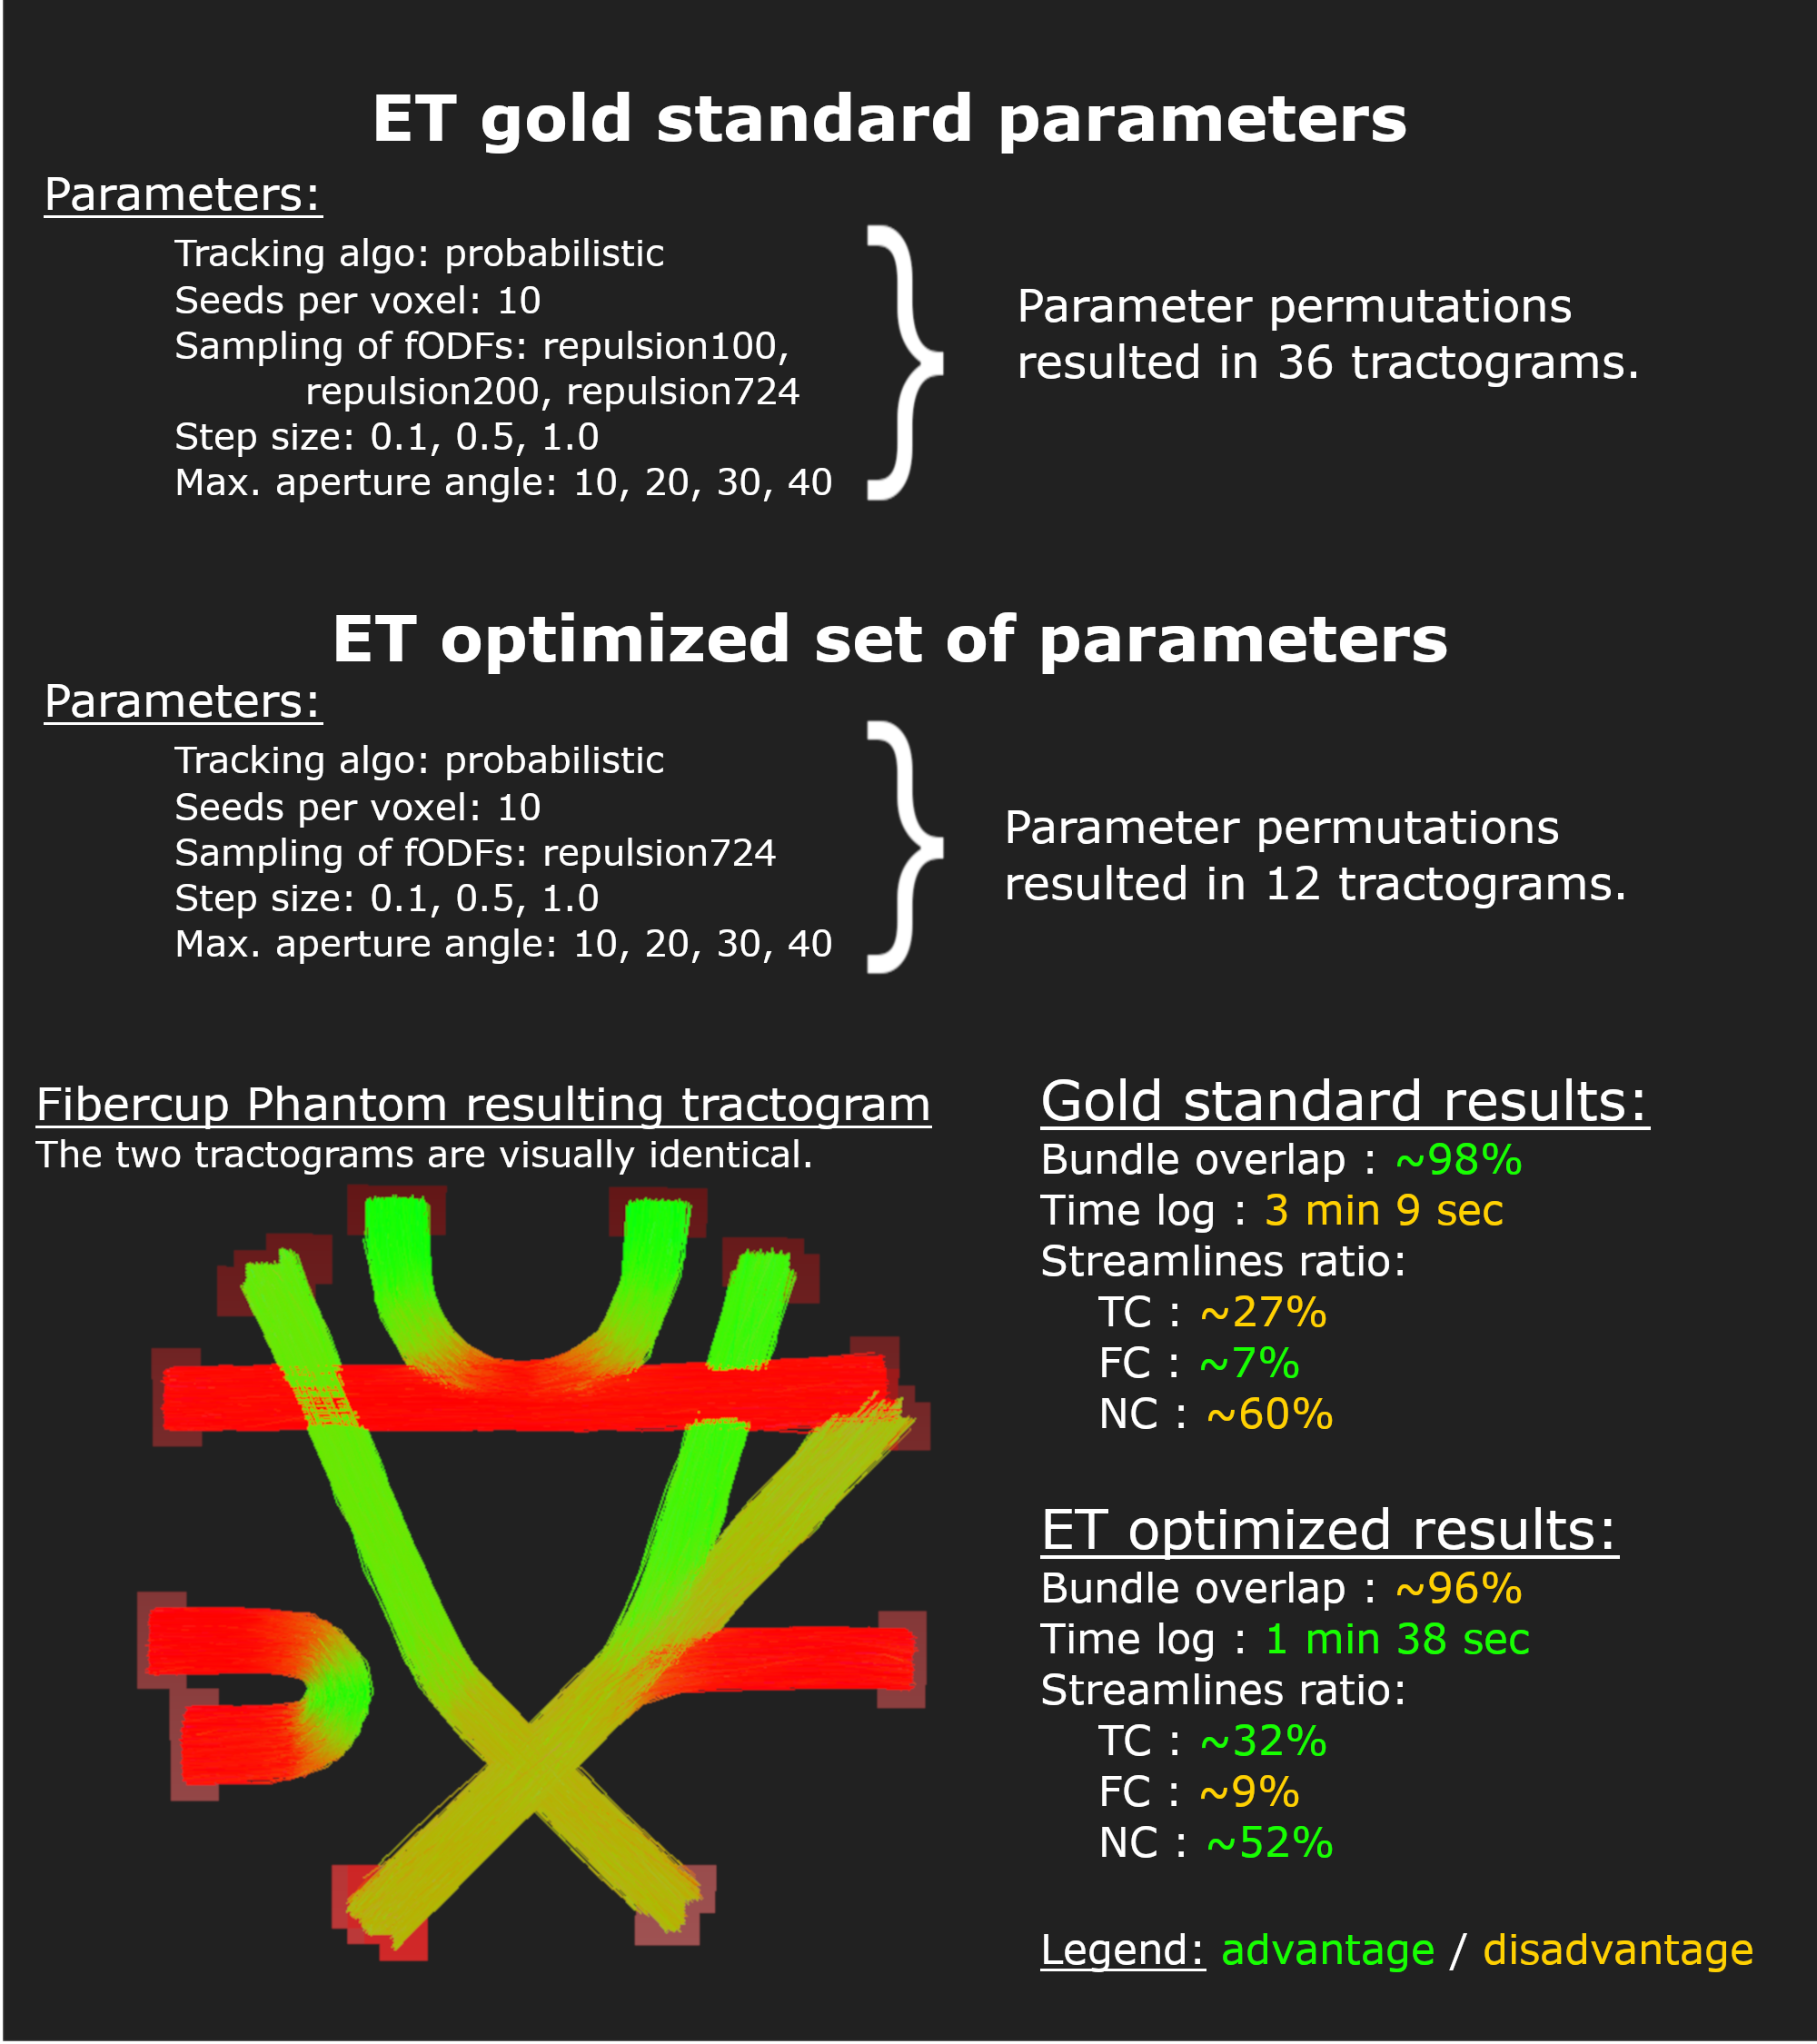
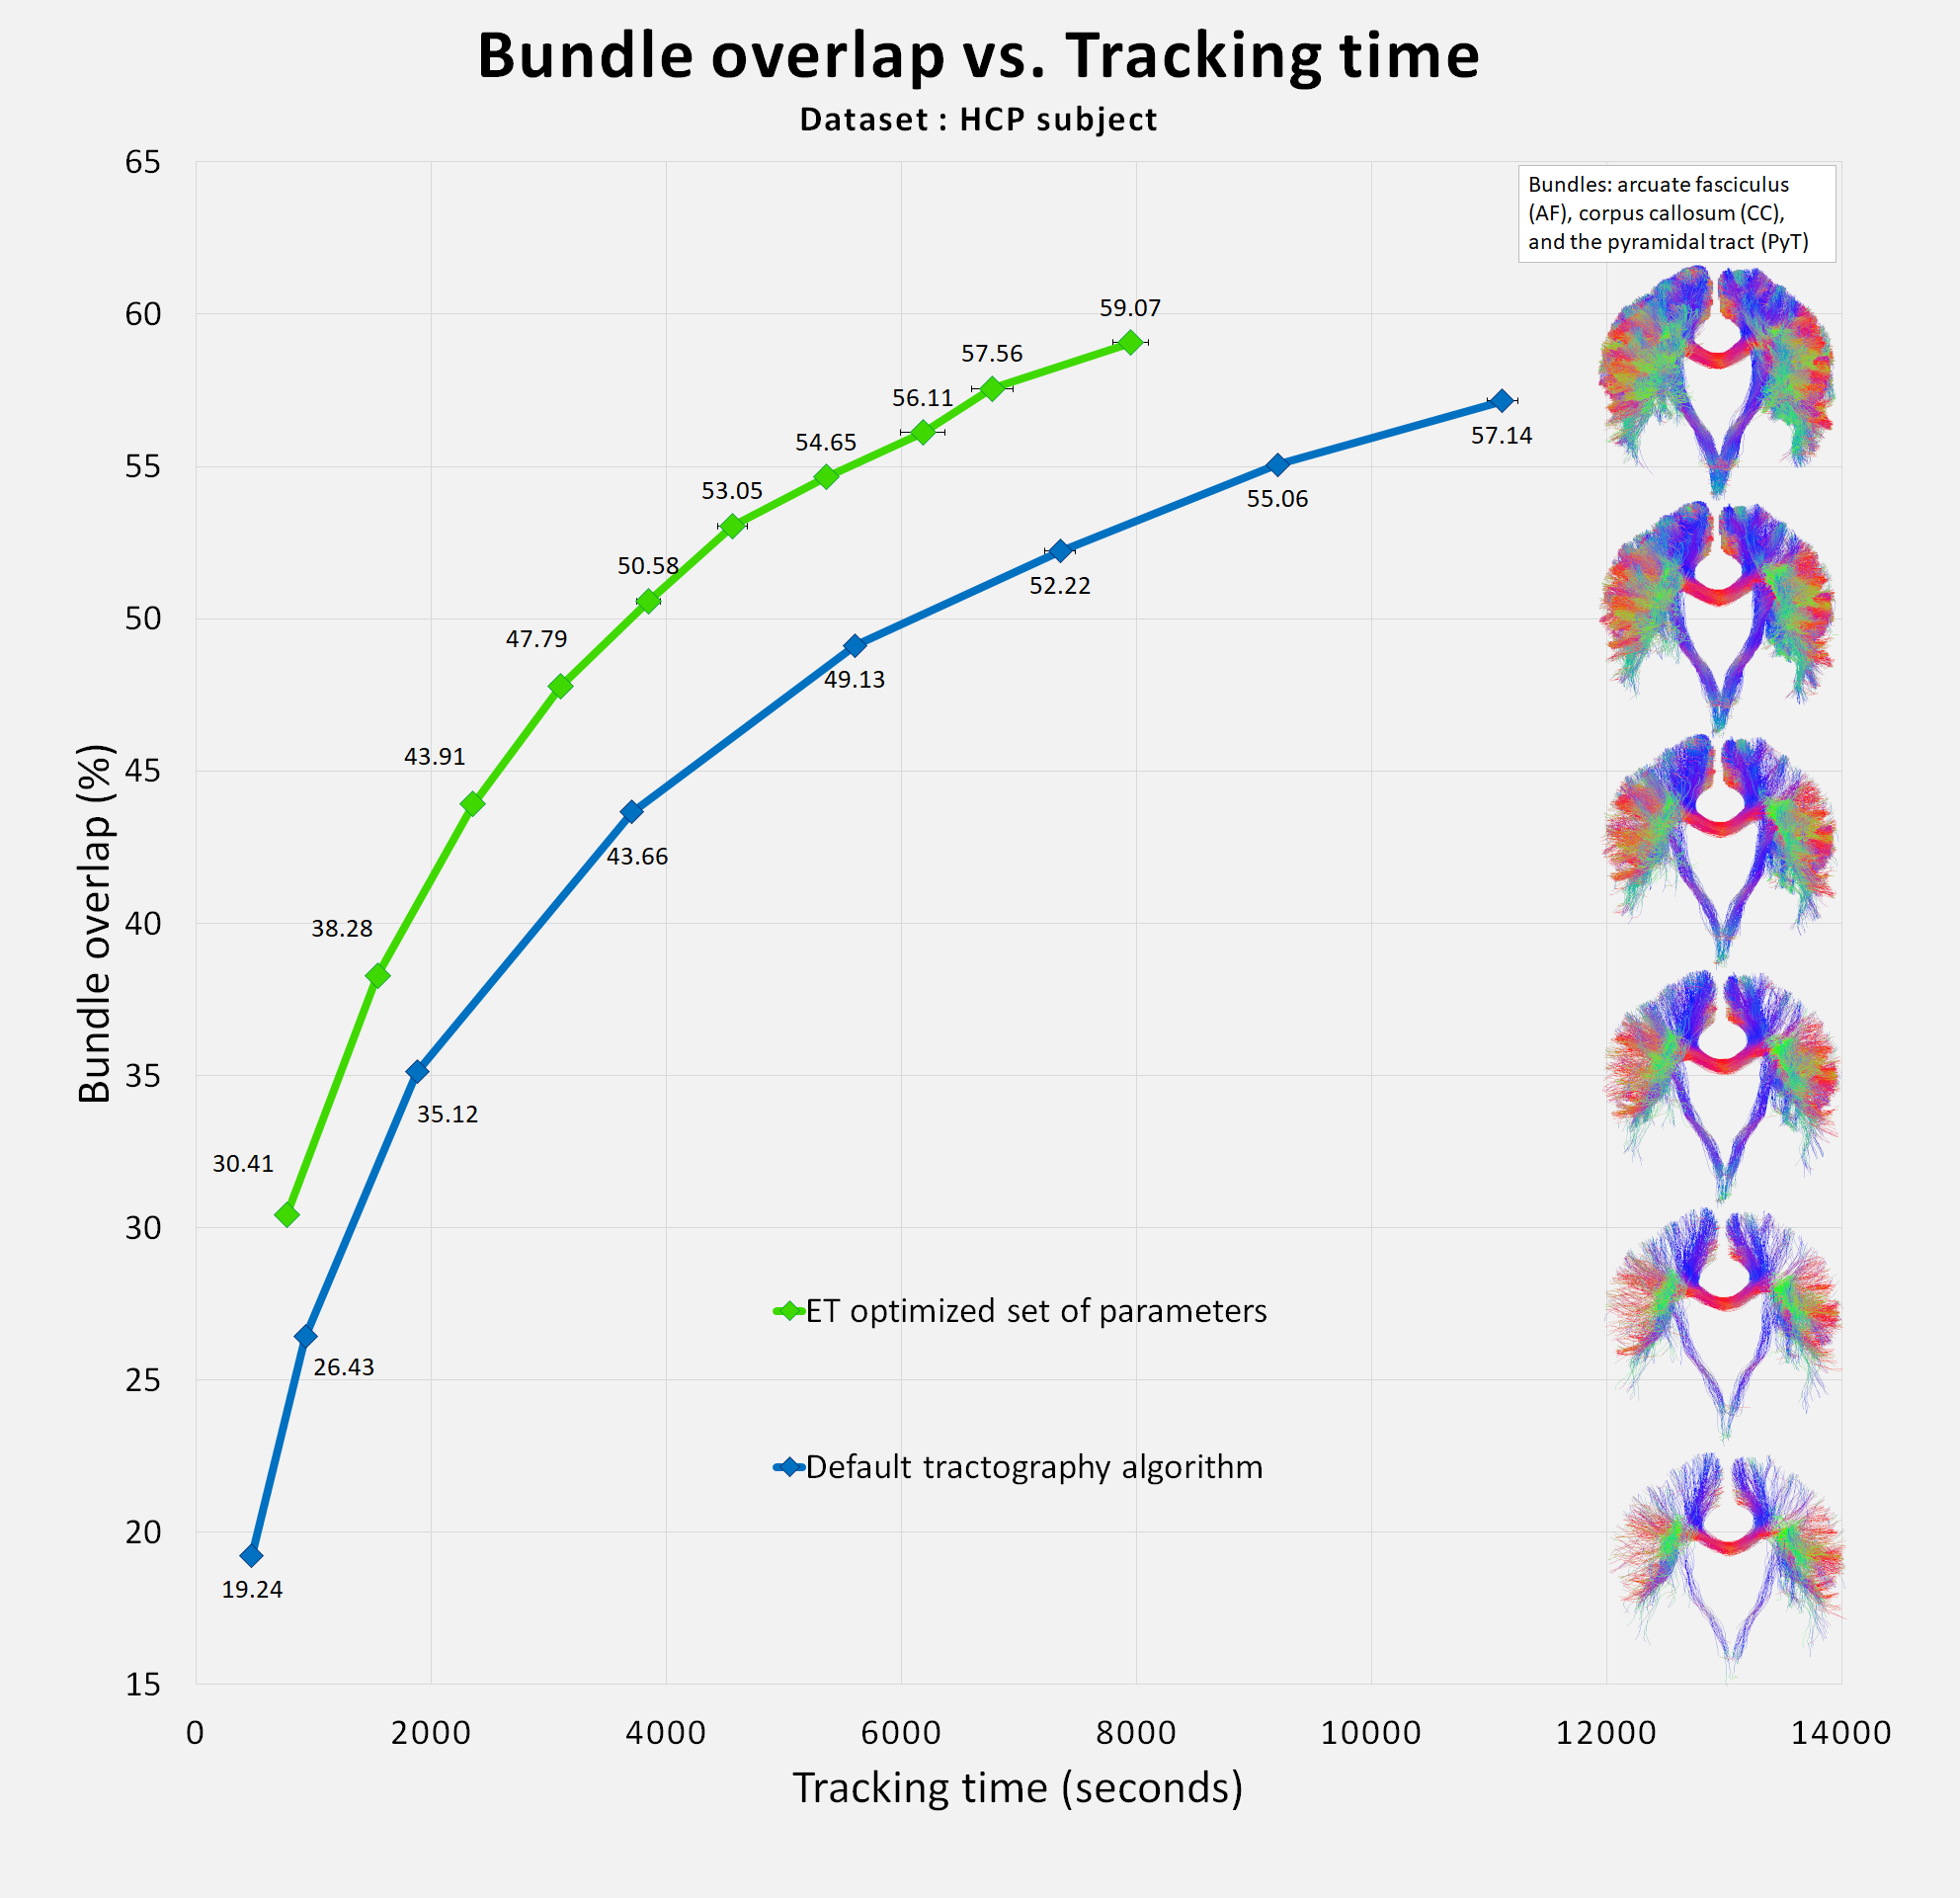
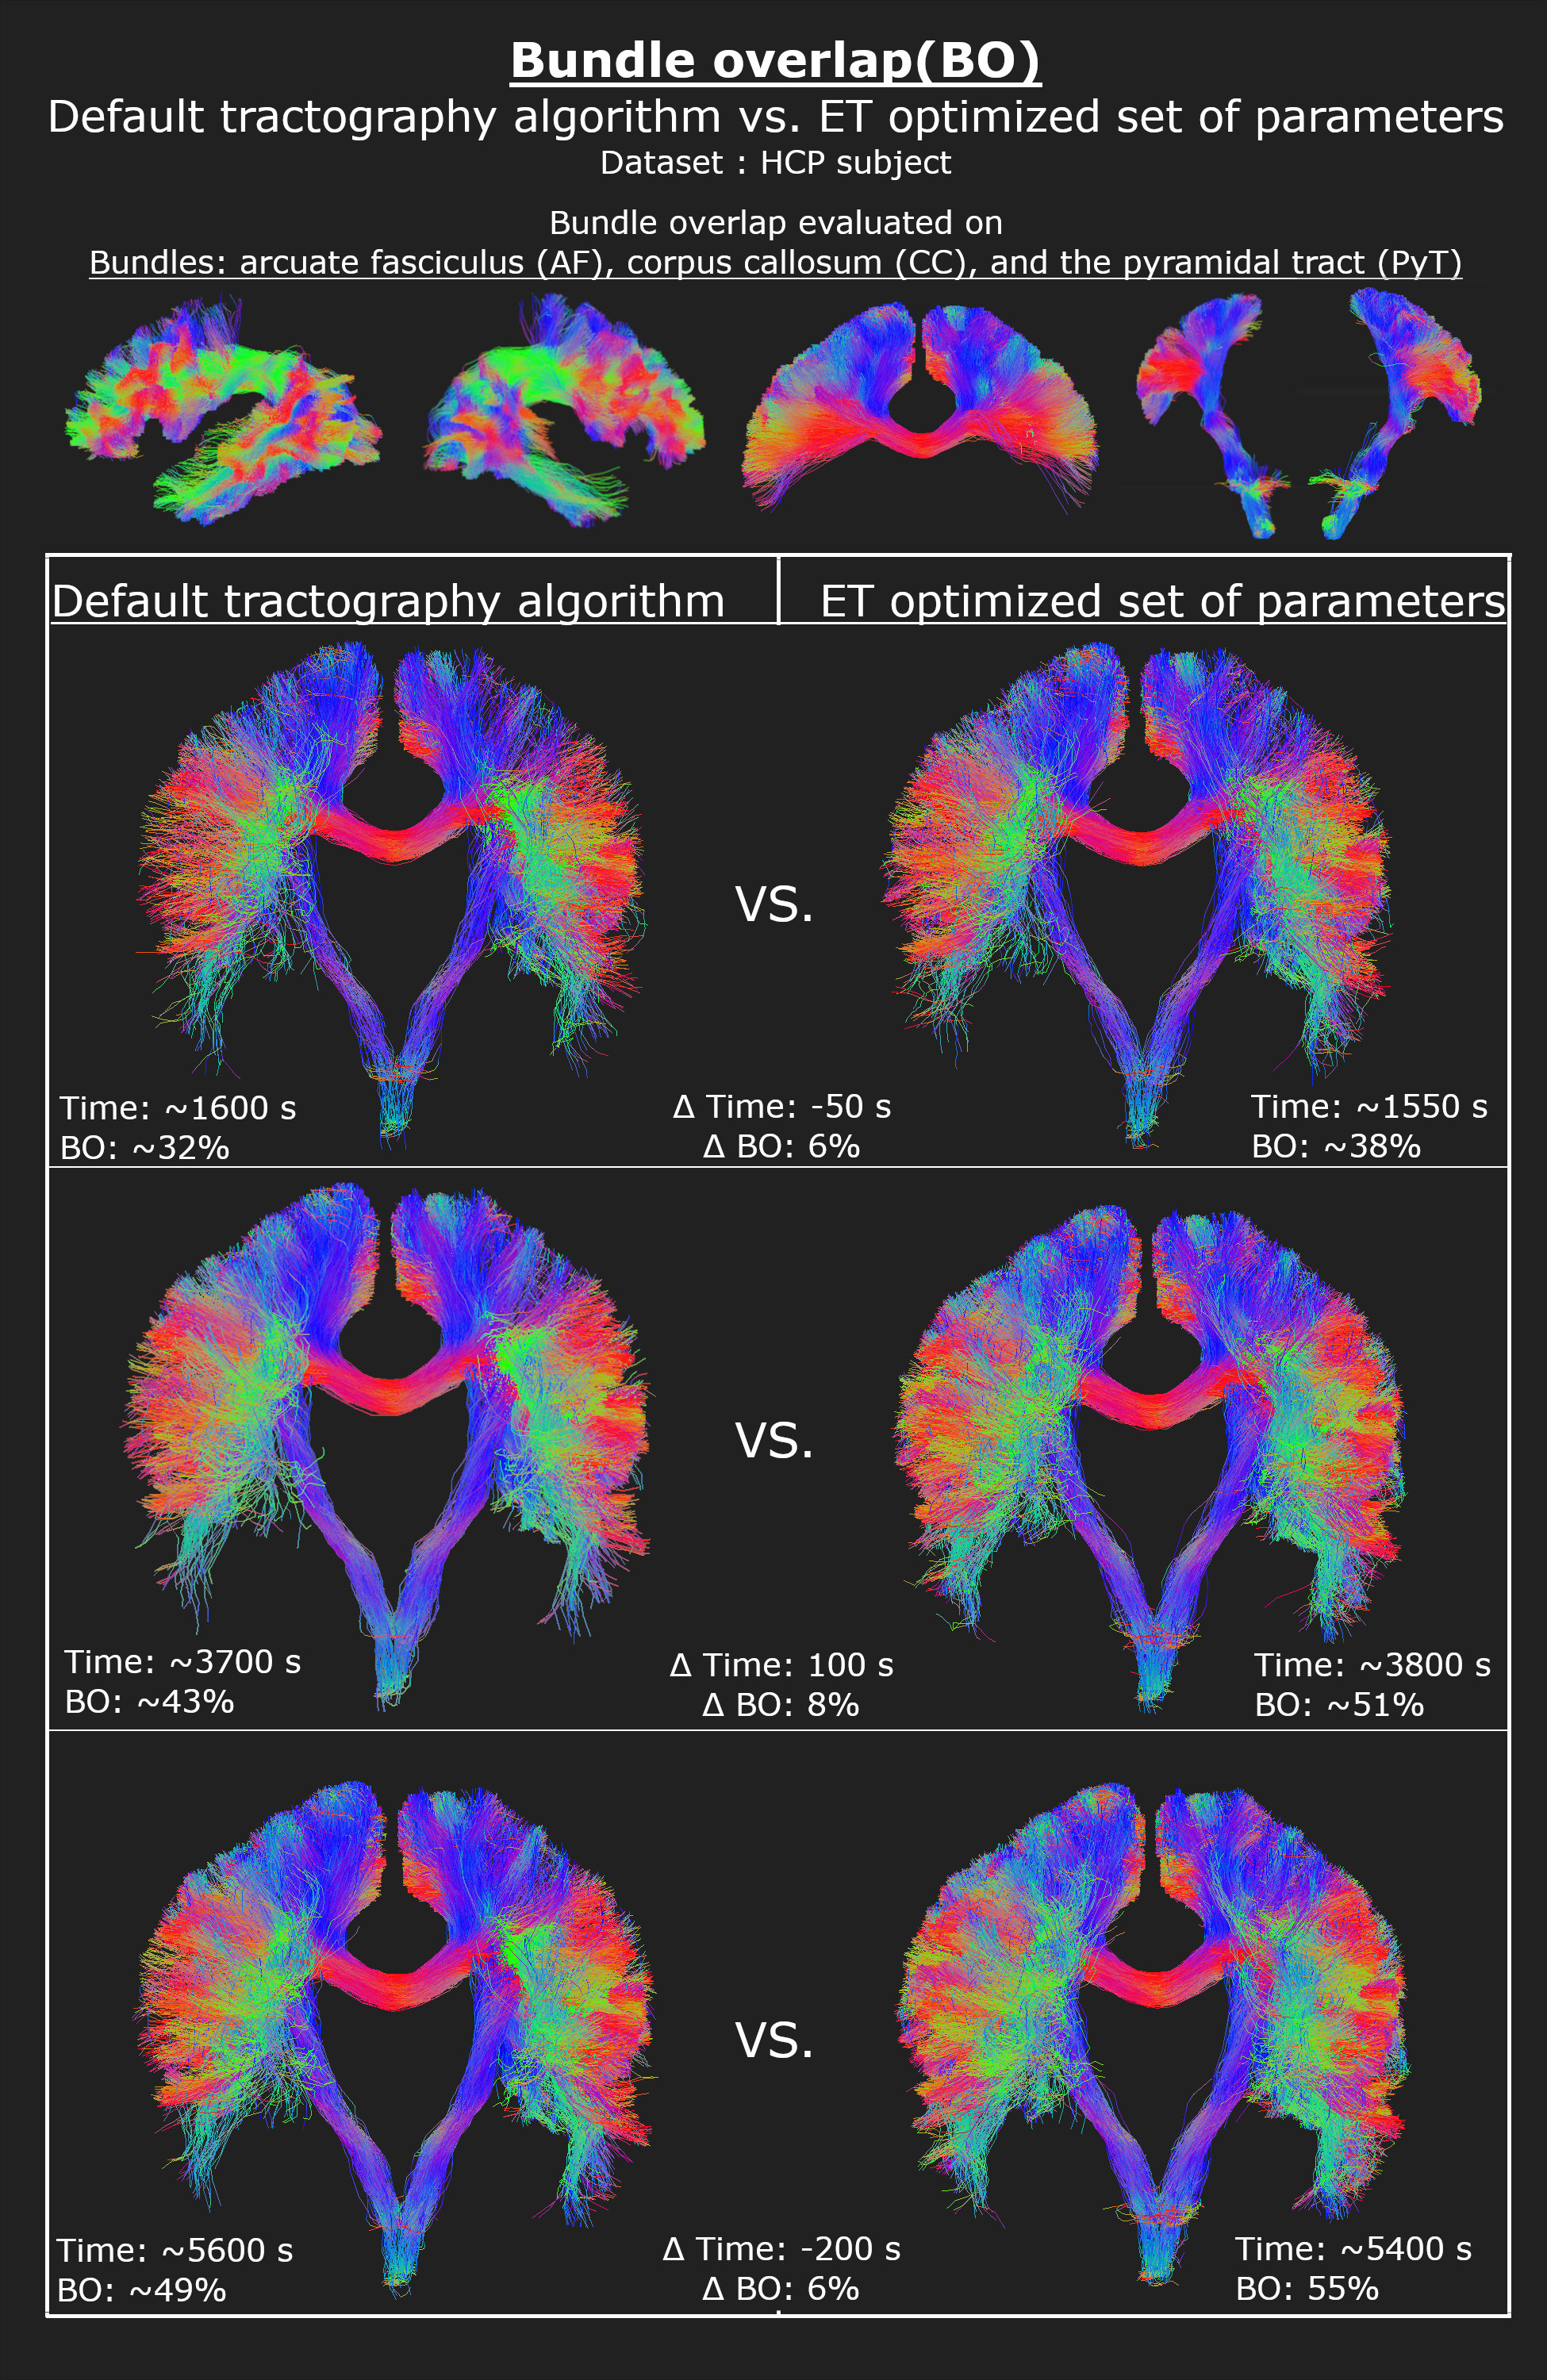
Ensemble tracking (ET) tasks were combined using nextflow11, a pipelining framework that allows to combine multiple scripts into one command-line call. The ET nextflow pipeline is shown in Fig. 2. In this work, the ET parameters allowed to vary were: (i) the tracking algorithm used ([deterministic, probabilistic, local, pft]: (ii) the seed density (10 per voxel): (iii) tracking step size ([0.1, 0.5, 1.0] mm); (iv) the maximum angle between steps [10°, 20°, 30°, 40°]; and (v) the sampling sphere of fODFs (100, 200 or 724 directions). The pipeline produces tractograms for all permutations of parameters. Resulting tractograms were scored separately producing a performance report including: true connections (TC), false connections (FC), no connections (NC), and bundle overlap (BO) measures. The Fibercup phantom12,13,14 was used to establish a gold standard in terms of the BO score, over a large set of tracking parameters. These results were then used to optimise the tracking time while remaining in close range to the gold standard BO. Resulting tractograms were filtered using a recent unsupervised deep learning autoencoder-based technique, called FINTA15. FINTA allows to overcome some of the shortcomings of classical filtering methods by filtering the undesired streamlines based on a learned embedded streamline space.The ET optimized set of parameters were applied on real data from the Human Connectome Project (HCP)16 database. Bundle specific tracking17,18 of the arcuate fasciculus (AF), corpus callosum (CC), and the pyramidal tract (PyT) was used as the gold standard for the HCP data. The ET-produced tractograms were compared to resulting tractograms from a default tractography algorithm using parameters (probabilistic; 20° aperture angle; 0.5 mm step size; and 724 points fODF). To compare the methods' efficiency, the BO scores from the resulting tractograms were plotted as a function of the elapsed tracking time.
Results
The gold standard tractogram set on the Fibercup has a BO of 98%. Then, a configuration of parameters that led to 96% BO in half the time was found (Fig. 3).Moreover, as seen in Fig. 4, on an HCP subject, the ET optimized set of parameters obtains a better average BO in the considered bundles when compared to a default tractography algorithm. If we examine similar BO results, the ET BO value of 55% took 1h30min, compared to the default tracking BO value of 54% requiring 2h35min. On average, ensemble tracking required approximately 62% of the time for a similar BO from default tracking.
Discussion
The proposed ET pipeline shows a large spatial extent recovery of the WM, doing so by generating the most diverse set of streamlines. It is expected that this will come at the cost of producing more false positive connections. Hence, ET must be accompanied with an advanced filtering technique in order to get a good trade-off between specificity and sensitivity19. In this work, we have used a recent deep-learning tractography filtering method15, but future work should investigate the impact of filtering and compare with other available techniques8,9,20,21. In our real data experiment, the segmentation of the different bundles acts as the filtering procedure.The time disparity observed when comparing the BO results as a function of the tracking time can be explained by the influence of the parameters on propagating the streamlines. Streamlines from lenient or strict parameters will often stop early, while “average optimal” parameters are likely to go farther down the correct paths, hence taking longer tracking times. This shows that ET is more efficient at producing a tractogram with a great diversity of streamlines, and consequently a high BO (Fig. 5).
Conclusion
The proposed ET pipeline allows to efficiently produce whole brain tractograms with better spatial coverage compared to single tracking methods using one set of parameters. Tractograms generated using this method contain a more diverse streamline set. Our ET pipeline is a useful tool to test multiple combinations of parameters to blend the optimal settings for each bundle individually and on the whole tractogram.Acknowledgements
No acknowledgement found.References
1. Chamberland, M., Whittingstall, K., Fortin, D., Mathieu, D., Descoteaux, M. (2014). Real-time multi-peak tractography for instantaneous connectivity display. Front. Neuroinform. https://doi.org/10.3389/fninf.2014.00059
2. Mangin, J. (2002). A framework based on spin glass models for the inference of anatomical connectivity from diffusion-weighted mr data - a technical review.NMR Biomed. 15 (7-8), 481-492
3. Kreher, B.W., Mader, I., Kiselev, V.G. (2008). Gibbs tracking: a novel approach for the reconstruction of neuronal pathways. Magn. Reson. Med. 60 (4), 953-963.
4. Fillard, P., Poupon, C., Mangin, J.-F. (2009). A novel global tractography algorithm based on an adaptive spin glass model. Proceedings of MICCAI. Vol. 1, pp. 927-934.
5. Reisert, M., Mader, I., Anastasopoulos, C., Weigel, M., Schnell, S., Kiselev, V. (2011). Global fiber reconstruction becomes practical. NeuroImage, 54, 955-962.
6. Takemura, H., Caiafa, C.F., Wandell, B.A., Pestilli, F. (2016) Ensemble Tractography. PLoS Comput Biol 12(2): e1004692. doi:10.1371/journal.pcbi.1004692
7. Pestilli, F., Yeatman, J.D., Rokem, A., Kay, K.N., Wandell, B.A. Evaluation and statistical inference for living connectomes. Nat Methods. 2014 Oct; 11(10): 1058–1063.
8. Daducci, A. Dal Palù, A., Lemkaddem, A., Thiran, J.-P. (2015). COMMIT: Convex optimization modeling for microstructure informed tractography. IEEE Trans Med Imaging. 34(1):246-57. doi: 10.1109/TMI.2014.2352414
9. Schiavi, S., Ocampo-Pineda, M., Barakovic, M., Petit, L., Descoteaux, M., Thiran, J.-P., Daducci, A. (2020). A new method for accurate in vivo mapping of human brain connections using microstructural and anatomical information. Science Advances. 6(31). doi: 10.1126/sciadv.aba8245
10. Theaud, G., Houde, J.-C., Boré, A., Rheault, F., Morency, F., Descoteaux, M.,TractoFlow: A robust, efficient and reproducible diffusion MRI pipeline leveraging Nextflow & Singularity, NeuroImage, https://doi.org/10.1016/j.neuroimage.2020.116889.
11. Di Tommaso, P. et al. Nextflow enables reproducible computational workflows. Nature Biotechnology 35, 316–319 (2017) https://doi.org/10.1038/nbt.3820
12. Poupon, C., Laribiere, L., Tournier, G., Bernard, J., Fournier, D., Fillard, P., Descoteaux, M., et al. (2010). A Diffusion Hardware Phantom Looking Like a Coronal Brain Slice. Proceedings of the International Society for Magnetic Resonance in Medicine.
13. Fillard, P., Descoteaux, M., Goh, A., Gouttard, S., Jeurissen, B., Malcolm, J., Ramirez-Manzanares, A., et al. (2011). Quantitative Evaluation of 10 Tractography Algorithms on a Realistic Diffusion MR Phantom. NeuroImage, 56(1), 234–220.
14. Poupon, C., Rieul, B., Kezele, I., Perrin, M., Poupon, F., Mangin, J.-F. (2008). New Diffusion phantoms dedicated to the study and validation of HARDI models. Magnetic Resonance in Medicine, 60, 1276–1283.
15. Legarreta, J.H., Petit, L., Rheault, F., Theaud, G., Lemaire, C., Descoteaux, M., Jodoin, P.-M. Tractography filtering using autoencoders. arXiv:2010.04007 [eess.IV].
16. Van Essen, D.C., Smith, S.M., Barch, D.M., Behrens, T.E., Yacoub, E., Ugurbil, K.; WU-Minn HCP Consortium. The WU-Minn Human Connectome Project: an overview. Neuroimage. 2013 Oct 15;80:62-79. doi: 10.1016/j.neuroimage.2013.05.041. Epub 2013 May 16. PMID: 23684880; PMCID: PMC3724347.
17. Rheault, F., et al. "Bundle-specific tractography with incorporated anatomical and orientational priors." NeuroImage 186 (2019) https://doi.org/10.1016/j.neuroimage.2018.11.018
18. Kurtzer, G.M., Sochat, V., Bauer, M.W. Singularity: Scientific containers for mobility of compute. PLoS ONE 12(5): e0177459 (2017) https://doi.org/10.1371/journal.pone.0177459
19. Maier-Hein, K., Neher, P., Houde, J.-C., Caruyer, E., Daducci, A., Dyrby, T., … Descoteaux, M. (2017). Tractography Challenge ISMRM 2015 High-resolution Data [Data set]. Zenodo. http://doi.org/10.5281/zenodo.579933
20. Ocampo-Pineda, M., Schiavi, S., Frigo, M., Barakovic, M., Girard, G., Descoteaux, M. , Thiran, J.-P., Daducci, A. (2019). Reducing false-positive connections using hierarchical microstructure-informed tractography. 27th Annual Meeting \& Exhibition the International Society for Magnetic Resonance in Medicine (ISMRM). Abstract 3371. May 11-16. Montréal, Canada.
21. Jörgens, D., Descoteaux, M., Moreno, R. (2021). Challenges for Tractogram Filtering. Özarslan, E. et al. (eds.). Anisotropy Across Fields and Scales, Mathematics and Visualization. Springer. doi: 10.1007/978-3-030-56215-1_7 (in press).
Figures