4297
Surface-based Short Association Fibre Tractography1Cardiff University Brain Research Imaging Centre (CUBRIC), Cardiff University, Cardiff, United Kingdom, 2Department of Neurosurgery, University Hospital of Wales, Cardiff, United Kingdom, 3BRAIN Biomedical Research Unit, Health & Care Research Wales, Cardiff, United Kingdom, 4Image Sciences Institute, University Medical Center Utrecht, Utrecht, Netherlands, 5Department of Neurology, University Hospital of Wales, Cardiff, United Kingdom
Synopsis
We propose a method of utilising mesh representations of cortical surfaces for generating tractograms of short association fibres facilitating a focused investigation into superficial white matter in health and disease. The method additionally allows to relate streamline metrics to surface topology in native space before registration for comparisons within and between subjects is performed. Our approach is applied to state-of-the-art test-retest data and shows good-to-excellent repeatability.
Introduction
It is established that neighbouring cortical areas exhibit the strongest structural connectivity,1 largely by way of short association fibres (SAF) which comprise around 60% of the white matter volume.2 Diffusion MRI (dMRI)-based studies have shown superficial white matter differences with age, sex, and pathology.3-6 Tractography can enhance the study of SAF by offering morphological detail; however, it has its challenges. The proximity of SAF to the cortex makes them sensitive to gyral bias7 and may cause volumetric masks to remove important detail during filtering, while cortical folding variability8 disproportionately affects registration quality of this superficial compartment during comparisons. To mitigate these limitations, our framework incorporates mesh representation of the cortical surface into seeding and filtering steps. It additionally allows to relate streamline metrics to the surface in native space for comparisons.Methods
Repeatability dataSix healthy adults (M/F=3/3) were imaged five times (as described in 9) using an ultra-high gradient 3T Connectom scanner.10 Data (dMRI) were acquired (voxel-size: 2×2×2 mm3; b-values: 200/500/1200/2400/4000/6000 s/mm2 in 20/20/30/61/61/61 directions with thirteen b0 volumes; TR/TE 3000/59 ms) and preprocessed.9 Fibre orientation distributions (FODs)11 were derived using 3-tissue response function estimation12 and subsequent MSMT-CSD (lmax=8).13 Structural T1 (voxel-size: 1x1x1 mm3) were processed with longitudinal stream14 in FreeSurfer 7.115 and non-linearly registered to dMRI (upsampled to 1x1x1 mm3) with ANTs.16
Tractogram generation
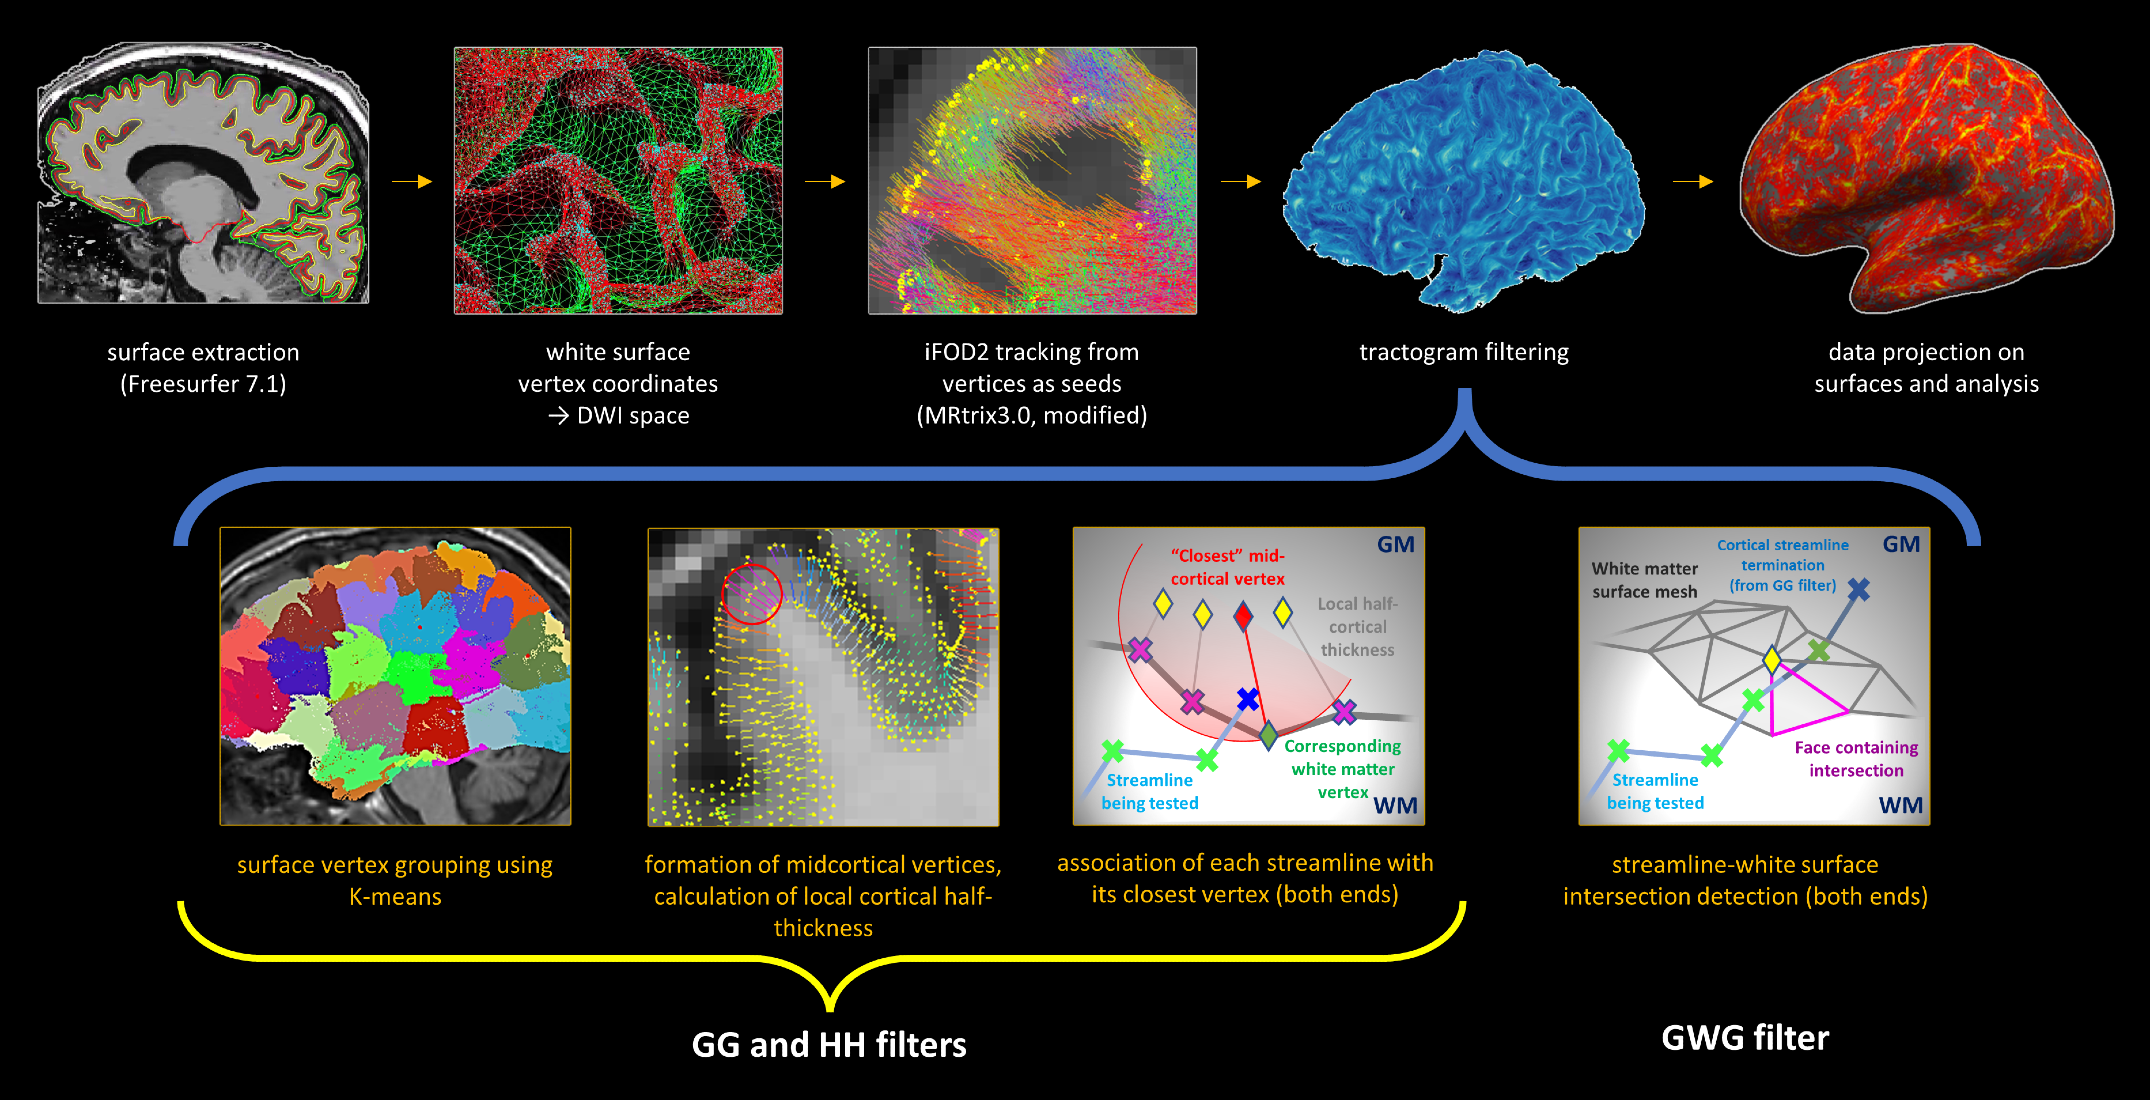
Tractography was performed using MRtrix 3.017 modified to allow seeding from coordinates, with FreeSurfer white matter surface mesh (WSM) vertices in dMRI space as seeds, 5M attempts, probabilistic tracking,18 streamline length ≤40 mm. Filtering was performed in Matlab 2015a using a novel set of rules selecting streamlines: (1) where both ends terminate in neocortex; (2) where both ends terminate in the same hemisphere; (3) that course through the white matter. Mid-cortical coordinates (MCC) were defined as the averaged coordinates of matching WSM and pial vertices; the distance between MCC and its WSM vertex was defined as the local cortical half-thickness (LCHT). A streamline end was considered to lie in the cortex if the distance to its closest MCC did not exceed LCHT at that MCC. An iterative algorithm followed the streamline back searching for WSM intersection. The algorithm truncated intra-cortical portions and noted the WSM vertex closest to the intersection (Fig.1).
Framework evaluation
The surface seeding method was compared to MRtrix ACT/GMWMI method19 to evaluate its effect on subsequent filtering. For ACT/GMWMI, 5tt was modified to ensure only seeding from the cortical ribbon occurred. Next, SAF tractograms were compared using: (1) streamline counts, streamline length and streamline fractional anisotropy (FA); (2) track density imaging (TDI)20 maps; (3) streamline metrics projected on the surface (smoothed with FWHM 5 mm). All metrics were evaluated on: (1) precision using coefficient of variation (CV); (2) reliability using single measurement intraclass correlation coefficient ICC(2,1) with subject and session effects modelled as random, formulating data with a linear mixed-effects model.
Results
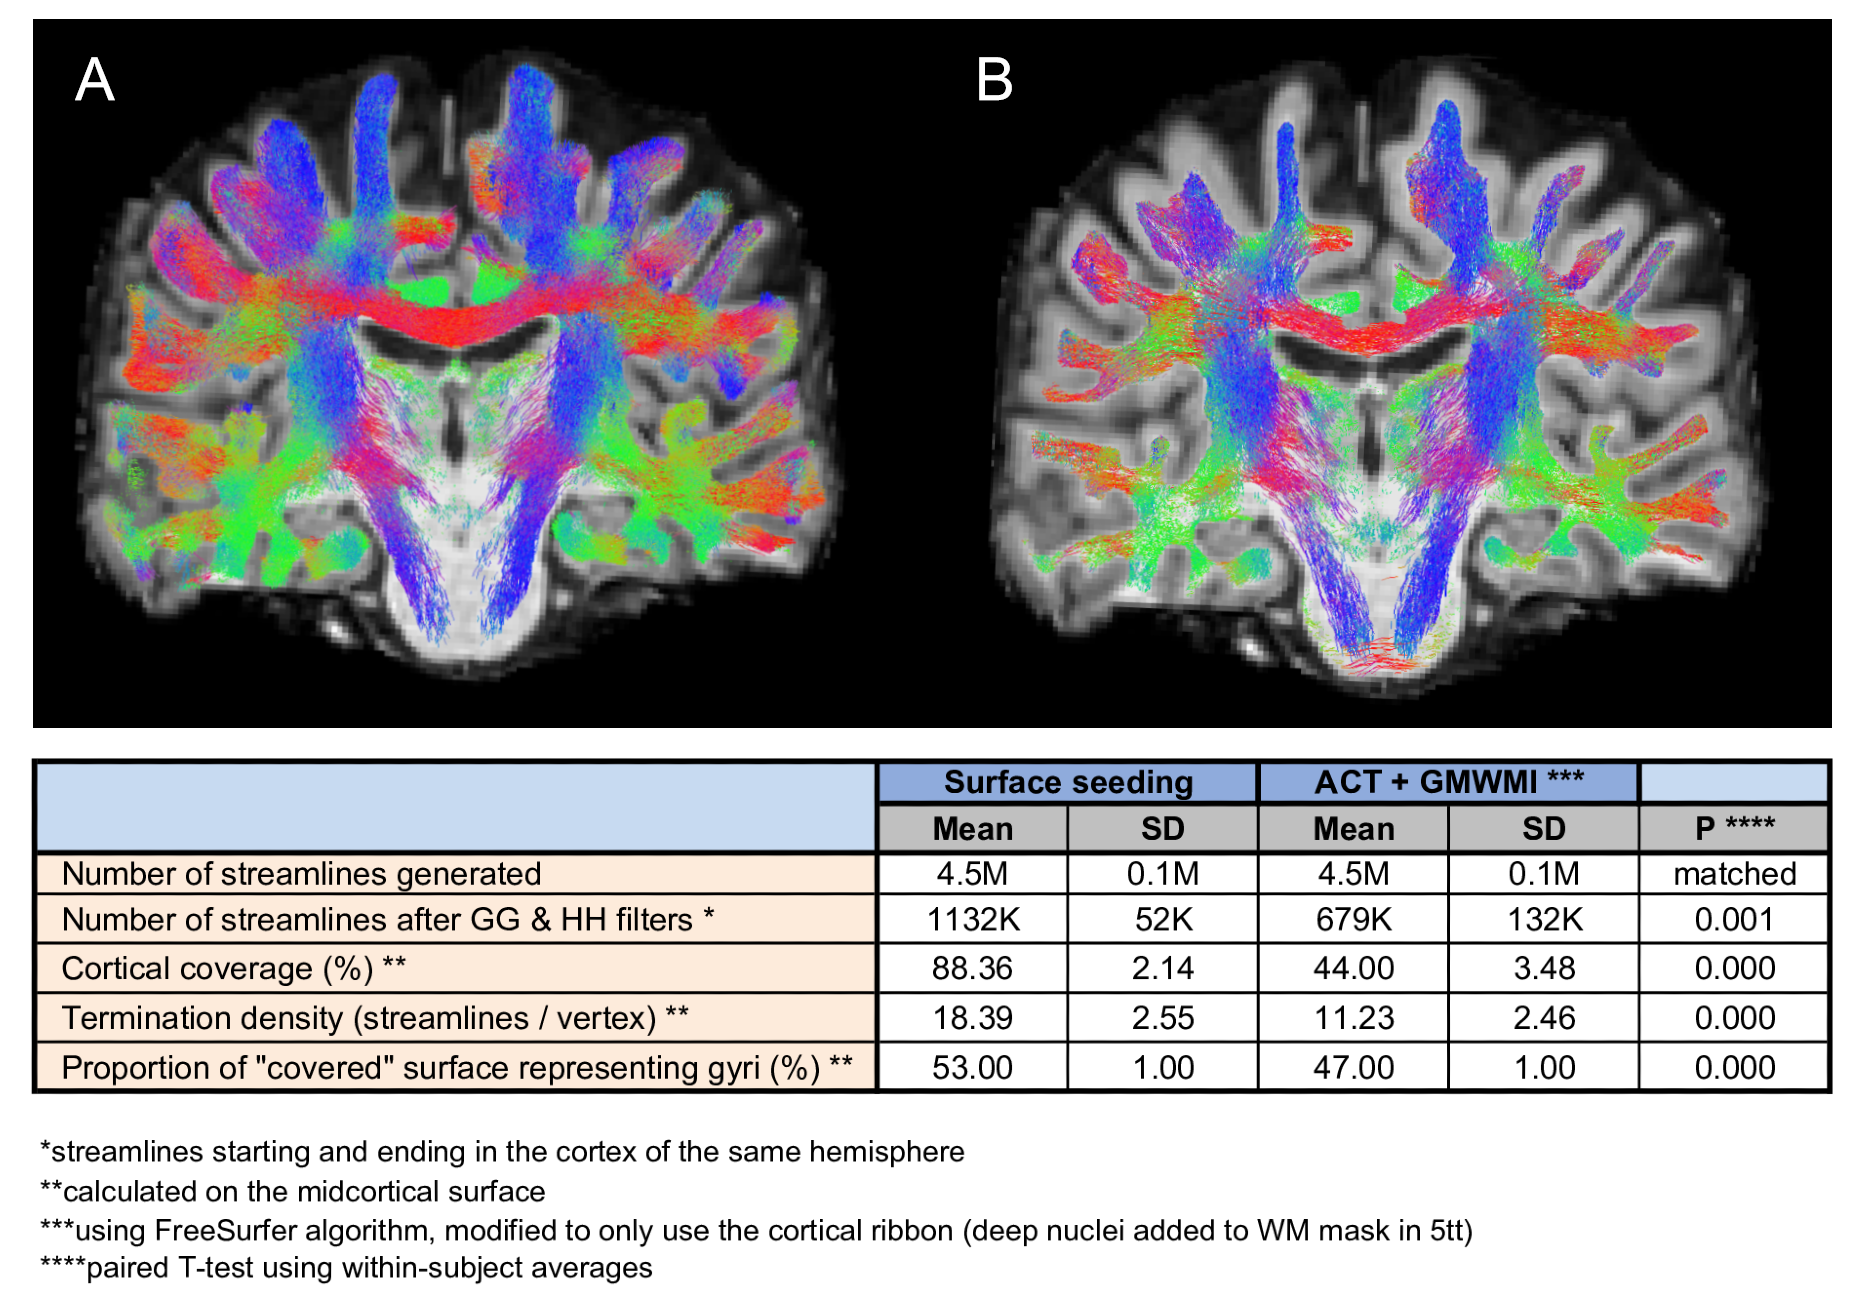
Effect of surface seedingCompared with ACT, surface seeding resulted in twice as many streamlines retained after initial filtering, ensuring both larger cortical coverage and more streamlines per vertex (Fig.2), likely because streamlines were allowed to propagate into the cortex ensuring more frequent registration of streamlines as “starting and ending in the cortex”.
Per-streamline measures
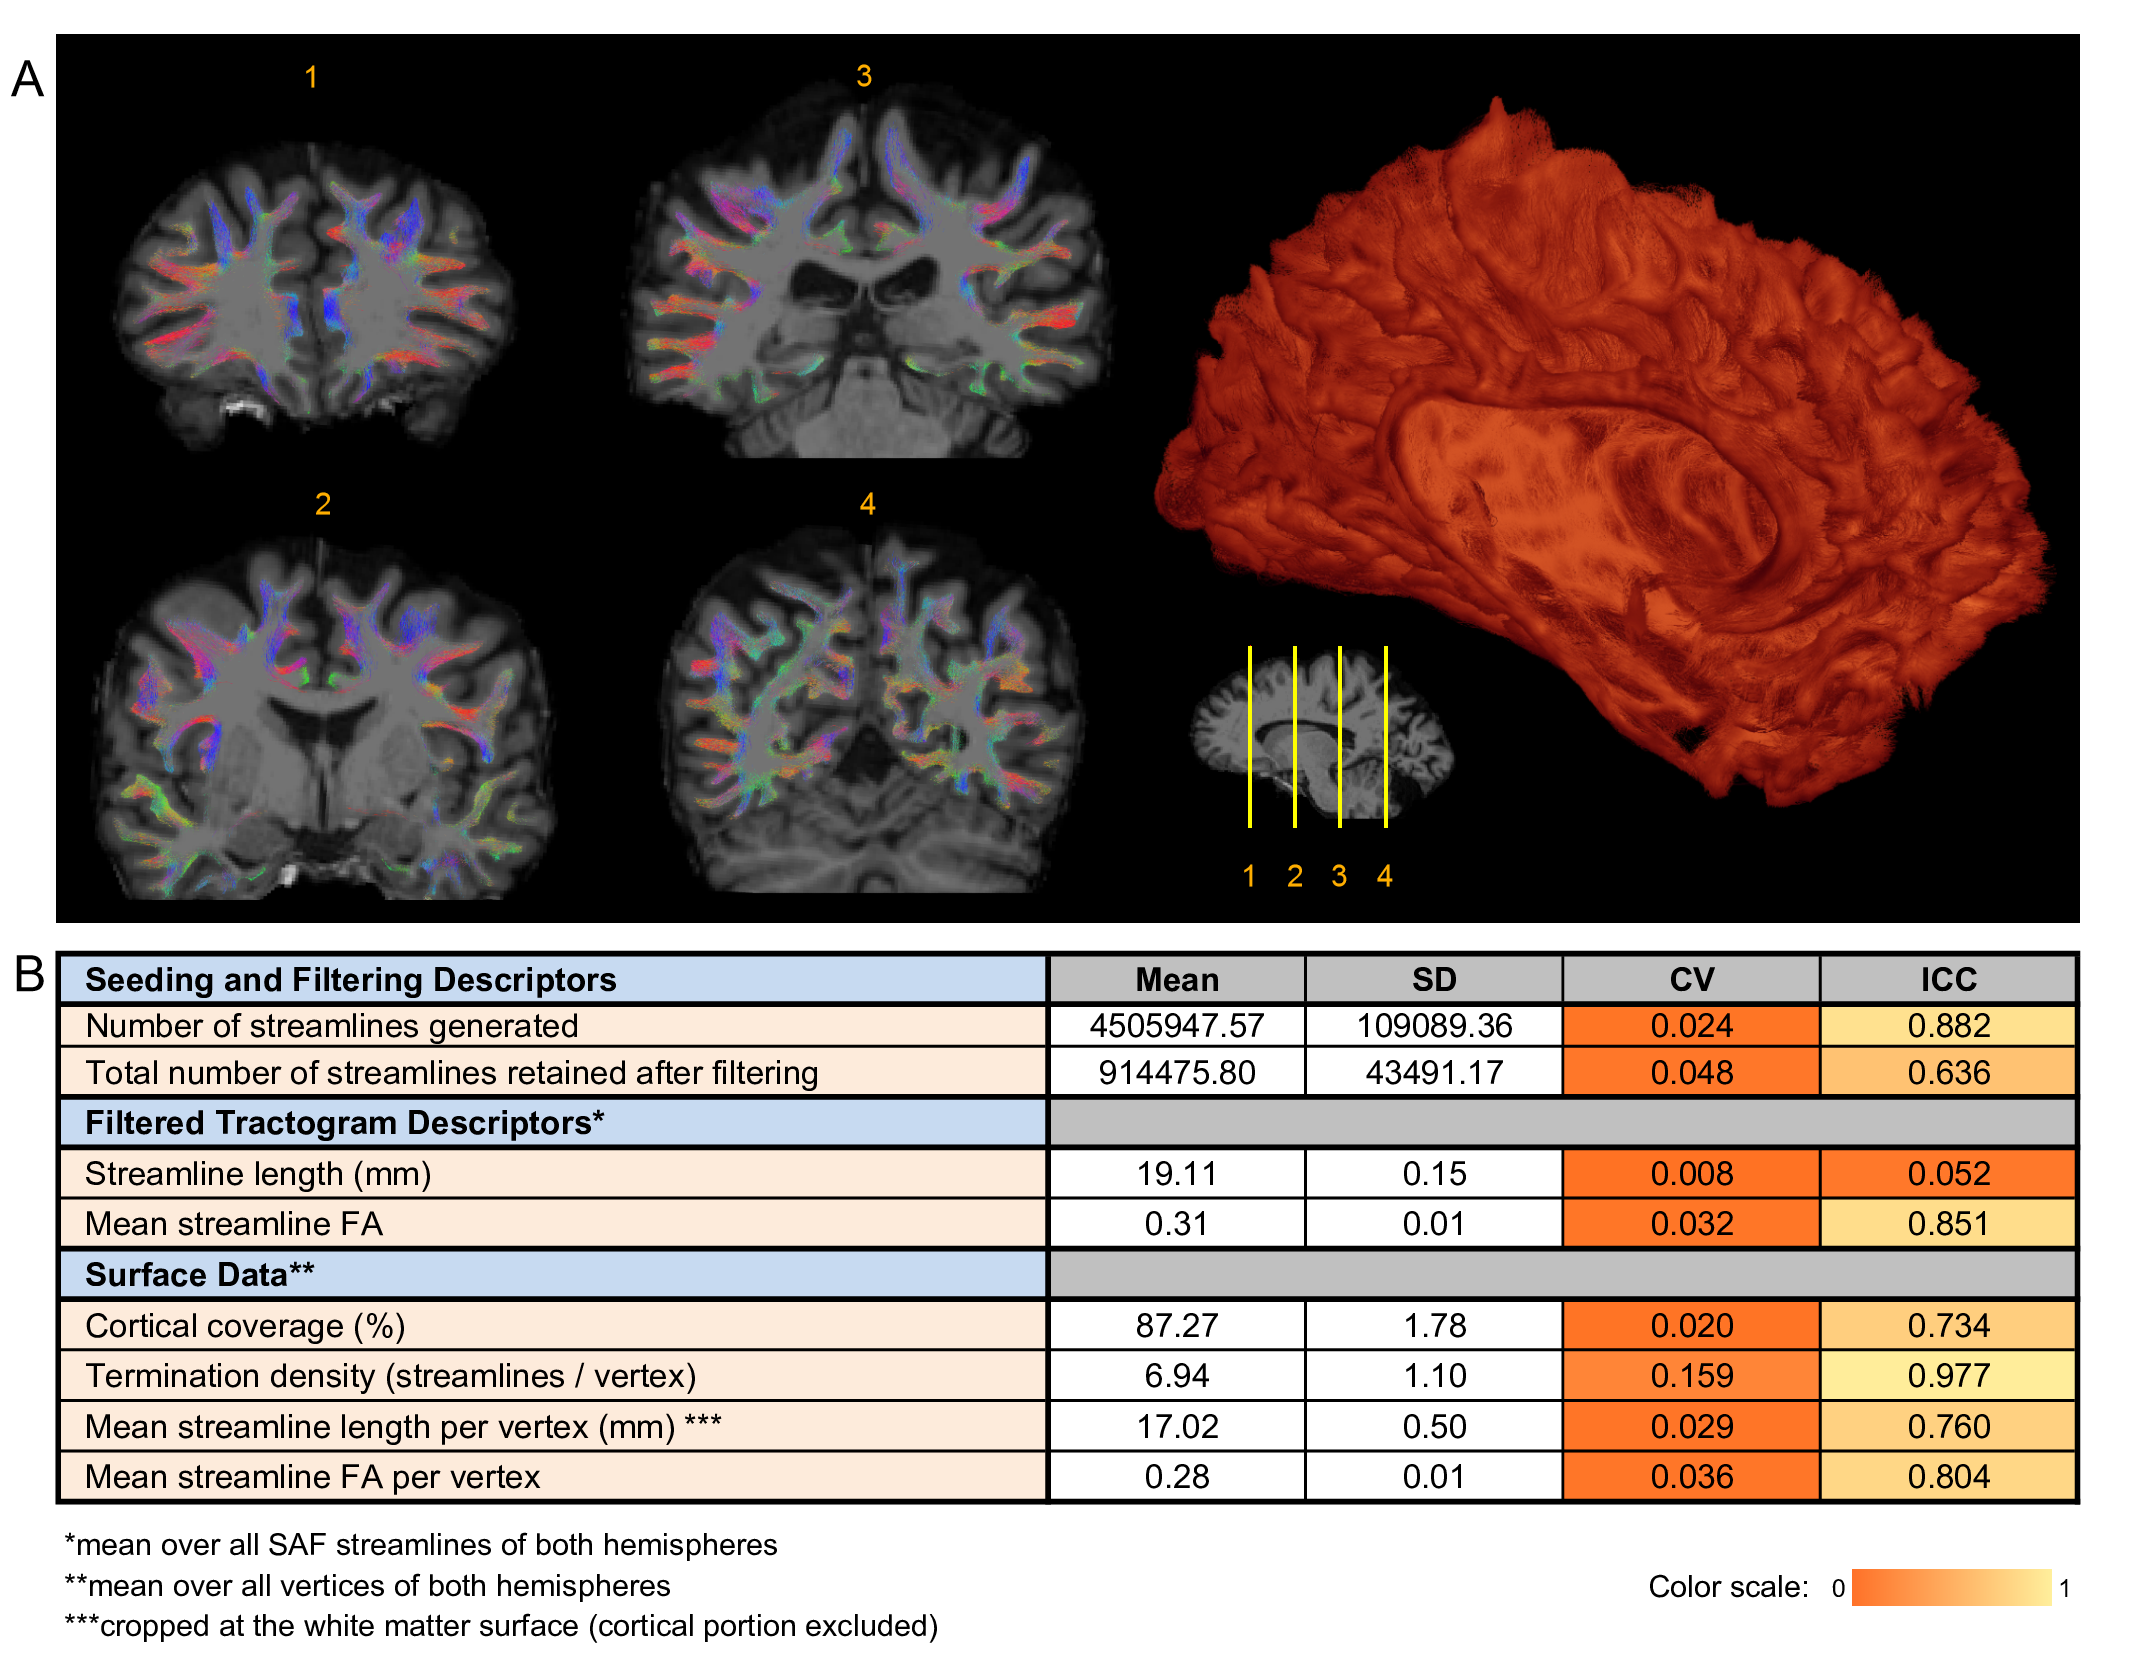
On visual inspection, all tractograms were anatomically consistent and no manual pruning was needed. Of the 4.5M+/-0.1M streamlines generated per dataset, 915K+/-44K remained after filtering (Fig.3). Mean streamline length was 19.11+/-0.15 mm after trimming; mean streamline FA was 0.31+/-0.01.
Track density imaging maps
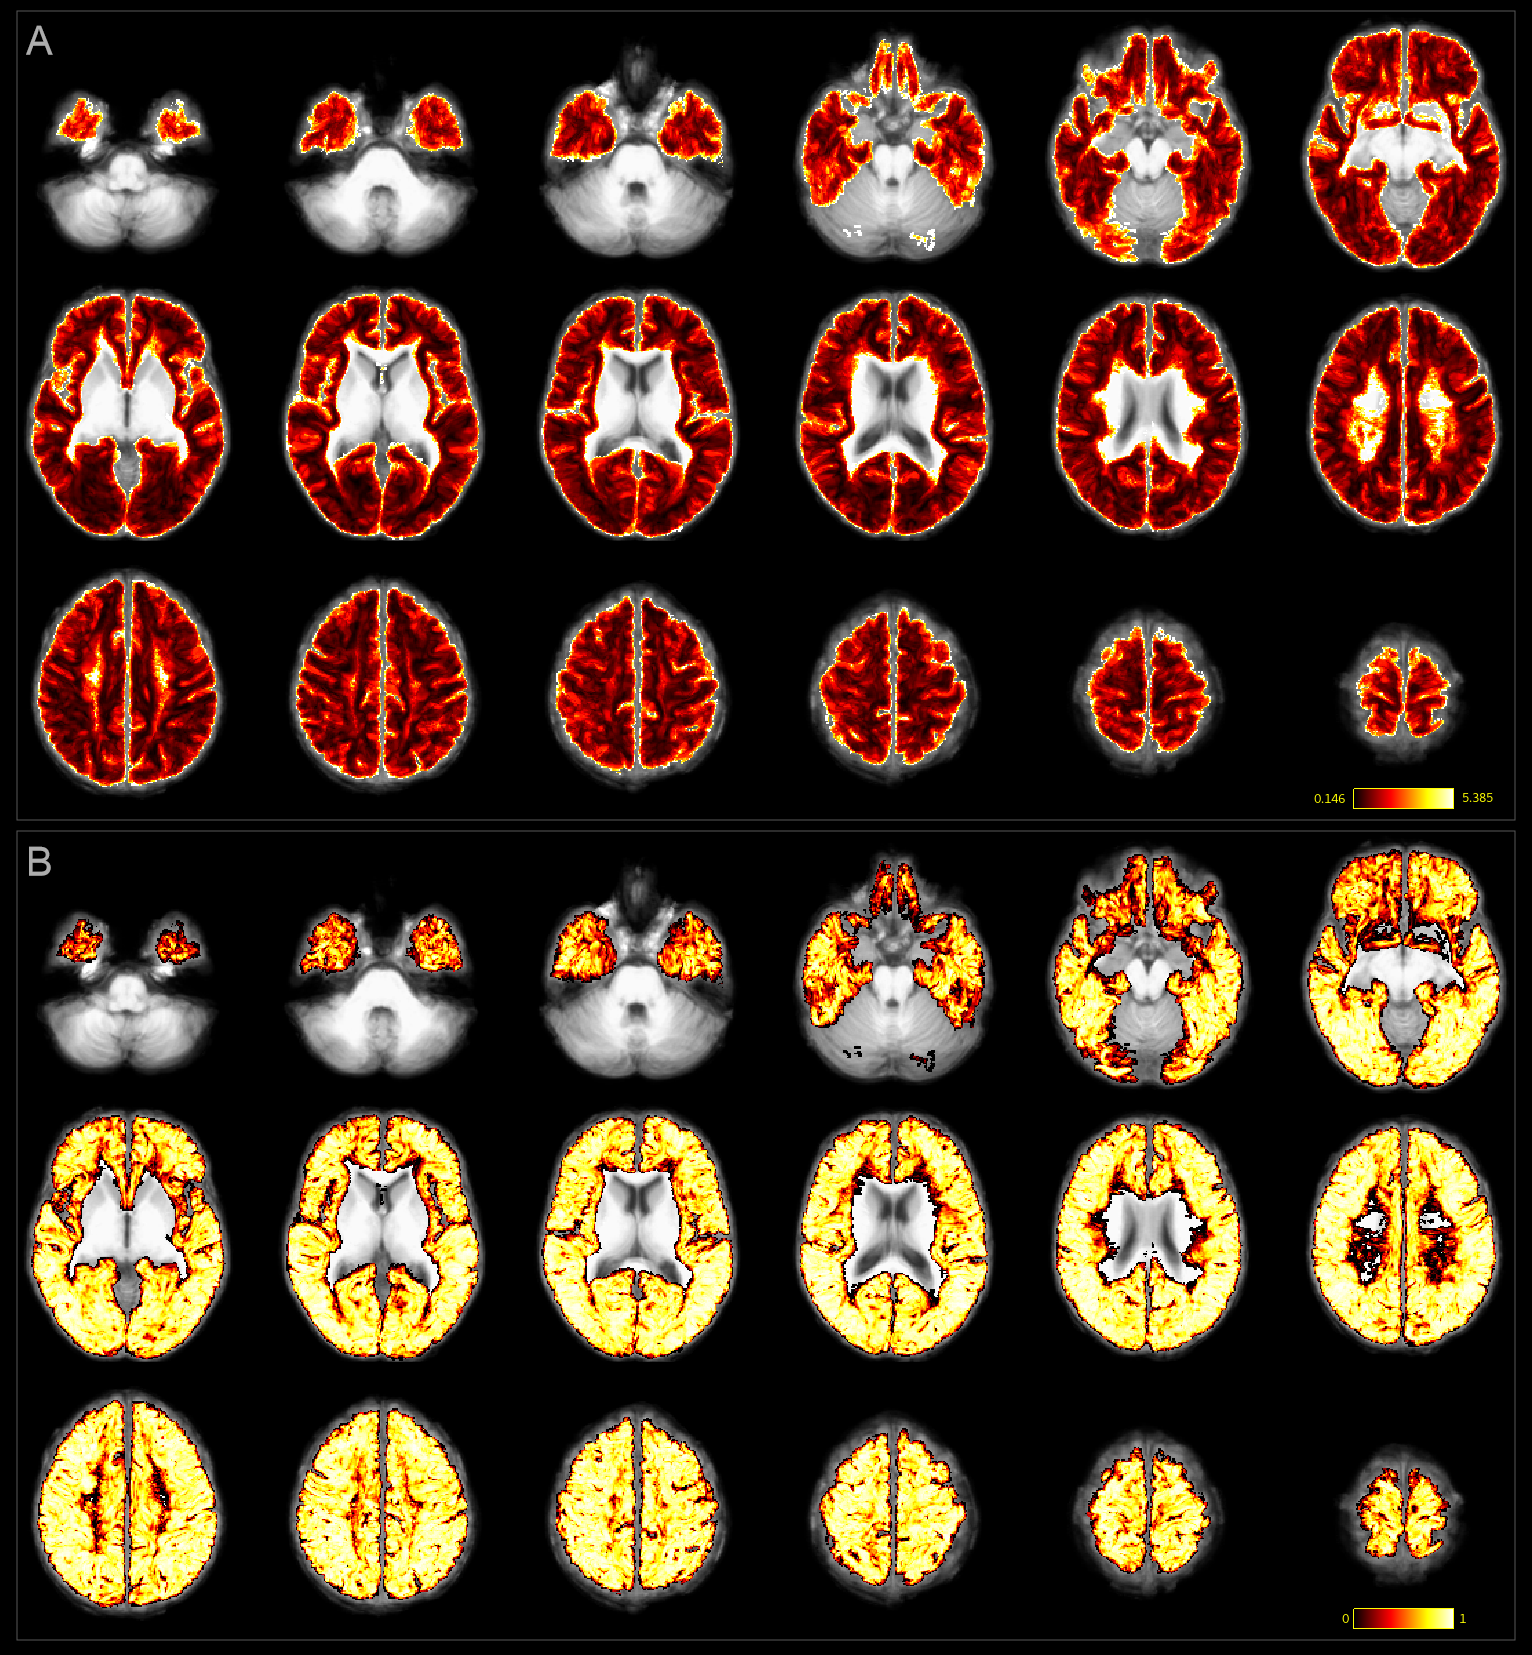
Individual TDI maps transformed into common space showed low precision in streamline count per voxel CV (>1 in 65% of white matter voxels, median:1.30); together with ICC close to 1 for most voxels, which suggested that TDI-based analysis of SAF was unlikely to be useful for detecting differences between subjects (Fig.4).
Surface-based analysis
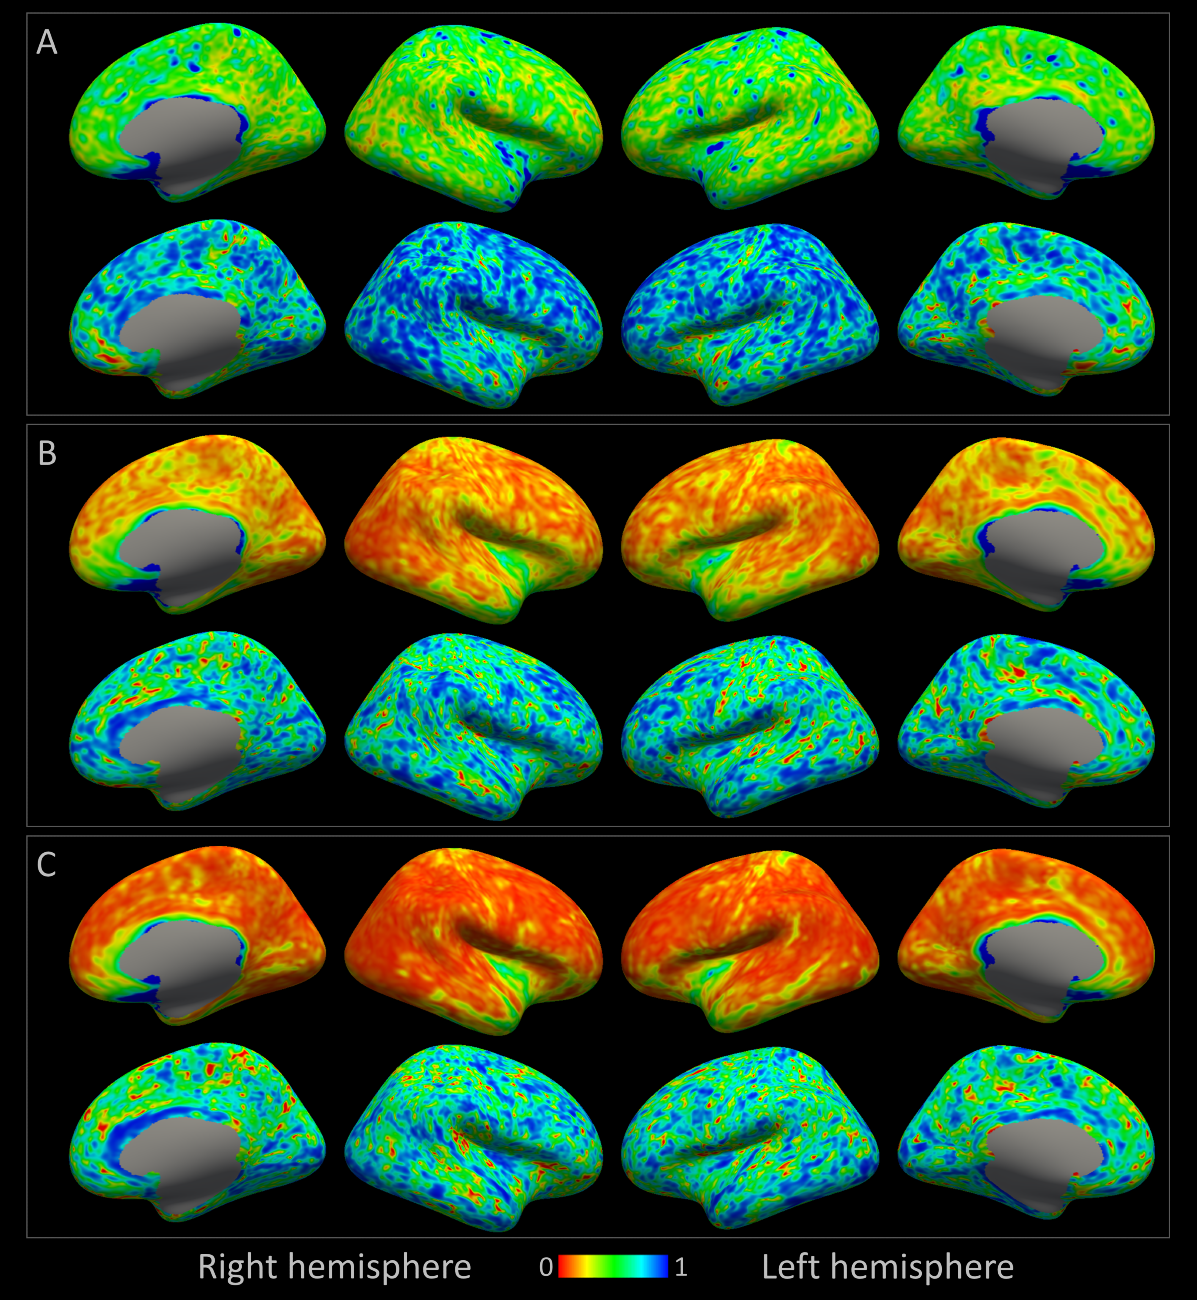
A consistently large cortical coverage (87.2%+/-1.8%) was achieved. Averaged termination density, streamline length/vertex and streamline FA/vertex showed low CV and high ICC (Fig.3). Compared to TDI, vertex-based analysis (Fig.5) suggested a higher precision in streamline counts per vertex (CV>1 in 2% of vertices, median:0.47) while maintaining a high ICC. Both mean streamline length and mean FA had low CV (high precision) and high-to-moderate ICC per vertex. Fronto- and temporo-basal areas showed the least consistency, likely due to susceptibility distortions and resulting T1-to-dMRI misalignment. Some effect of gyral bias, particularly on the medial side, was noted.
Discussion
The presented approach marries tractography with mesh representation of the cortex motivated by the close association of SAF with the latter. Using this approach, we demonstrate good reliability as well as high precision for a variety of SAF-related metrics both globally and regionally. The framework is modular and can be used for SAF filtering alone or to perform surface-based analysis, including together with cortex-related metrics. It can be adapted to incorporate semi-global tractogram optimisation algorithms.21,22 Further strategies aimed at reducing gyral bias can be added.23 Future work should also involve testing of repeatability with different scanners and on larger cohorts.Conclusion
Our novel superficial association fibres tractography framework consistently showed large cortical coverage and good-to-excellent repeatability, making it a plausible vehicle for investigating SAF in health as well as a number of neurological and psychiatric conditions.Acknowledgements
DKJ is supported by a Wellcome Trust Investigator Award (096646/Z/11/Z), a Wellcome Trust Strategic Award (104943/Z/14/Z), and an EPSRC equipment grant (EP/M029778/1). CMWT is supported by a Sir Henry Wellcome Fellowship (215944/Z/19/Z) and NWO Veni Grant (17331) to CMWT. DS is supported by a Wellcome Trust GW4-CAT Fellowship (220537/Z/20/Z).
DS would like to thank Prof. Peter H. Morgan at Cardiff Business School for discussions about statistics.
References
- Markov NT, Ercsey-Ravasz MM, Ribeiro Gomes AR et al. A weighted and directed interareal connectivity matrix for macaque cerebral cortex. Cereb Cortex 2014;24(1):17-36.
- Schüz A, Braitenberg V. The human cortical white matter: quantitative aspects of cortico-cortical long-range connectivity. Cortical areas: Unity and diversity 2002:377-385.
- Phillips OR, Clark KA, Luders E et al. Superficial white matter: effects of age, sex, and hemisphere. Brain Connect 2013;3(2):146-159.
- d’Albis M-A, Guevara P, Guevara M et al. Local structural connectivity is associated with social cognition in autism spectrum disorder. Brain 2018;141(12):3472-3481.
- Phillips OR, Joshi SH, Narr KL et al. Superficial white matter damage in anti-NMDA receptor encephalitis. J Neurol Neurosurg Psychiatry 2018;89(5):518-525.
- O'Halloran R, Feldman R, Marcuse L et al. A method for u-fiber quantification from 7 T diffusion-weighted MRI data tested in patients with nonlesional focal epilepsy. Neuroreport 2017;28(8):457-461.
- Van Essen DC, Jbabdi S, Sotiropoulos SN et al. Mapping Connections in Humans and Non-Human Primates. Diffusion MRI; 2014. p 337-358.
- Rademacher J. Topographical variability of cytoarchitectonic areas. Cortical Areas: CRC Press; 2002. p 65-90.
- Koller K, Rudrapatna SU, Chamberland M et al. MICRA: Microstructural image compilation with repeated acquisitions. NeuroImage 2020:117406.
- Jones DK, Alexander DC, Bowtell R et al. Microstructural imaging of the human brain with a 'super-scanner': 10 key advantages of ultra-strong gradients for diffusion MRI. Neuroimage 2018;182:8-38.
- Tournier JD, Calamante F, Connelly A. Robust determination of the fibre orientation distribution in diffusion MRI: non-negativity constrained super-resolved spherical deconvolution. Neuroimage 2007;35(4):1459-1472.
- Dhollander T, Raffelt D, Connelly A. Unsupervised 3-tissue response function estimation from single-shell or multi-shell diffusion MR data without a co-registered T1 image. ISMRM Workshop on Breaking the Barriers of Diffusion MRI 2016.
- Jeurissen B, Tournier JD, Dhollander T et al. Multi-tissue constrained spherical deconvolution for improved analysis of multi-shell diffusion MRI data. Neuroimage 2014;103:411-426.
- Reuter M, Schmansky NJ, Rosas HD et al. Within-subject template estimation for unbiased longitudinal image analysis. Neuroimage 2012;61(4):1402-1418.
- Fischl B. FreeSurfer. Neuroimage 2012;62(2):774-781.
- Avants BB, Tustison N, Song G. Advanced normalization tools (ANTS). Insight j 2009;2(365):1-35.
- Tournier JD, Smith R, Raffelt D et al. MRtrix3: A fast, flexible and open software framework for medical image processing and visualisation. NeuroImage 2019;202:116137.
- Tournier JD, Calamante F, Connelly A. Improved probabilistic streamlines tractography by 2nd order integration over fibre orientation distributions. 2010. ISMRM.
- Smith RE, Tournier JD, Calamante F et al. Anatomically-constrained tractography: improved diffusion MRI streamlines tractography through effective use of anatomical information. Neuroimage 2012;62(3):1924-1938.
- Calamante F, Tournier J-D, Jackson GD et al. Track-density imaging (TDI): super-resolution white matter imaging using whole-brain track-density mapping. Neuroimage 2010;53(4):1233-1243.
- Daducci A, Dal Palu A, Lemkaddem A et al. COMMIT: Convex optimization modeling for microstructure informed tractography. IEEE Trans Med Imaging 2015;34(1):246-257.
- Smith RE, Tournier JD, Calamante F et al. SIFT2: Enabling dense quantitative assessment of brain white matter connectivity using streamlines tractography. Neuroimage 2015;119:338-351.
- St-Onge E, Daducci A, Girard G et al. Surface-enhanced tractography (SET). Neuroimage 2018;169:524-539.
Figures