4295
The test-retest reliability and robustness of diffusion-MRI based tractometry1Department of Psychology, University of Washington, Seattle, WA, United States, 2eScience Institute, University of Washington, Seattle, WA, United States, 3Graduate School of Education, Stanford University, Stanford, CA, United States, 4Division of Developmental-Behavioral Pediatrics, Stanford University School of Medicine, Stanford, CA, United States, 5Center for Mind, Brain and Behavior - CMBB, Hans-Meerwein-Straße 6, Marburg, Germany, 6Department of Psychiatry, University of Marburg, Marburg, Germany, 7Basque Center on Cognition (BCBL), Brain and Language, Donostia‐San Sebastián, Spain, 8Department of Biomedical Engineering, McGill University, Montreal, QC, Canada, 9Center for Interdisciplinary Brain Sciences Research, Department of Psychiatry and Behavioral Sciences, Stanford University School of Medicine, Stanford, CA, United States
Synopsis
Tractometry from diffusion MRI estimates the tissue properties along the length of major white matter tracts, using: computational tractography; tract segmentation using atlases or other classification methods; and microstructural modeling in voxels along the length of the estimated tracts. Given previous concerns about the sensitivity of dMRI-based analysis to variations in methodology, we tested: the reliability of tractometry results within individuals across measurements; and within measurement, across variations in the analysis methods. We found that although there are variations that arise from differences in tractography methods, bundle segmentation methods, microstructural modeling, and different software implementations, tractometry is overall quite robust.
Introduction
Diffusion MRI (dMRI) measures human brain connectionsin vivo. There are concerns about the validity of inferences made from dMRI, given the dependence of some results on the specifics of the analysis [1–3]. We asked whether inferences from tractometry – estimates of the tissue properties of major known bundles – are similarly affected by variations across analysis approaches.Tractometry relies on a series of processing steps to estimate the tissue properties of the major white matter tracts. Various tractography methods can be used to produce streamlines that approximate the trajectories of white matter fascicles (Fig.1A). Major tracts are identified within an individual using different models and atlases [4–11], assigning streamlines to different bundles (Fig.1C). The microstructure of tissue within the white matter along a bundle can be assessed using a variety of models, ranging from phenomenological to mechanistic [12]. Tractography, bundle segmentation and diffusion modeling provide estimates of “tract-profiles” (Fig.1D). Tract-profiles are useful for statistical analysis that compares different groups, or assesses individual variability in brain connection structure [8,13–15]. Here, we ask how replicable tract profiles are across different measurements of the same individual and how robust they are to the variations in methods.
Methods
We used two datasets with test-retest measurements: (1) Human Connectome Project test-retest measurements of dMRI (HCP-TRT) for 44 neurologically healthy subjects aged 22-35 [16]; (2) dMRI from 48 children, 5 years old in age, collected at the University of Washington (UW-PREK). Two measurements were conducted in each participant 1 day apart. These were acquired with 32 directions, b=1,500s/mm2, 2mm3 isotropic resolution, TR/TE=7200/83msec. Data were preprocessed using FSL for eddy current, motion correction, and susceptibility distortion correction. Analysis using the MATLAB AFQ (mAFQ) was conducted as previously described [8].We developed an open-source tractometry software library: Python Automated Fiber Quantification (pyAFQ;https://github.com/yeatmanlab/pyAFQ), which relies on methods implemented in Diffusion Imaging in Python (DIPY) [17] and waypoint ROIs to find major tracts [4,8]. The pyAFQ software is configurable, allowing users to specify methods and parameters for different stages of the analysis, It expects inputs in the BIDS format [18]. We ran pyAFQ on HCP-TRT using DKI [19] or CSD [20] as ODF models. We also used Recobundles [7] as the track segmentation algorithm. We ran pyAFQ on UW-PREK using the same parameters as the mAFQ analysis.
Tract segmentation of each bundle was compared across measurements and methods using the Dice coefficient, weighted by streamline count [21]. Tract profiles were compared using two measures: (1) Profile reliability: mean Pearson’s correlation between each point in the tract profile for different measurements/analyses; (2) Subject reliability: Pearson’s correlation between the mean of the tract profiles across individuals, which quantifies reliable differences between individuals per bundle for mean tract profiles. To estimate test-retest reliability (TRR), these would be calculated for each individual across different measurements. To estimate robustness, these would be calculated for each individual across different analysis methods.
Results
In both datasets, we found high TRR in the results of tracking: wDSC was larger than 0.7 for all but one bundle (Fig.2A). We found overall high profile TRR that did not always translate to high subject TRR. Overall, we find that mAFQ has slightly higher subject TRR relative to pyAFQ, particularly when TRR is low for pyAFQ (Fig.2B).The UW-PREK dataset was analyzed with both pyAFQ and mAFQ. Overall, robustness to differences in the details of the implementations was high, with high wDSC between all bundles, except the callosal bundles (Fig.3A). Accordingly there is high tract profile robustness and high between-subject robustness (Fig.3B-C).
In HCP-TRT, we compared two ODF algorithms: tractography using DKI- and CSD-derived ODFs, which give very different results. Despite these discrepancies, wDSC and profile robustness are high for most bundles (Fig 4A-B). The two bundles with the most extreme differences, the SLF and ARC, are shown in Fig 4D. These bundles have low wDSC and profile robustness, yet their subject robustness remains high (Fig.4C).
In HCP-TRT, we compared segmentation using waypoint ROIs to Recobundles [22]. For most bundles there is moderate agreement between these algorithms. Our Recobundles implementation often did not find right arcuate, and asymmetry in the ILF atlas for Recobundles results in discrepancies. Nevertheless, profile robustness and especially subject robustness between these two algorithms are high, >0.7 in most cases (Fig.5).
Discussion
We replicated previous findings that the definition of major bundles can vary in terms of their spatial extent (quantified via wDSC) [1,3,21,23]. Nevertheless, even when bundles appear very different, the robustness of tract profiles or between-subject variance can be very high. This suggests that tractometry can overcome the failures of precise definitions of the major bundles, by averaging tissue properties within the core of the white matter. There are still systematic points of failure of pyAFQ in segmentations of the callosal bundles (Fig.2), despite our efforts to match the tractometry parameters used by mAFQ. The two AFQ implementations use different implementations of tractography and registration. Even with these failures, robustness was high for most bundles. Overall, high profile reliability did not always imply high subject reliability. This suggests there are other sources of between-subject variance that do not correspond directly to profile reliability within an individual.Acknowledgements
This work is supported through grant 1RF1MH121868-01 from the National Institutes for Mental Health/The BRAIN Initiative and through grant 5R01EB027585-02 to Eleftherios Garyfallidis (Indiana University). We are also grateful for support from the Gordon and Betty Moore Foundation and the Alfred P. Sloan Foundation to the University of Washington eScience Institute Data Science Environment, as well as support from the Washington Research Foundation to eScience and to the University of Washington Institute for Neuroengineering.References
1. Maier-Hein KH, Neher PF, Houde JC, Cˆot ́e MA, Garyfallidis E, Zhong J, et al. The challenge of mapping the human connectome based on diffusion tractography. Nature Communications. 2017;8(1):1349.doi:10.1038/s41467-017-01285-x.
2. Thomas C, Ye FQ, Irfanoglu MO, Modi P, Saleem KS, Leopold DA, et al. Anatomical accuracy of brain connections derived from diffusion MRI tractography is inherently limited. Proc Natl Acad Sci U S A. 2014;111(46):16574–16579.
3. Schilling KG, Rheault F, Petit L, Hansen CB, Nath V, Yeh FC, et al. Tractography dissection variability: what happens when 42 groups dissect 14 white matter bundles on the same dataset?; 2020.
4. Wakana S, Jiang H, Nagae-Poetscher LM, van Zijl PCM, Mori S. Fiber tract-based atlas of human white matter anatomy. Radiology. 2004;230(1):77–87.
5. Oishi K, Zilles K, Amunts K, Faria A, Jiang H, Li X, et al. Human brain white matter atlas: identification and assignment of common anatomical structures in superficial white matter. Neuroimage. 2008;43(3):447–457.
6. Yeh FC, Panesar S, Fernandes D, Meola A, Yoshino M, Fernandez-Miranda JC, et al. Population-averaged atlas of the macroscale human structural connectome and its network topology. NeuroImage. 2018;178:57–68. doi:10.1016/j.neuroimage.2018.05.027.
7. Garyfallidis E, Cˆot ́e MA, Rheault F, Sidhu J, Hau J, Petit L, et al. Recognition of white matter bundles using local and global streamline-based registration and clustering. Neuroimage. 2017;.
8. Yeatman JD, Dougherty RF, Myall NJ, Wandell BA, Feldman HM. Tract Profiles of White Matter Properties: Automating Fiber-Tract Quantification. PLOS ONE. 2012;7(11):e49790. doi:10.1371/journal.pone.0049790.
9. Catani M, Thiebaut de Schotten M. A diffusion tensor imaging tractography atlas for virtual in vivo dissections. Cortex. 2008;44(8):1105–1132.
10. Yendiki A, Panneck P, Srinivasan P, Stevens A, Z ̈ollei L, Augustinack J, et al. Automated probabilistic reconstruction of white-matter pathways in health and disease using an atlas of the underlying anatomy. Front Neuroinform. 2011;5:23.
11. Wassermann D, Makris N, Rathi Y, Shenton M, Kikinis R, Kubicki M, et al. The white matter query language: a novel approach for describing human white matter anatomy. Brain Struct Funct. 2016;221(9):4705–4721.
12. Novikov DS, Kiselev VG, Jespersen SN. On modeling. Magn Reson Med. 2018;79(6):3172–3193.
13. Colby JB, Soderberg L, Lebel C, Dinov ID, Thompson PM, Sowell ER. Along-tract statistics allow for enhanced tractography analysis. Neuroimage. 2012;59(4):3227–3242.
14. Richie-Halford A, Yeatman J, Simon N, Rokem A. Multidimensional analysis and detection of informative features in diffusion MRI measurements of human white matter; 2019.
15. Dayan M, Monohan E, Pandya S, Kuceyeski A, Nguyen TD, Raj A, et al. Profilometry: A new statistical framework for the characterization of white matter pathways, with application to multiple sclerosis. HumBrain Mapp. 2015;.
16. Sotiropoulos SN, Jbabdi S, Xu J, Andersson JL, Moeller S, Auerbach EJ, et al. Advances in diffusion MRI acquisition and processing in the Human Connectome Project. Neuroimage. 2013;80:125–143.
17. Garyfallidis E, Brett M, Amirbekian B, Rokem A, Van Der Walt S, Descoteaux M, et al. Dipy, a library for the analysis of diffusion MRI data. Frontiers in Neuroinformatics. 2014;8. doi:10.3389/fninf.2014.00008.
18. Gorgolewski KJ, Auer T, Calhoun VD, Craddock RC, Das S, Duff EP, et al. The brain imaging data structure, a format for organizing and describing outputs of neuroimaging experiments. Scientific Data. 2016;3(1):160044. doi:10.1038/sdata.2016.44.
19. Jensen JH, Helpern JA, Ramani A, Lu H, Kaczynski K. Diffusional kurtosis imaging: the quantification of non-gaussian water diffusion by means of magnetic resonance imaging. Magn Reson Med. 2005;53(6):1432–1440.
20. Tournier JD, Calamante F, Connelly A. Robust determination of the fibre orientation distribution in diffusion MRI: non-negativity constrained super-resolved spherical deconvolution. NeuroImage. 2007;35(4):1459–1472. doi:10.1016/j.neuroimage.2007.02.016.
21. Cousineau M, Jodoin PM, Garyfallidis E, Cˆot ́e MA, Morency FC, Rozanski V, et al. A test-retest study on Parkinson’s PPMI dataset yields statistically significant white matter fascicles. NeuroImage : Clinical. 2017;16:222. doi:10.1016/j.nicl.2017.07.020.
22. Garyfallidis E, Cˆot ́e MA, Rheault F, Sidhu J, Hau J, Petit L, et al. Recognition of white matter bundles using local and global streamline-based registration and clustering.NeuroImage. 2018;170:283–295. doi:10.1016/j.neuroimage.2017.07.015
23. Boukadi M, Marcotte K, Bedetti C, Houde JC, Desautels A, Deslauriers-Gauthier S, et al. Test-Retest Reliability of Diffusion Measures Extracted Along White Matter Language Fiber Bundles Using HARDI-Based Tractography. Frontiers in Neuroscience. 2019;12. doi:10.3389/fnins.2018.01055.
24. Fonov V, Evans AC, Botteron K, Almli CR, McKinstry RC, Collins DL, et al. Unbiased average age-appropriate atlases for pediatric studies. NeuroImage. 2011;54(1):313–327. doi:10.1016/j.neuroimage.2010.07.033.
25. Fonov V, Evans A, McKinstry R, Almli C, Collins D. Unbiased non-linear average age-appropriate brain templates from birth to adulthood. NeuroImage. 2009;47:S102. doi:10.1016/S1053-8119(09)70884-5.
26. Dell’Acqua F, Lacerda L, Catani M, Simmons A. Anisotropic Power Maps: A diffusion contrast to reveal low anisotropy tissues from HARDI data.; p. 1.
Figures
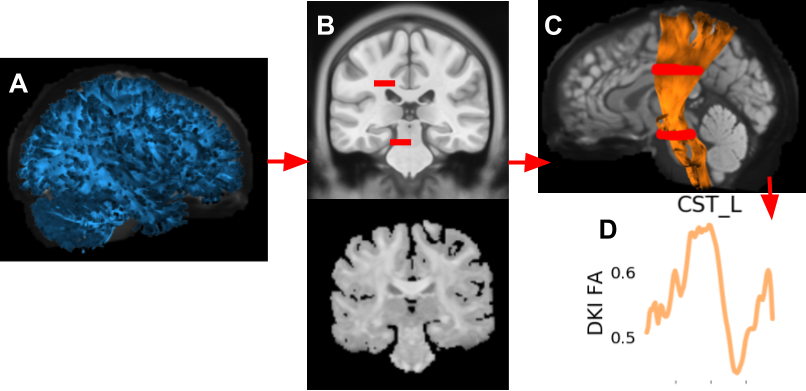
Fig 1. Examples from different stages of tractometry
A: an example tractography is in blue. B: the top is from an MNI template [24, 25] with the waypoint ROIs for the left corticospinal tract [4] in red (enlarged for clarity). This is registered to the subject’s anisotropic power map [26] on the bottom. C: the background is the subject’s b0; the left corticospinal tract is in orange, shaded by the subject’s fractional anisotropy (FA); the ROIs are in red. D: the extracted tract profile is in orange.
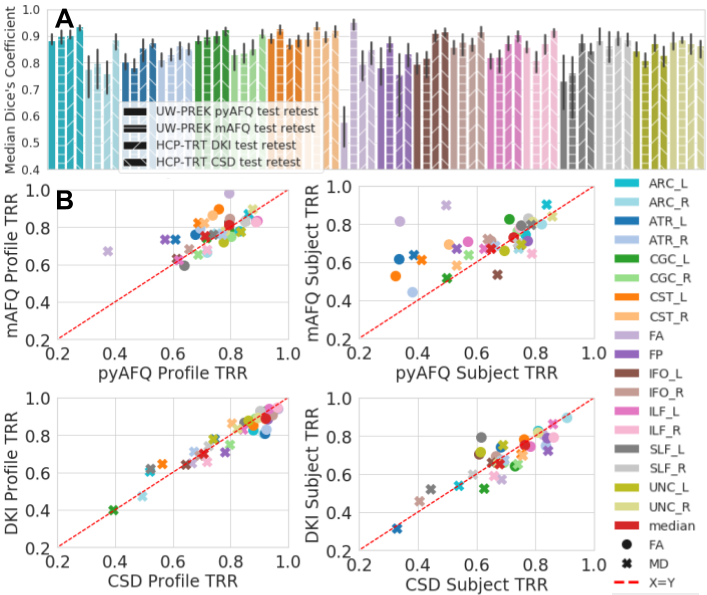
Fig 2. wDSC, profile, and subject TRR of pyAFQ and mAFQ on UW-PREK and pyAFQ on HCP-TRT using different ODF models.
Colors indicate bundle. In A: texture indicates the dataset and methods being compared. Error bars show the 95% confidence interval. In B: the right is subject TRR and the left is profile TRR. On top, we compare the TRR of mAFQ and pyAFQ on UW-PREK. On the bottom, we compare DKI and CSD TRR on HCP-TRT. Point shapes indicate the extracted scalar. The red dotted line is equal TRR between methods.
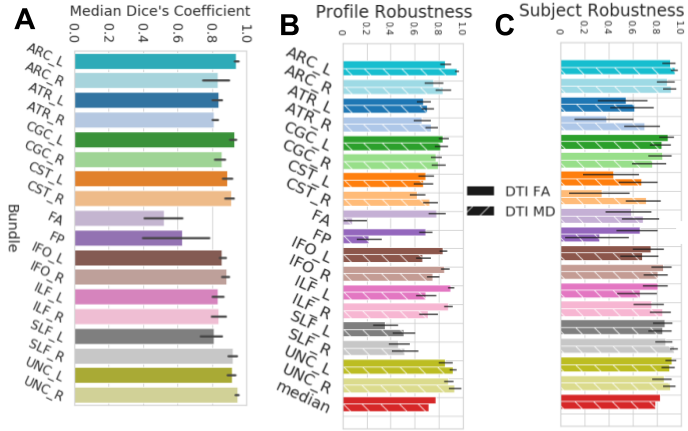
Fig 3. wDSC, subject and profile robustness between the pyAFQ and mAFQ results on the pre-K pre-session data.
Bars are colored according to their bundle and textured according to their scalar. A shows wDSC robustness between pyAFQ and mAFQ on UW-PREK. B shows profile robustness and C shows subject robustness for the same comparison. Error bars show the 95% confidence interval.

Fig 4. wDSC, subject, profile robustness between the DKI and CSD ODF models on HCP-TRT.
Colors encode bundle information. Error bars represent the 95% confidence interval. A shows wDSC robustness between DKI and CSD on HCP-TRT. B shows profile robustness and C shows subject robustness between the CSD and DKI models. In these panels, textures encode the scalar information. D shows the ATR_L and SLF_L found using DKI on the left and CSD on the right for an example subject.
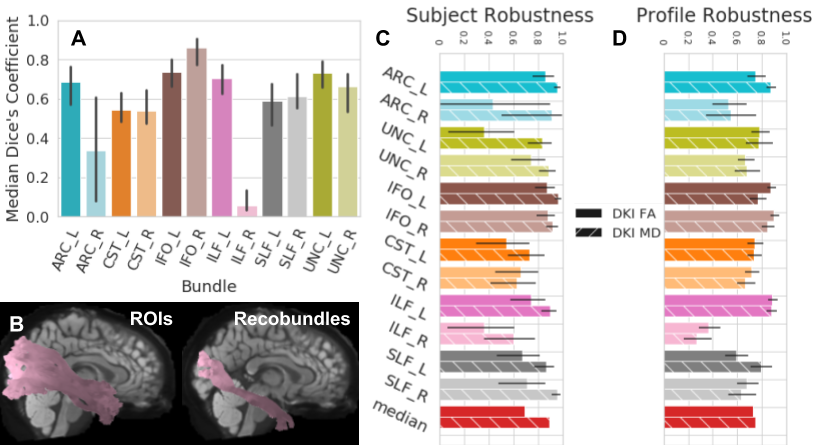
Fig 5. Robustness between waypoint ROIs and Recobundles on a common subset of bundles using HCP-TRT.
Colors encode bundle information and textures encode the extracted scalar. Error bars represent the 95% confidence interval. A shows wDSC between the waypoint ROI and Recobundles approach. B shows the ILF_R found by each algorithm for an example subject with wDSC 0.11. C shows profile robustness and D shows subject robustness.