4294
White Matter Inter-tract Connectivity Using Cosine Similarity between Population Kernel Densities of Diffusion Measures1UCLA, Los Angeles, CA, United States
Synopsis
Pairwise inter-tract correlations of the mean diffusion measures have been used to infer structural connectivity among major white matter (WM) fiber tract pathways. Instead of using the mean, we propose a novel approach of constructing kernel density distributions to represent population variability of fractional anisotropy. We also propose the cosine similarity metric between the full shapes of the kernel densities to investigate inter-tract connectivity among the fiber tracts. Our representation and the shape similarity measure is a better predictor of the short- and long-range connectivity disruptions in WM tracts in major depressive disorder patients compared to the conventional mean-based approach.
Introduction
Brain connectivity research using structural measures provides important insights into the pathophysiology of various disorders including major depressive disorder (MDD). Similar to the idea of population-based brain connectivity using correlations between structural measures such as thickness, volumes, and areas [1], Wahl et al. [2] have proposed the notion of inter-tract correlations. In their work, an inter-tract correlation matrix, computed using the Pearson correlation coefficient between the average diffusion measures such as fractional anisotropy (FA) over white matter (WM) fiber bundles, has been implicated in predictive modeling of healthy, compromised, developing, or aging cognitive function [2,3,4]. However, these microstructural correlation patterns failed to capture the underlying microstructural interactions and reach statistical significance at moderate sample sizes [2].In this work, we propose a novel approach for computing the inter-tract white matter connectivity using the cosine similarity metric between population kernel densities of diffusion measures. We hypothesize that the population kernel densities encode richer information by using the full shape of the diffusion measures across the population and the resulting shape similarity matrix may potentially reveal structural long- and short-range interactions between brain regions based on their white matter microstructure.
Methods
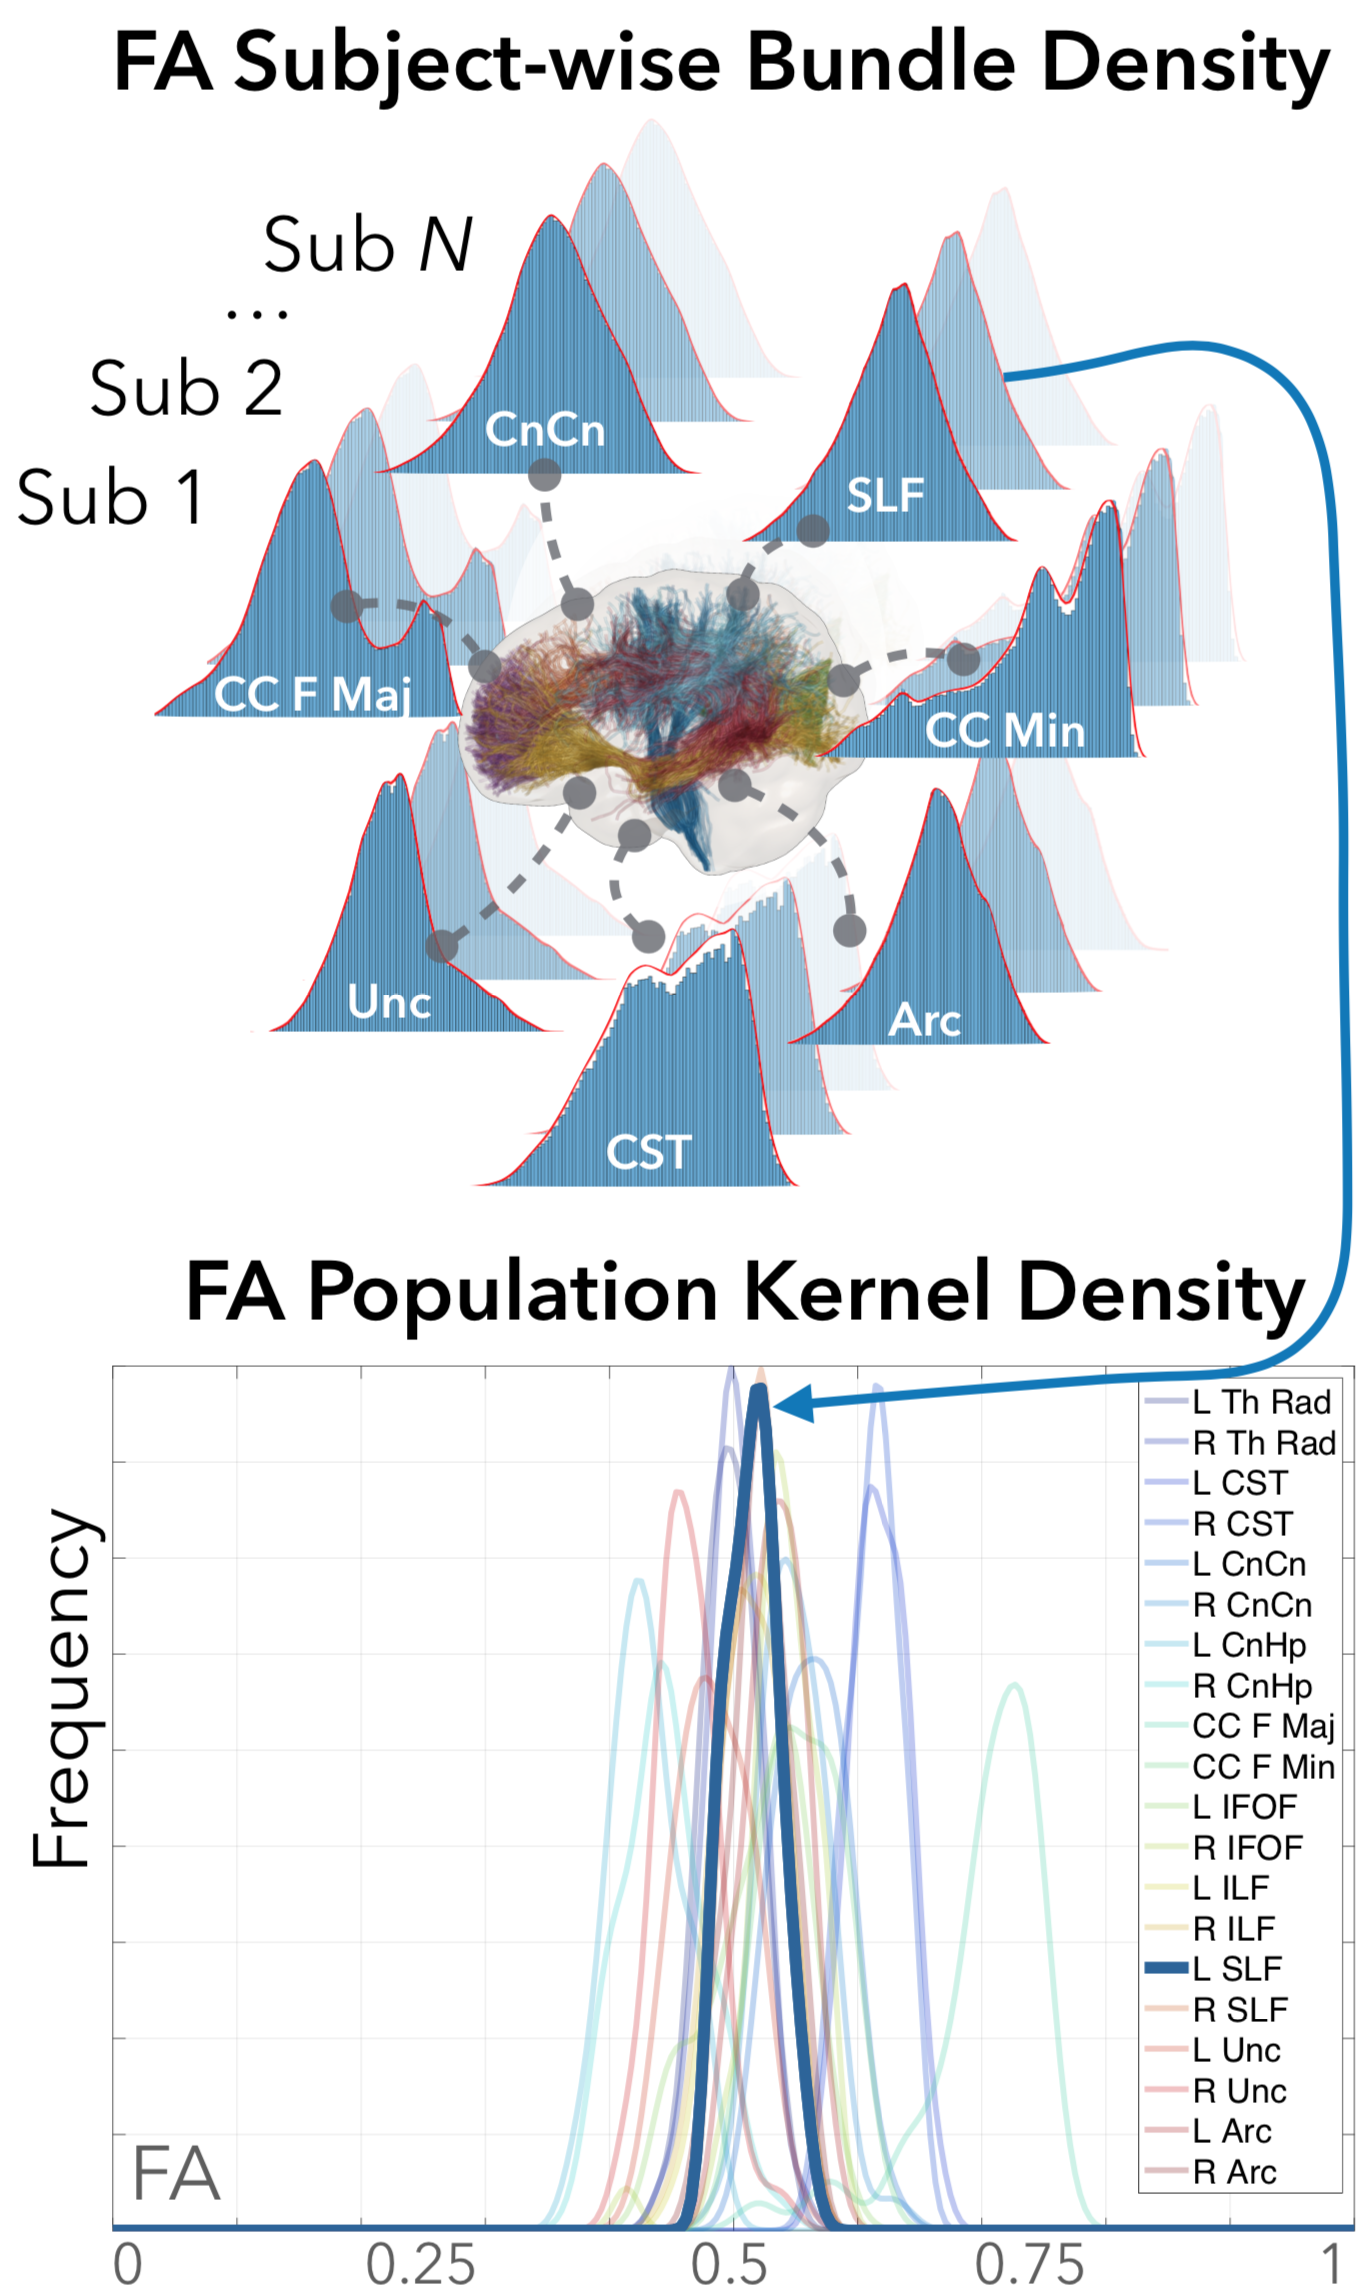
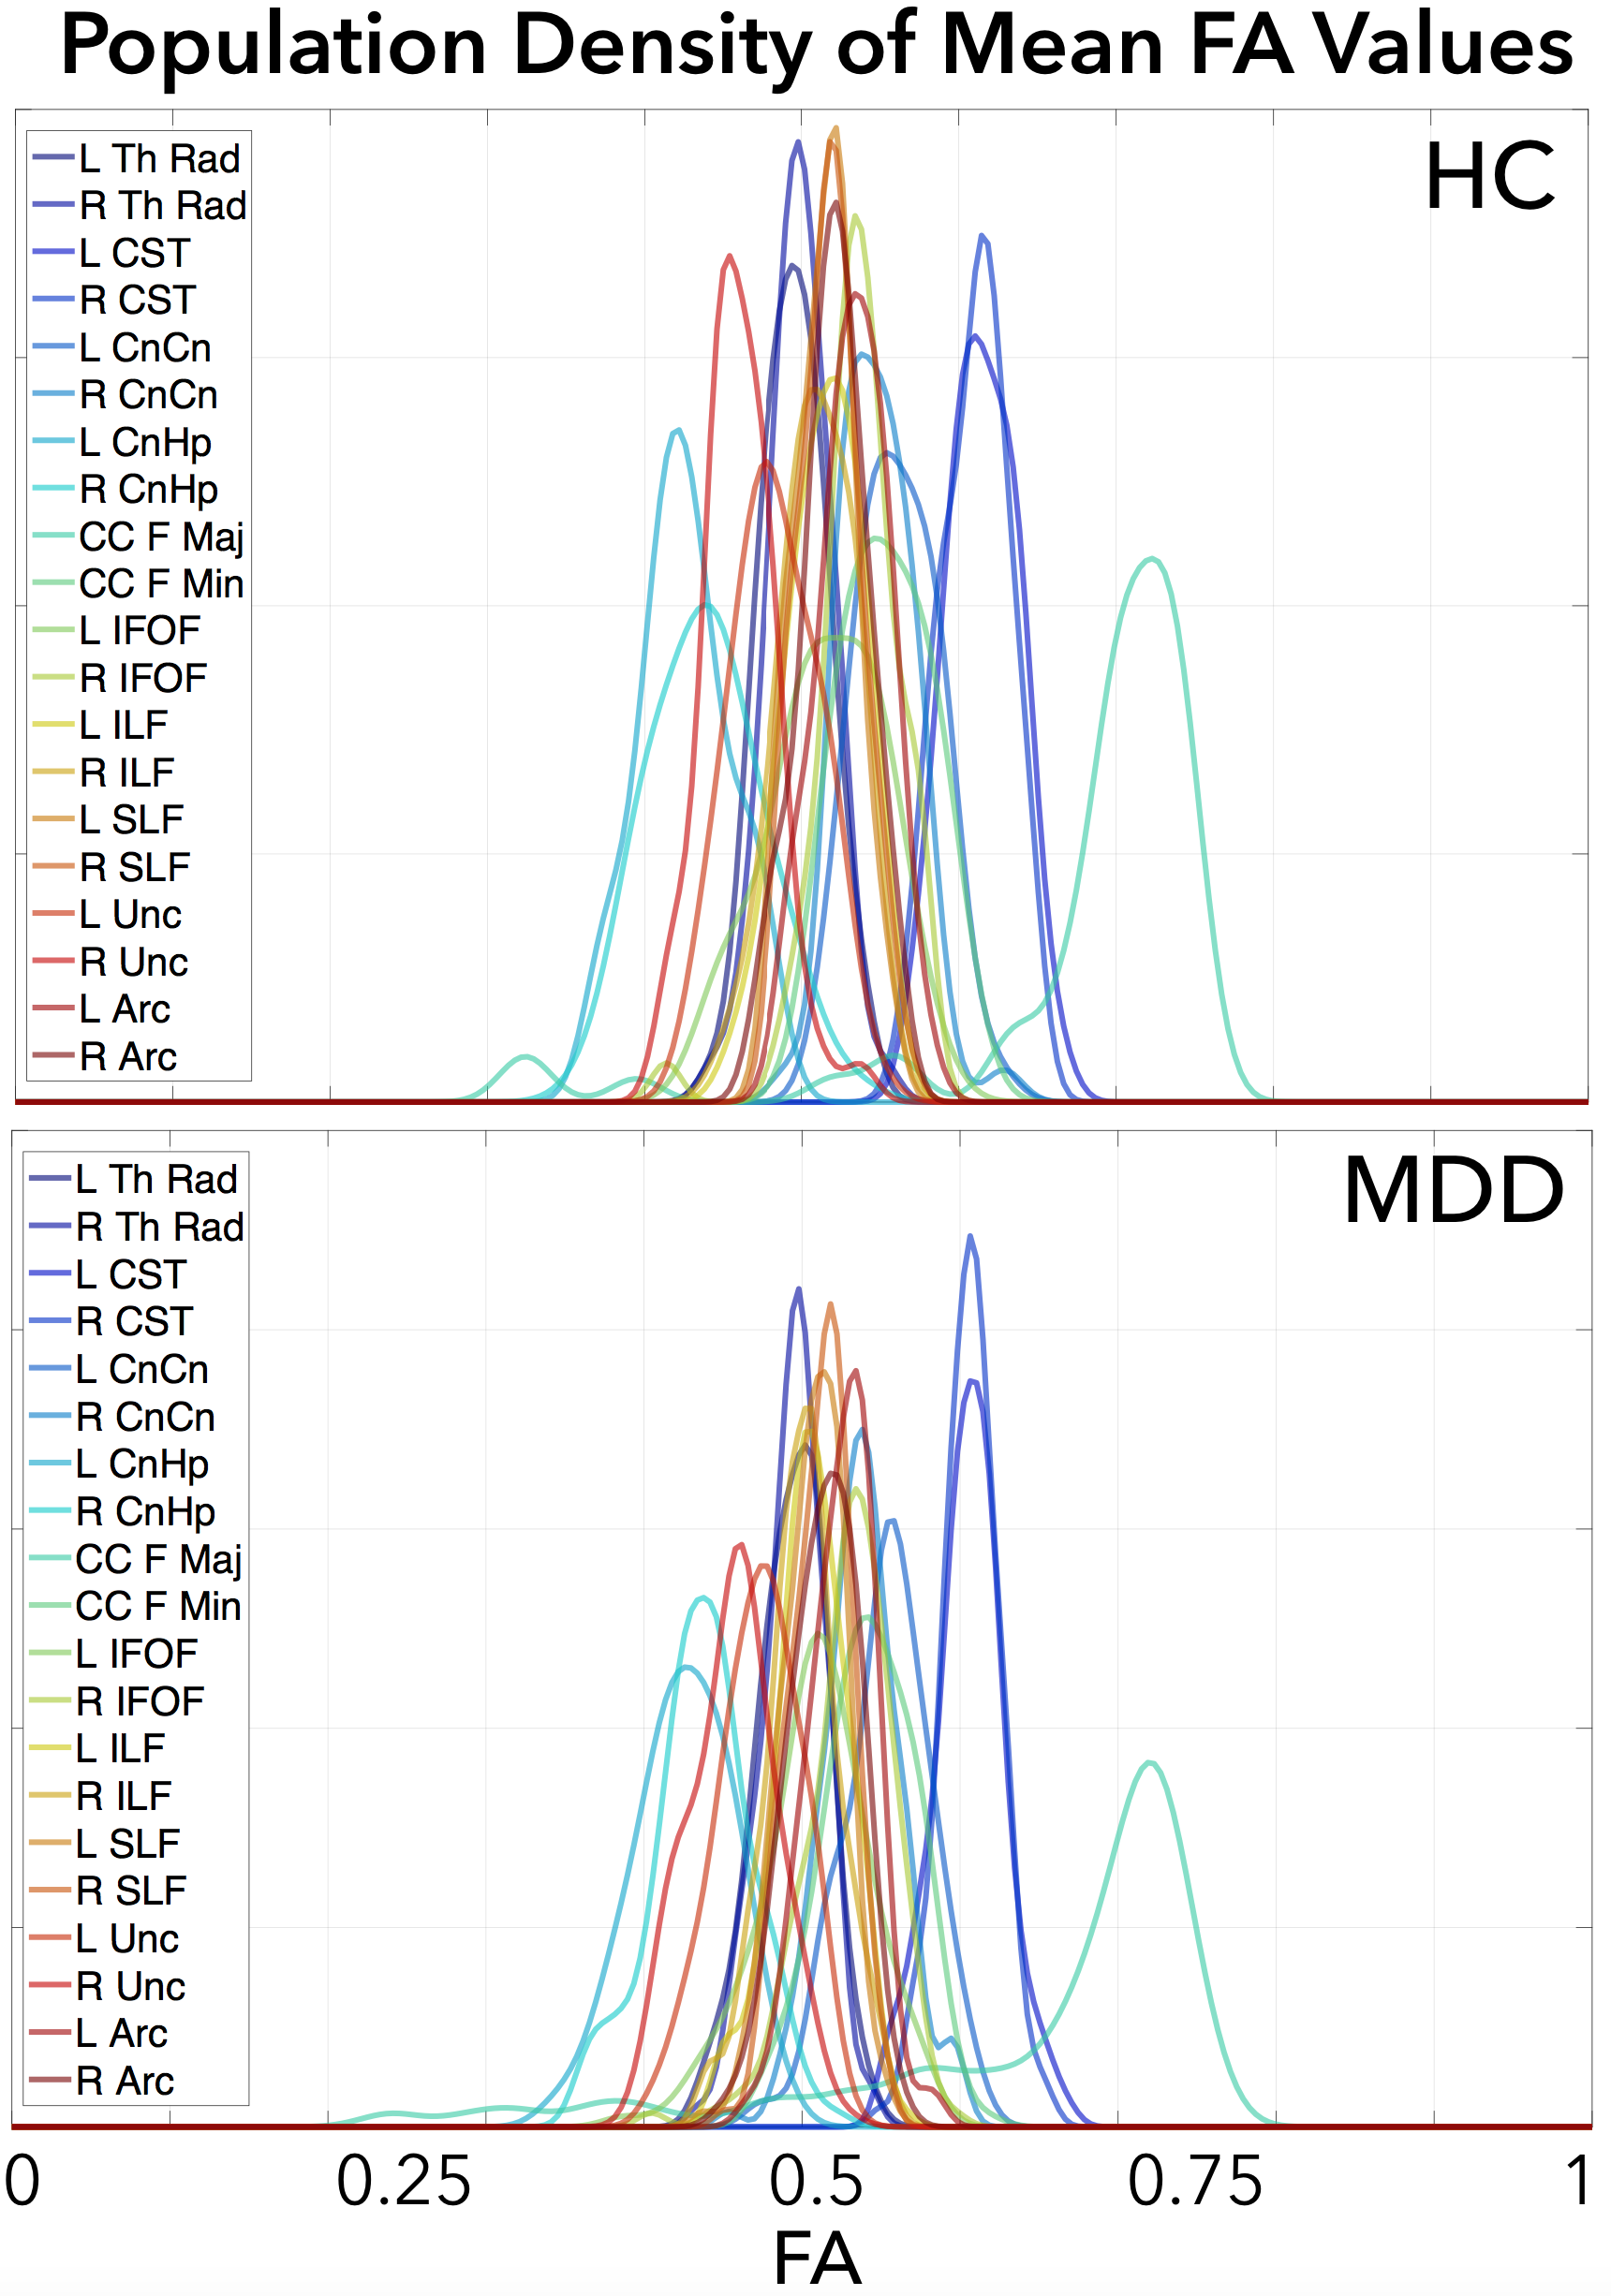
We represent the bundle kernel distribution of FA values for each tract of each subject as a continuous function $$$f: [0, 1] \to {\mathscr R}$$$, where the domain $$$[0,1]$$$ denotes the range of FA values. For each fiber tract, FA values were observed along each point of the fiber and aggregated across the bundle. A kernel density estimation was constructed for each bundle for each subject using a Gaussian kernel along with a plug-in estimate for bandwidth selection [5]. For a set of $$$K$$$ tracts, the set of functions $$$\{f_i, i= 1, 2, \ldots, K \}$$$ represents the set of bundle diffusion densities for a single subject. For a given bundle, we construct the kernel population density across subjects by first computing the mean of the subject kernel densities. For the $$$k^{th}$$$ bundle and $$$n^{th}$$$ subject, we have $$\mu_k^n = \int_0^1 s f_i(s) ds.$$ We then aggregate it across subjects, and compute a new population level kernel density estimate using $$g_k(s) = \frac{1}{N} \sum_{i=1}^N \phi_{\Delta}(s - \mu_k^n) = \frac{1}{N \Delta} \sum_{i=1}^N \phi(\frac{s - \mu_k^n}{\Delta}),$$ where $$$\phi$$$ is a kernel and $$$\Delta$$$ is the bandwidth selection parameter. We then compute a pairwise cosine distance between tracts $$$i$$$ and $$$j$$$ as $$\rho = \frac{\langle g_i, g_j \rangle}{\lVert g_i \rVert \lVert g_j \rVert}$$ as a measure of inter-tract similarity. In practice, we compute $$$\rho$$$ for the demeaned functions $$$g_i$$$ and $$$g_j$$$, which also represents the correlation between the two functions.We demonstrate our method on a population of 53 HC (22M/31F, 32±12 y.o.) and 129 MDD patients (63M/66F, 37±12 y.o.). Diffusion-weighted images were acquired on a Siemens PRISMA with spin-echo echo-planar sequence (EPI) with 14 reference (b=0) and multishell images (b=1500,3000) with 92 gradient directions (repetition time (TR)/echo time(TE)=3230ms/89.2ms, voxel size=1.5mm3). The Human Connectome Project Minimal Preprocessing Pipeline was used to correct the diffusion-weighted images for EPI susceptibility and eddy current distortions using FSL’s topup tool, and eddy tool, respectively [6,7]. Whole-brain tractography was performed with MRtrix3, using multi-tissue multi-shell anatomically-constrained spherical deconvolution [8]. The whole brain fiber tracts were segmented into 20 fiber groups; Left (L) and Right (R) Thalamic Radiation (Th Rad), Corticospinal Tract (CST), Cingulate Cingulum (CnCn),Cingulate Hippocampus (CnHp), Inferior Fronto-Occipital Fasciculus (IFOF), Superior/Inferior Longitudinal Fasciculus (SLF/ILF), Uncinate (Unc), and Arcuate (Arc), and Corpus Callosum Forceps Major/Minor (CC F Maj/Min), andthe FA values along the fibers of each fiber group were sampled using AutomatedFiber Quantification (AFQ) [9]. We computed 20 population kernel densities for the HC and the MDD population separately (Figure 2) and evaluated the between-group differences between partial pairwise inter-tract correlations when controlling for 1) age and sex, and 2) age, sex, and 18 other tracts using the William’s test [10]. The resulting p-values were corrected for multiple comparisons using the false discovery rate (FDR)<0.05 [11].
Results
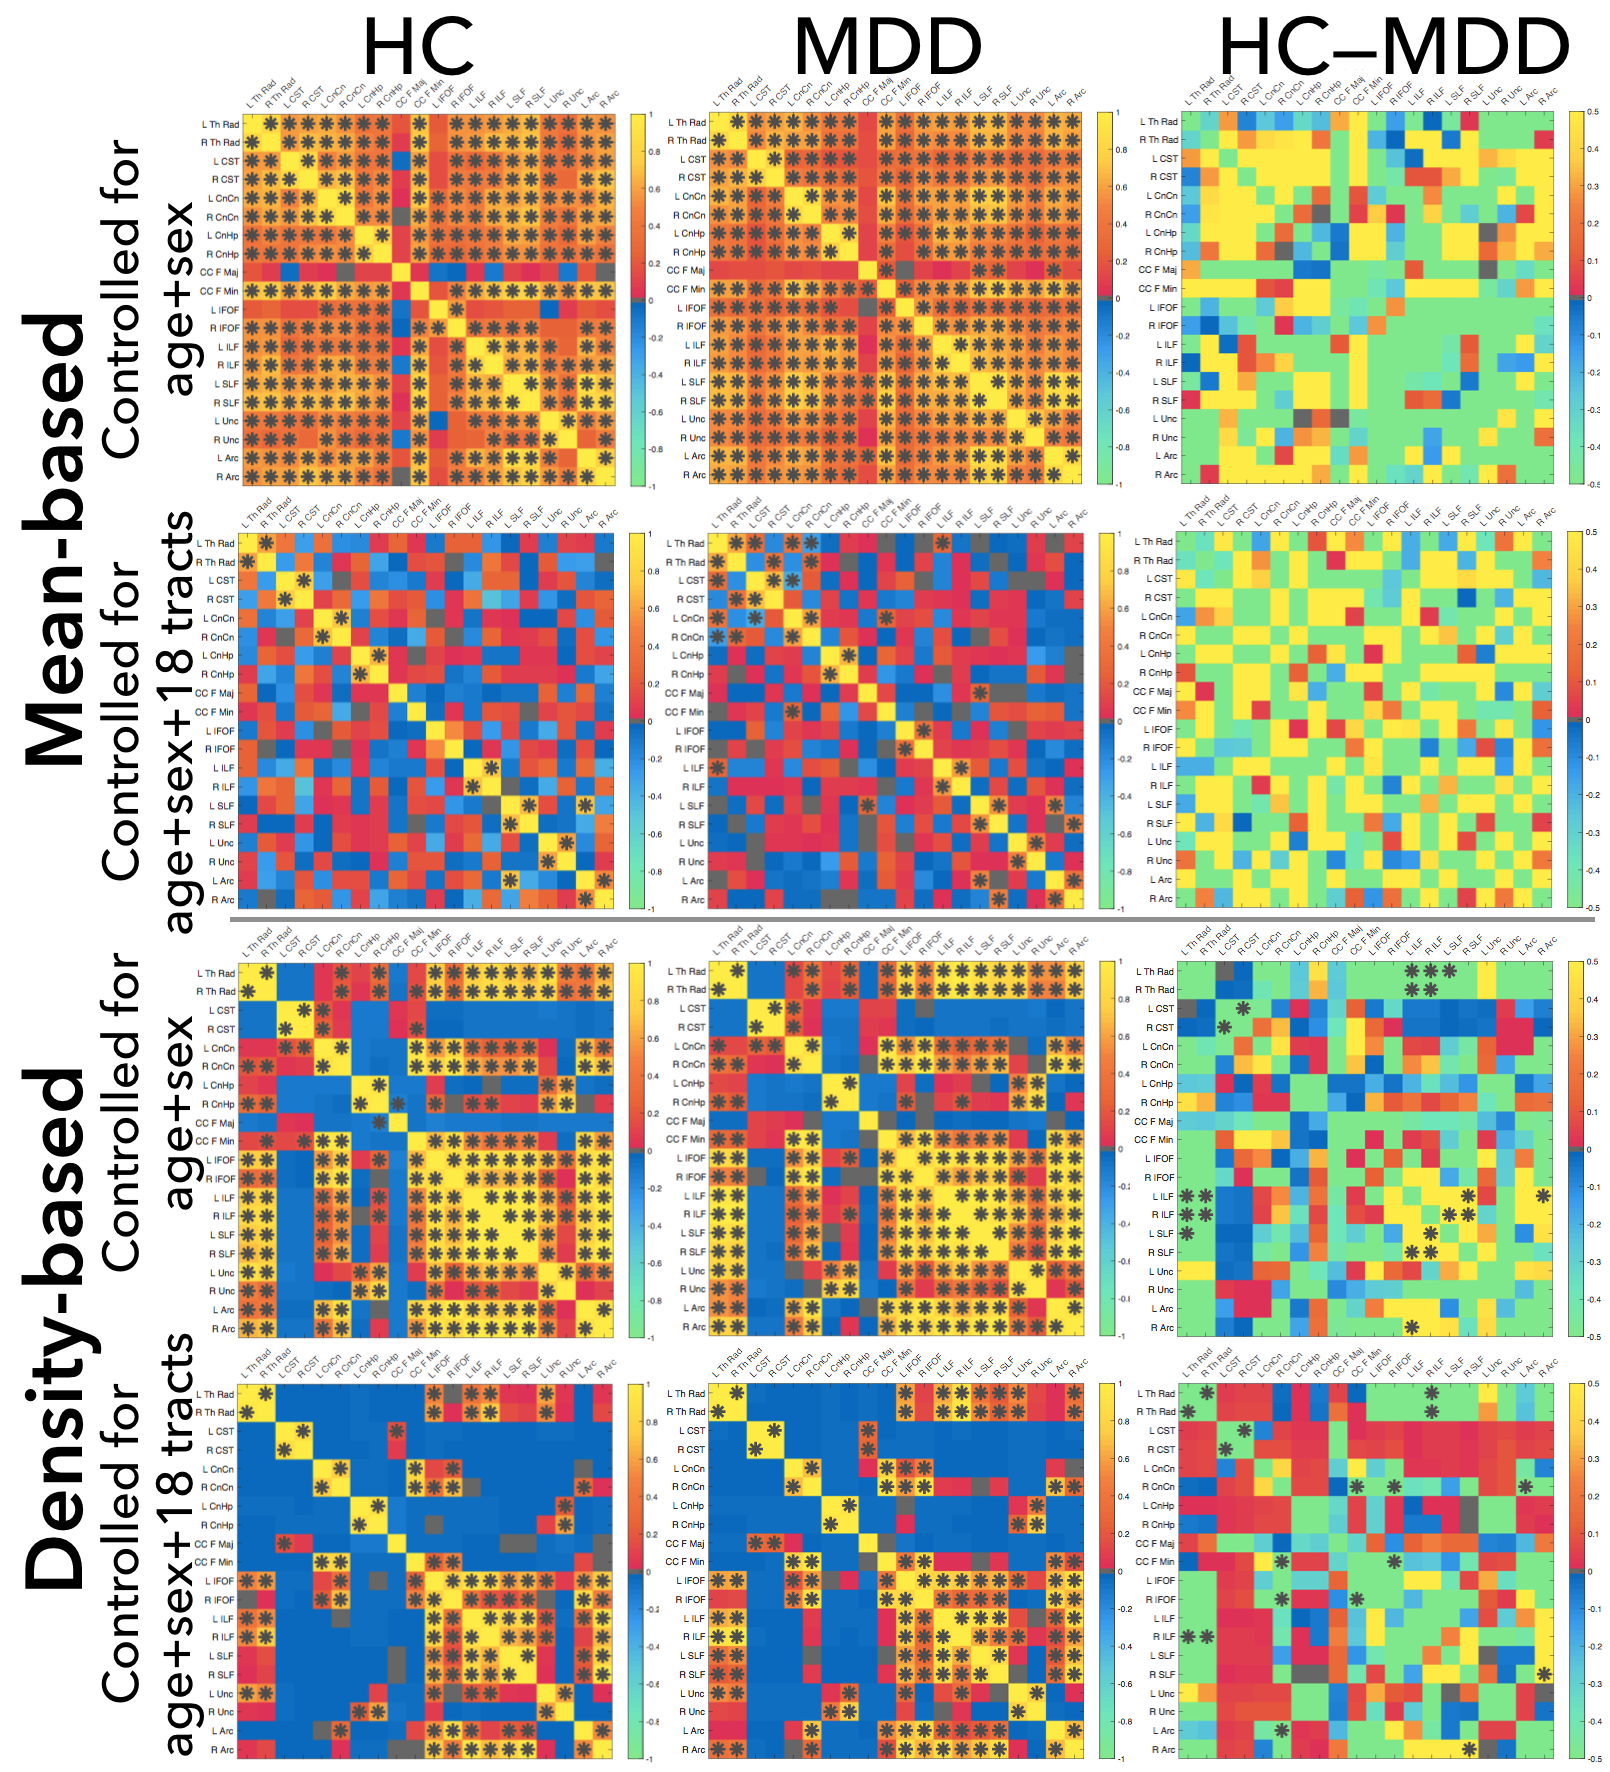
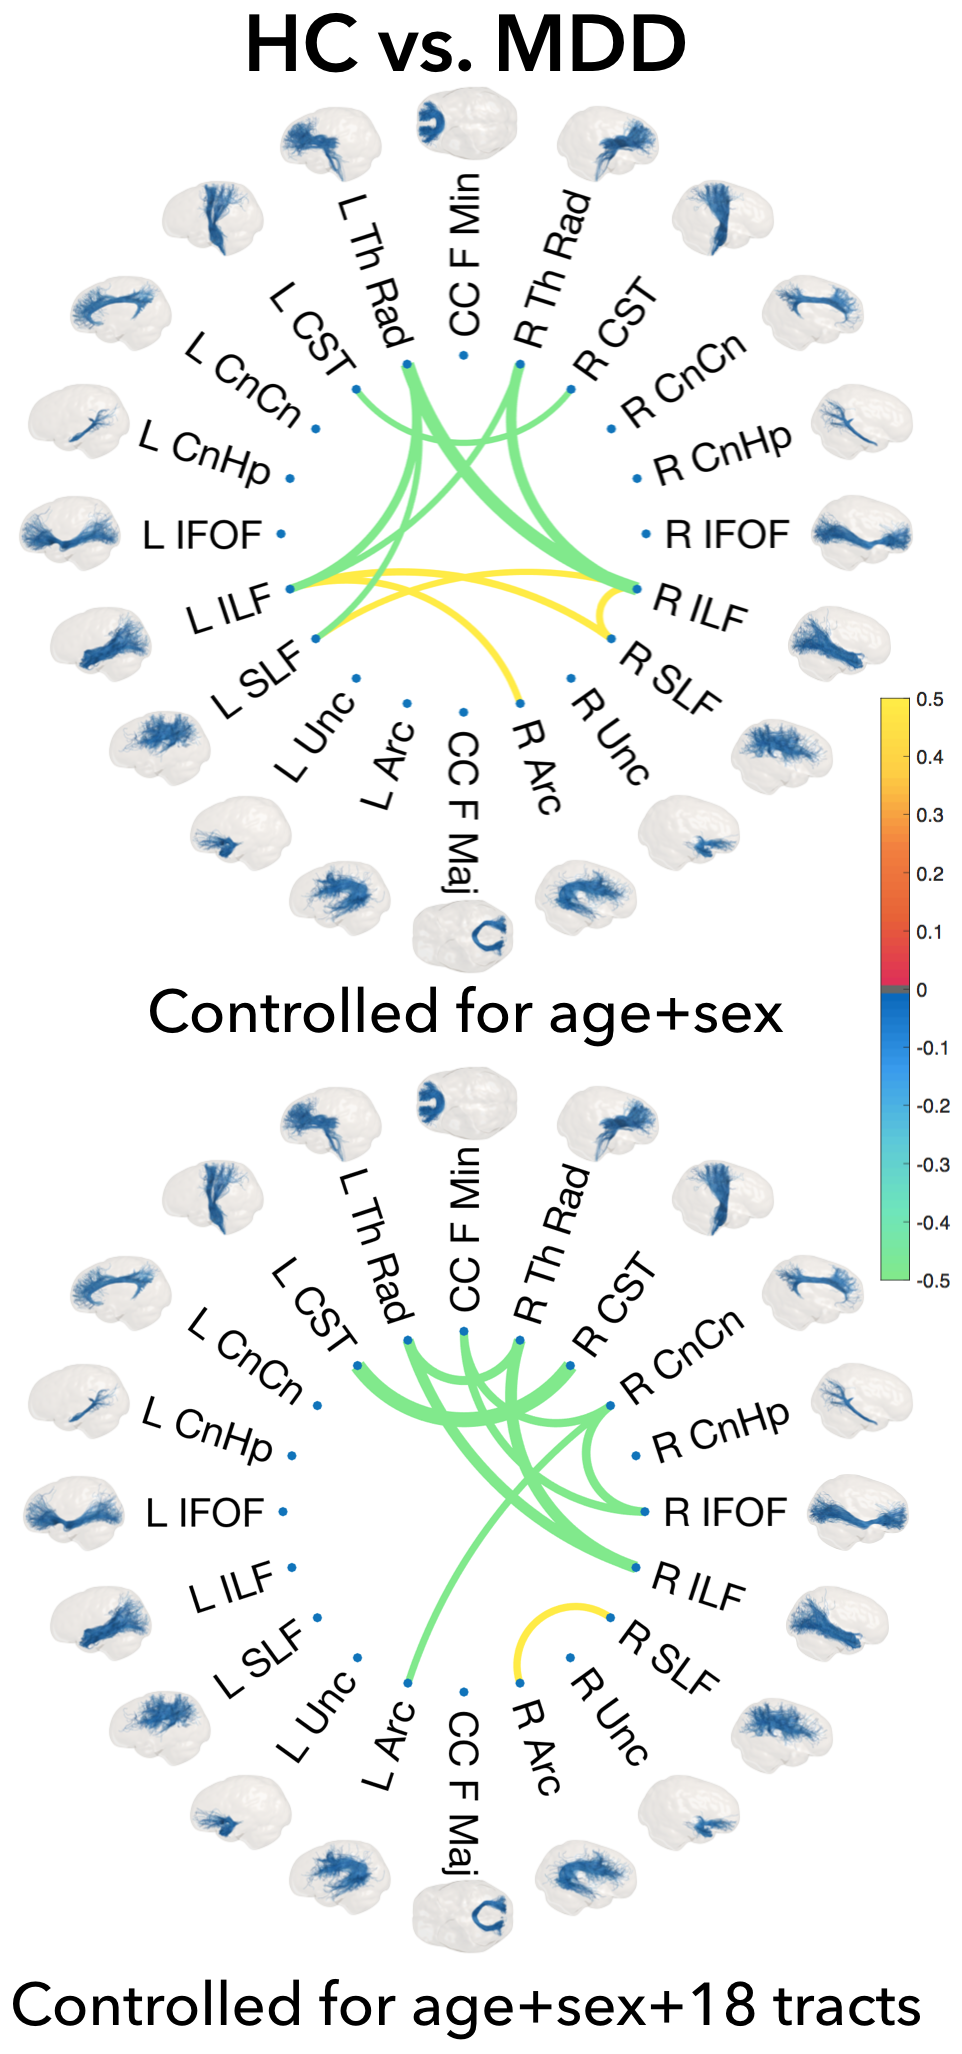
The standard mean-based partial inter-tract correlations did not show significant differences between HC and MDD, whereas the population kernel density approach showed both short- and long-range WM interactions for salient tracts. When controlling for age and sex, the interconnections for the group differences were bilateral and symmetric involving the SLF, ILF, and the Th Rad (Figure 3). When controlled for age, sex, and 18 other tracts, the group differences became more lateralized. In healthy controls alone, the mean-based approach showed fully connected tract interconnections, whereas the population density method identified distinct blocks of highly-correlated tracts involving bilateral Th Rad, SLF, IFOF ILF, CnCn, Unc, and Arc.Discussion
The cosine similarity measured a full shape distance between pairs of population kernel densities and thus incorporated richer population variability and thus yielded significant group differences between HC and MDD compared to the standard mean-based approach. The WM tract interactions between the ILF and ThR projection tracts and CSTs in MDD patients, suggest disruptions in WM regions involved in sensorimotor function, emotion, and visual memory.Conclusion
The population kernel density approach revealed significant short- and long-range interactions between WM tracts outperforming the standard mean-based correlation approach and may serve as a potential discriminator of WM pathology in disease.Acknowledgements
This work was supported by NIH/NIAAA grant R01-AA026834, NIH/NIMH grants MH110008 and MH102743, and NIH/NIGMS grant T32-GM008042.References
1. Yong He, Zhang J Chen, and Alan C Evans, “Small-world anatomical networks in the human brain revealed by cortical thickness from MRI,” Cerebral Cortex, vol. 17, no. 10, pp. 2407–2419, 2007.
2. Michael Wahl, Yi-Ou Li, Joshua Ng, Sara C LaHue, Shelly R Cooper, Elliott H Sherr, and Pratik Mukherjee, “Microstructural correlations of white matter tracts in the human brain,” NeuroImage, vol. 51, no. 2, pp. 531–541, 2010.
3. Seung Jae Lee, Rachel J. Steiner, Yang Yu, Sarah J. Short, Michael C. Neale, Martin Andreas Styner, Hongtu Zhu, and John H. Gilmore, “Common and heritable components of white matter microstructure predict cognitive function at 1 and 2y,” Proceedings of the National Academy of Sciences, vol. 114, no. 1, pp. 148–153,2017.
4. Simon R. Cox, Stuart J. Ritchie, Elliot M. Tucker-Drob, David C. Liewald, Saskia P. Hagenaars, Gail Davies, Joanna M. Wardlaw, Catharine R. Gale, Mark E. Bastin, and Ian J. Deary, “Ageing and brain white matter structure in 3,513 UK biobank participants,” Nature Communications, vol. 7, no. 1, pp. 1–13, 2016.
5. Zdravko I. Botev, J. F. Grotowski, and Dirk P. Kroese, “Kernel density estimation via diffusion,” Annals of Statistics, vol. 38, no.5, pp. 2916–2957, Jan 2010.
6. Matthew F. Glasser, Stamatios N. Sotiropoulos, J Anthony Wilson, Timothy S. Coalson, Bruce Fischl, et al., “The minimal preprocessing pipelines for the human connectome project,” NeuroImage, vol. 80, pp. 105–124, 2013.
7. Jesper L. R. Andersson and Stamatios N. Sotiropoulos, “An integrated approach to correction for off-resonance effects and subject movement in diffusion MR imaging,” NeuroImage, vol. 125, pp. 1063 – 1078, 2016.
8. Ben Jeurissen, Jacques-Donald Tournier, Thijs Dhollander, Alan Connelly, and JanSijbers, “Multi-tissue constrained spherical deconvolution for improved analysis of multi-shell diffusion MRI data,” NeuroImage, vol. 103, pp. 411 – 426, 2014.
9. Jason D. Yeatman, Robert F. Dougherty, Nathaniel J. Myall, Brian A. Wandell, and Heidi M. Feldman, “Tract profiles of white matter properties: Automating fiber-tract quantification,” PLOS ONE, vol. 7, no. 11, pp. 1–15, 11 2012.
10. D. A. Williams, “A test for differences between treatment means when several dose levels are compared with a zero dose control,” Biometrics, pp. 103–117, 1971.
11. Yoav Benjamini and Daniel Yekutieli, “The control of the false discovery rate in multiple testing under dependency,” Annals of statistics, pp. 1165–1188, 2001.
Figures