4293
Robust Estimation of Fascicle-based Fractional Anisotropy on Fiber Crossings
Erick Hernandez-Gutierrez1, Ricardo Coronado-Leija2, Gabrielle Grenier3, Maxime Descoteaux3, and Alonso Ramirez-Manzanares1
1Computer Science, CIMAT A.C., Guanajuato, Mexico, 2New York University School of Medicine, New York, NY, United States, 3Université de Sherbrooke, Sherbrooke, QC, Canada
1Computer Science, CIMAT A.C., Guanajuato, Mexico, 2New York University School of Medicine, New York, NY, United States, 3Université de Sherbrooke, Sherbrooke, QC, Canada
Synopsis
In this work, a novel multi-shell modelling method is proposed to compute fascicle-based fractional anisotropy that is shown accurate and robust in the centrum semiovale of human brain clinical multi-shell datasets. It does not require tractography and it is informed by the local modelling estimations provided by the method called MRDS. The effectiveness of our methodology is also shown on synthetic experiments.
Introduction
The estimation of axon bundle-specific microstructure descriptors is an important research area. Those descriptors are useful to understand the global brain connectivity profiles as well as the dynamics of neuropathological processes. Multi-Resolution Discrete-Search (MRDS)1 is a method to solve the multi-tensor model of the diffusion MRI signal. It is able to provide DTI-like metrics, such FA and MD, for each bundle in individual voxels. MRDS provides similar information like DIAMOND8 and CSD10 methods for computing individual diffusion descriptors, however it has shown to be more robust to noise1,9. We use the MRDS multi-tensor maps to develop a novel bundle-wise segmentation. Our segmentation allows us to compute robust averaged-based estimators of the per-bundle FA as well as to reinform the MRDS solution to improve the recovered data.Methods
The methodology is structured in 5 stages executed in the original spatial resolution. The stages are described in sequential order as following:Denoising: Using MRtrix36.
Bias Correction: Applying the Gudbjartsson’s scheme5.
Local Modelling: Voxel wise multi-tensor modelling with MRDS method1. After fitting the model, a multi-tensor field (MTF) is obtained. MRDS also provides metrics of the tensors like FA and MD.
Bundle Segmentation: We defined a distance function2 between two neighboring tensors $$$T$$$ and $$$P$$$ in the MTF
$$D(T,P) = \frac{||pos(T)-pos(P)||^2}{d^2} + \frac{angle(T,P)}{\theta} + \frac{|FA(T)-FA(P)|}{f} + \frac{|MD(T)-MD(P)|}{m}$$
where angle() gives the angle between the direction of the tensors and $$$d$$$, $$$\theta$$$, $$$f$$$ and $$$m$$$ are user defined parameters. Then, a similarity function is defined as $$$S(T,P)=exp(-D(T,P))$$$. Two tensors T and P in the MTF are connected if they belong to two neighboring voxels (in the 2nd order voxel’s neighborhood) and $$$S(T,P)>E$$$ where $$$E$$$ is a user defined threshold value.Using the MTF from MRDS and the similarity function $$$S$$$, our segmentation problem can be formulated as a MTF segmentation problem. The compartments of each multi-tensor belong to a class (bundle). The segmentation is performed by a flood-fill based algorithm. Given an initial tensor in the MTF, the algorithm looks for all the tensors in the neighboring voxels and determines the connected tensors to the initial one. Then, the process is recursively repeated also for the connected neighbors tensors. Every connected cluster of tensors represents a fiber bundle in the white-matter.
Filtering: The filtering stage is used to enhance the results in the estimation stage by using the information obtained in the segmentation stage. Given the segmentation in bundles of the tensors in the MTF, the FA value of every tensor is averaged with the FA value of its 2nd order neighbors within the same bundle. This filtering method is helpful to remove the dispersion when estimating the FA value for each tensor while keeping the local spatial properties.
The methodology was tested on the Penthera3T dataset7. The DWI (112x112 matrix, TR 5615 ms, TE 95 ms, SENSE factor of 2) were acquired on a 3 Tesla MRI (Philips, Ingenia) with a single-shot echo-planar imaging sequence having 3 different shells, b=300, 1000, 2000 mm^2/s with respectively 8, 32 and 60 directions evenly distributed, and 7 b=0 mm2/s with a 2 mm isotropic spatial resolution. For the validation on synthetic data, the HARDI reconstruction workshop phantom4 was used. The acquisition scheme used to generate the phantom corresponds with the scheme of the Penthera3T dataset. We set the FA values different for each bundle in order to simulate per-bundle damages as we detail below. One of the bundles has a low FA value along the entire bundle, simulating a completely damaged bundle. Besides, we have one bundle with a normal FA value in most of the bundle, except for a compact connected region where the FA is lower, simulating a partially damaged bundle. The third bundle has a normal FA value across all the bundle, simulating a healthy bundle. Finally, Rician noise was added with a SNR =12 according to the noise level estimated on the Phentera3T dataset.
Results and Discussion
The obtained segmentation is visually correct, see Fig. 1. However, it struggles recovering the partially damaged bundle. In fact, it lets see where the damaged region is in the red bundle. It can be observed from Fig. 2 that the estimation stage allows for an accurate estimation of the per-bundle-FA profiles. Plots in Fig. 3 for the FA values along each bundle report robustness to fiber crossing and, even before the filtering stage, it is easy to identify which bundle is healthy (blue profile), partially damaged (protuberance in the red profile) or fully damaged (green profile). Both Fig. 2 and Fig. 3 illustrate the effectiveness of the filtering stage decreasing dispersion while maintaining the appreciation of the local and global damages. Finally, Fig. 4 and Fig. 5 show promising results on real data.Conclusions
In this work, we showed that fascicle-based FA can be recovered. Results of the proposed methodology on synthetic data demonstrated that it is robust to noise (SNR=12) and able to detect challenging FA variations along the bundles. Results on real data make our methodology a suite candidate for detecting local and global FA profiles along the individual bundle associated with, for instance, tissue damage.
Acknowledgements
AR was supported by CONACyT Mexico and the National Laboratory for Magnetic Resonance Imaging (Conacyt, UNAM, CIMAT, UAQ).References
- Coronado-Leija et al. Estimation of Individual Axon Bundle Properties by a Multi-Discrete-Search Method. Medical Image Analysis, 2017.
- Ocegueda et al. Multi-Tensor Field Spectral Segmentation for White Matter Fiber Bundle Classification. IEEE International Symposium on Biomedical Imaging, 2013.
- Theaud et al. TractoFlow: A Robust, Efficient and Reproducible Diffusion MRI Pipeline Leveraging Nextflow & Singularity. NeuroImage, 2020.
- HARDI Reconstruction Workshop Phantom. ISBI 2012. http://hardi.epfl.ch/static/events/2012_ISBI/download.html#training-data.
- Gudbjartsson et al. The Rician Distribution of Noisy MRI Data. Magn Reson Med, 1995; 34(6): 910-914.
- MRtrix3 tools, https://mrtrix.readthedocs.io/en/latest/dwi_preprocessing/denoising.html, https://mrtrix.readthedocs.io/en/latest/reference/commands/mrcalc.html.
- Paquette et al. Penthera 3T [Data set], 2019. Zenodo. http://doi.org/10.5281/zenodo.2602049.
- Scherrer et al. Characterizing brain tissue by assessment of the distribution of anisotropic microstructural environments in diffusion-compartment imaging (DIAMOND). Magn Reson Med, 76(3), 2016, 963-77, PMID26362832, PMC4788987, NIHMS715838.
- Rojas-Vite et al. Histological validation of per-bundle water diffusion metrics within a region of fiber crossing following axonal degeneration. Neuroimage 201 (2019) 116013.
- Tournier et al. Robust determination of the fibre orientation distribution in diffusion MRI: non-negativity constrained super-resolved spherical deconvolution, Neuroimage,2007, 35( 4): 1459-1472.
Figures
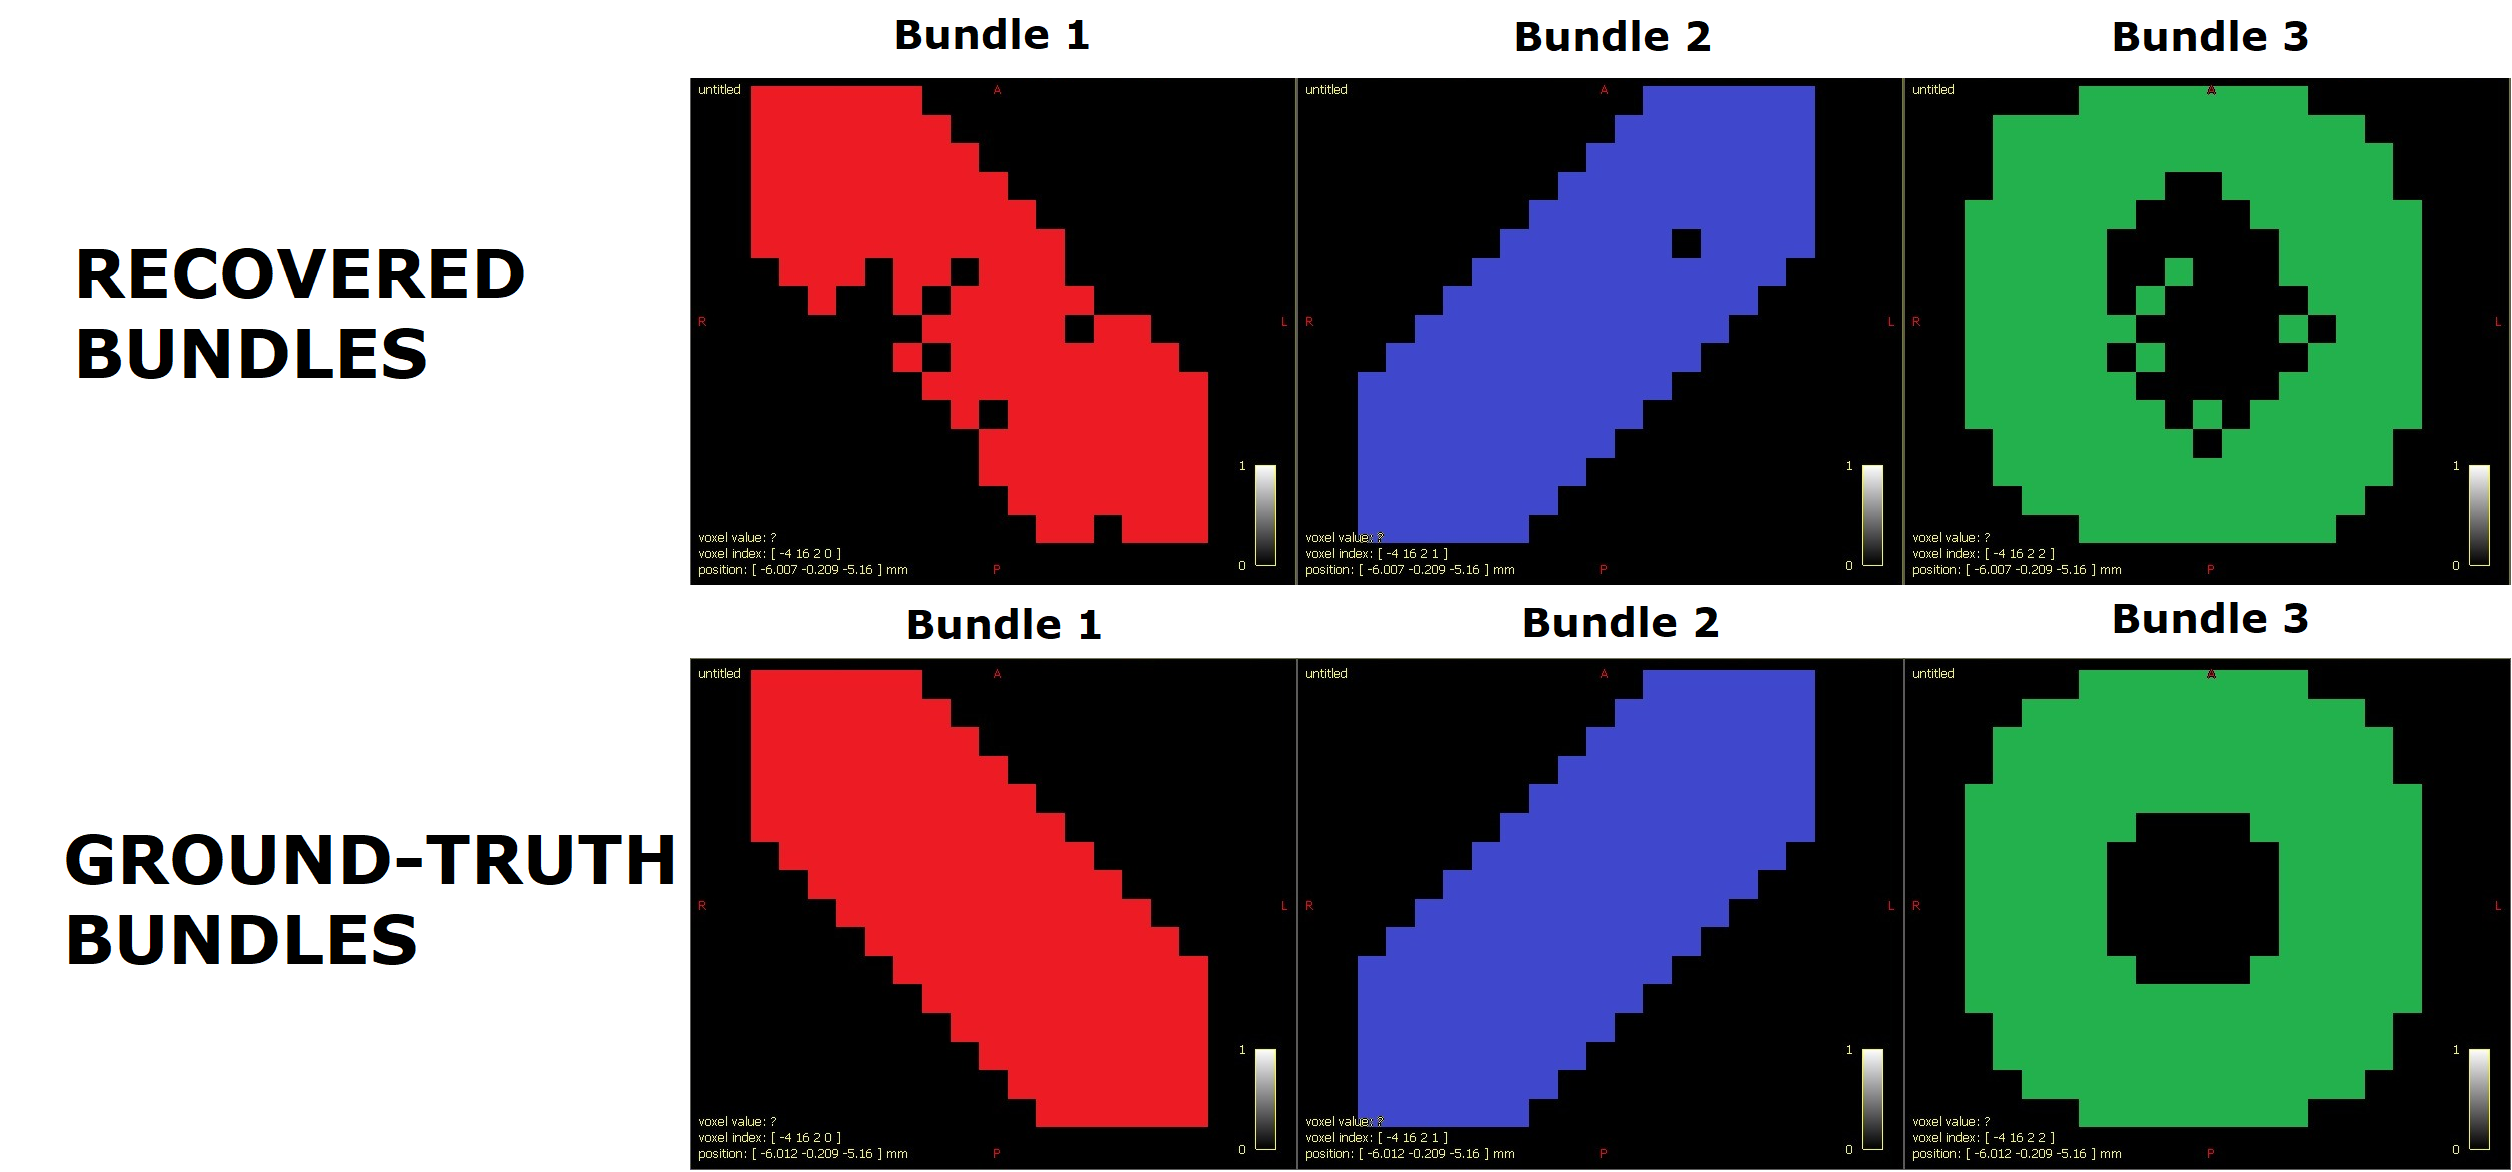
Fig. 1 (up) Segmentation obtained after the segmentation stage of the pipeline. Each recovered fiber bundle is colored differently to identify each bundle. The color of each fiber bundle is consistent with the colors shown in all the other figures. (down) Ground-truth fiber bundles.
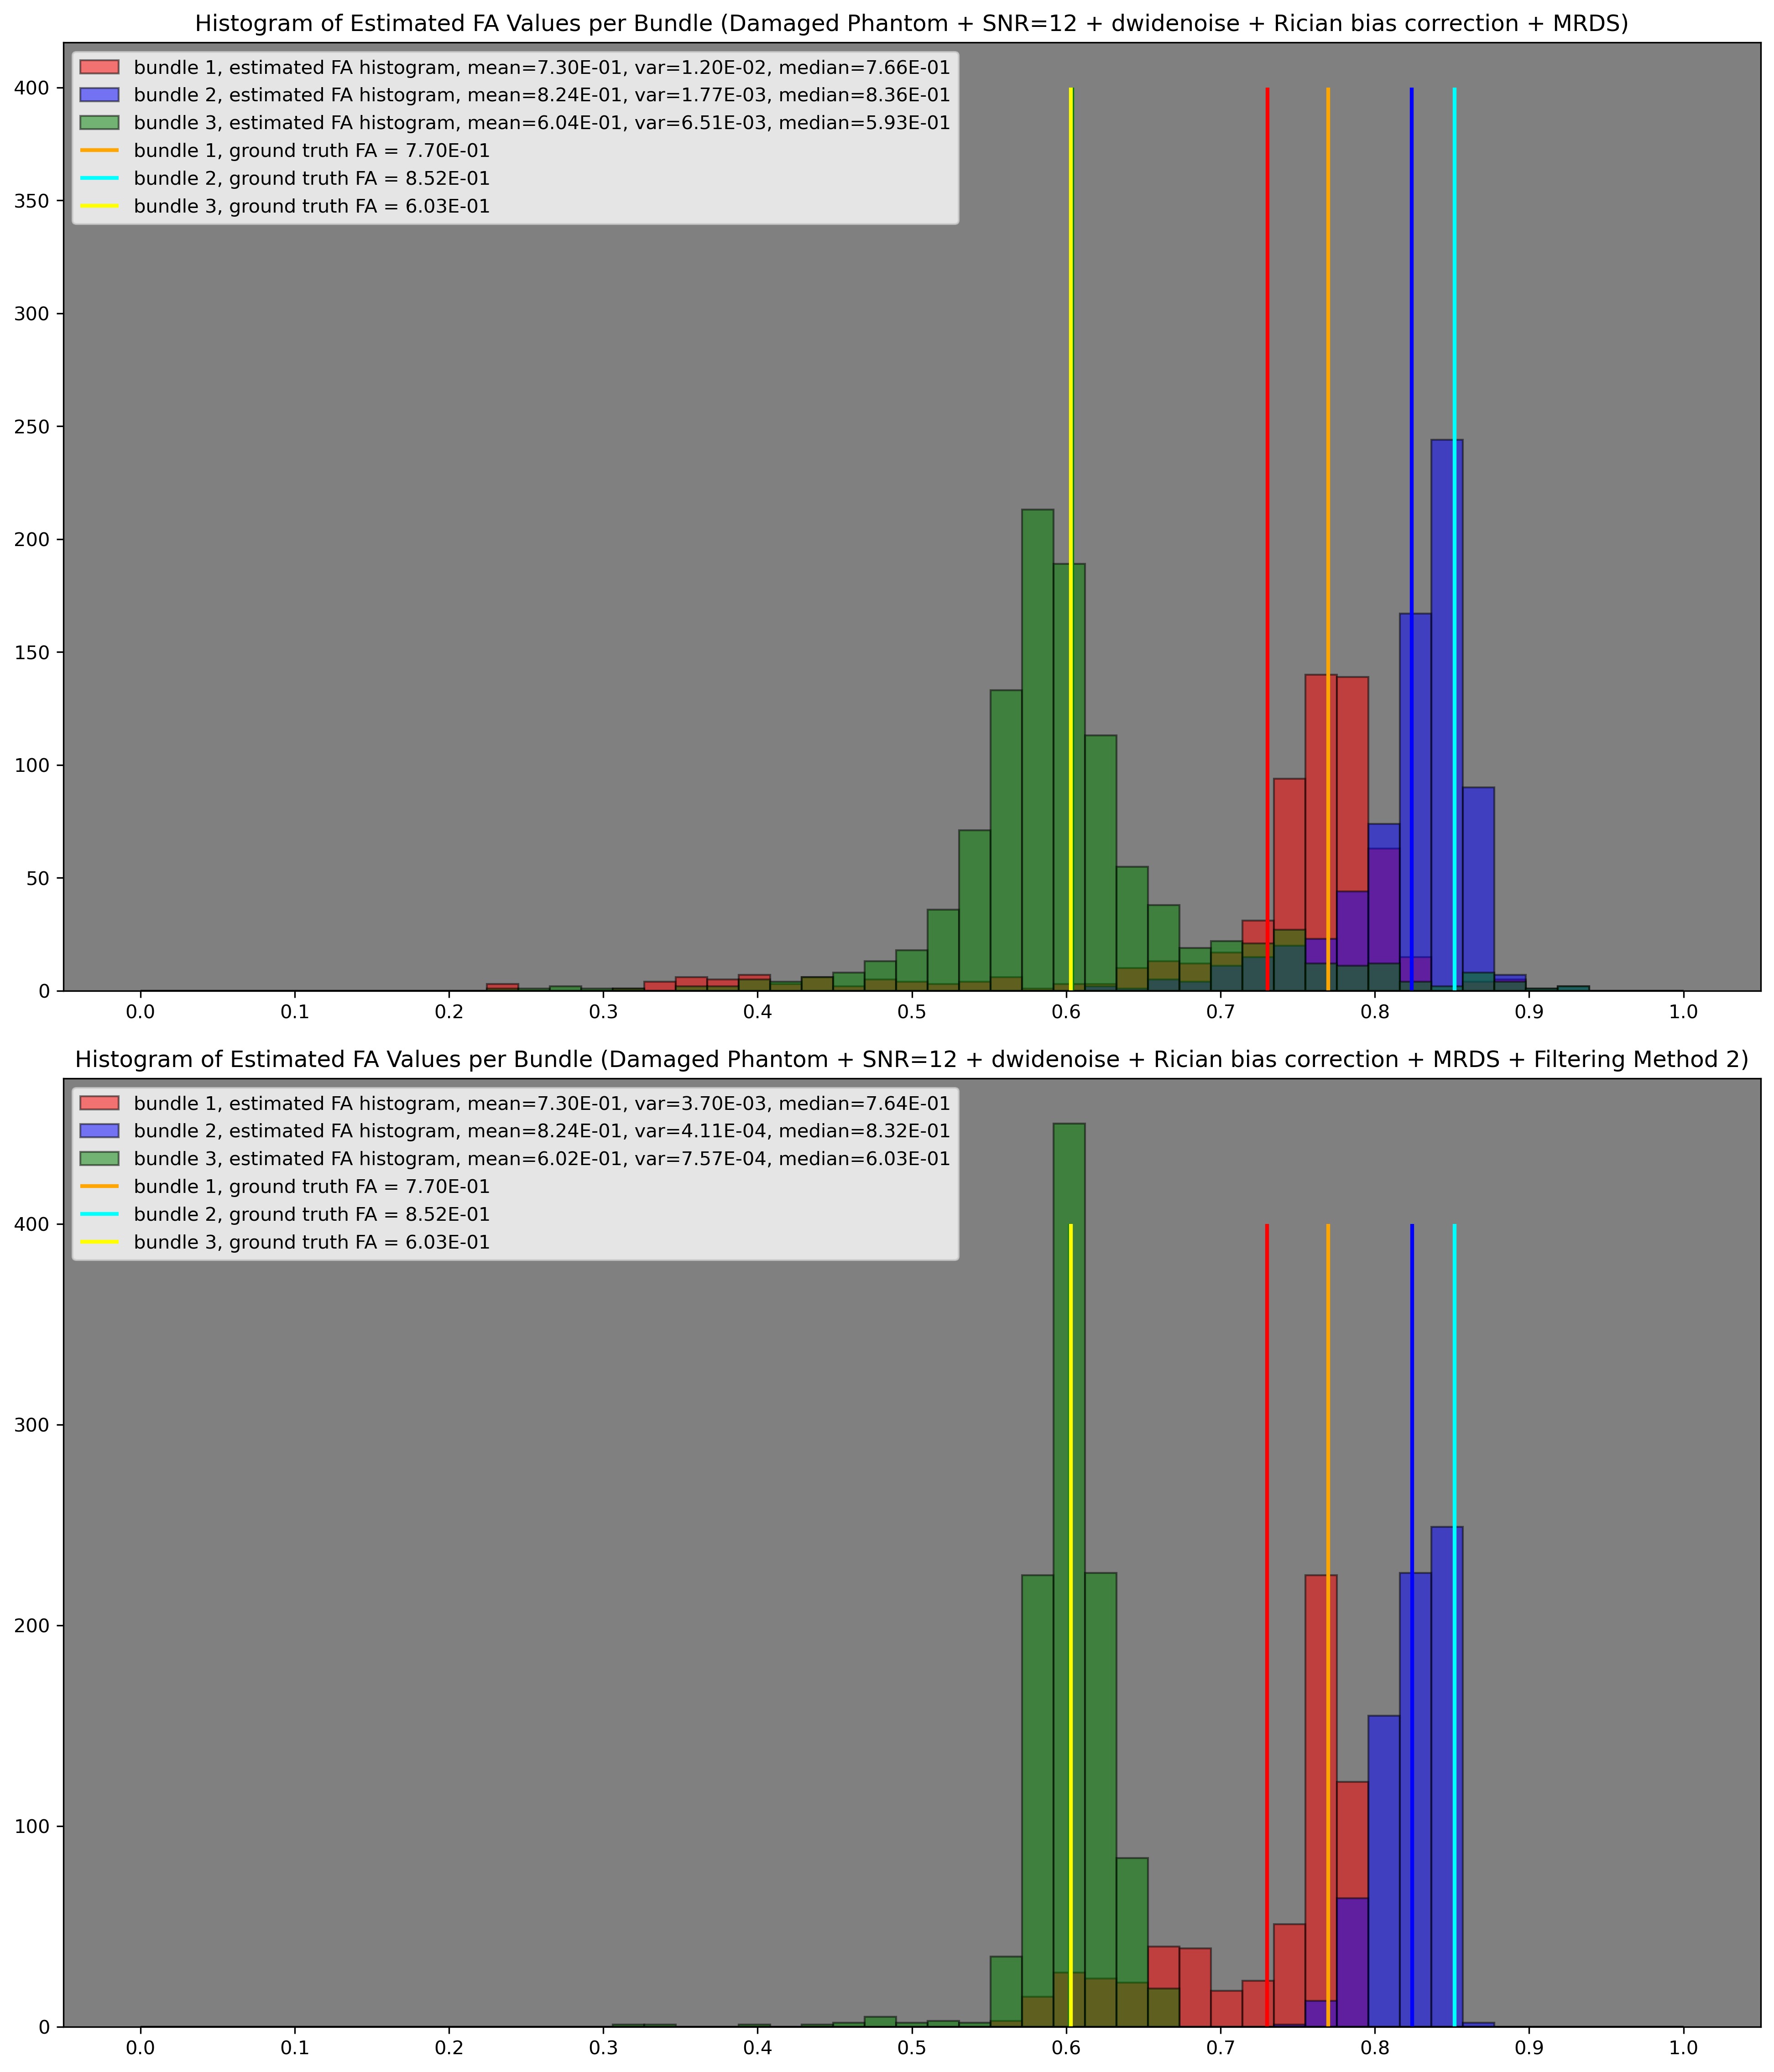
Fig. 2 Histograms of the estimated FA values per bundle (up) before the filtering stage and (down) after the filtering stage. The mean of each histogram is represented with a vertical line having the same color as the histogram. For comparison, ground-truth FA values for each bundle are also included.
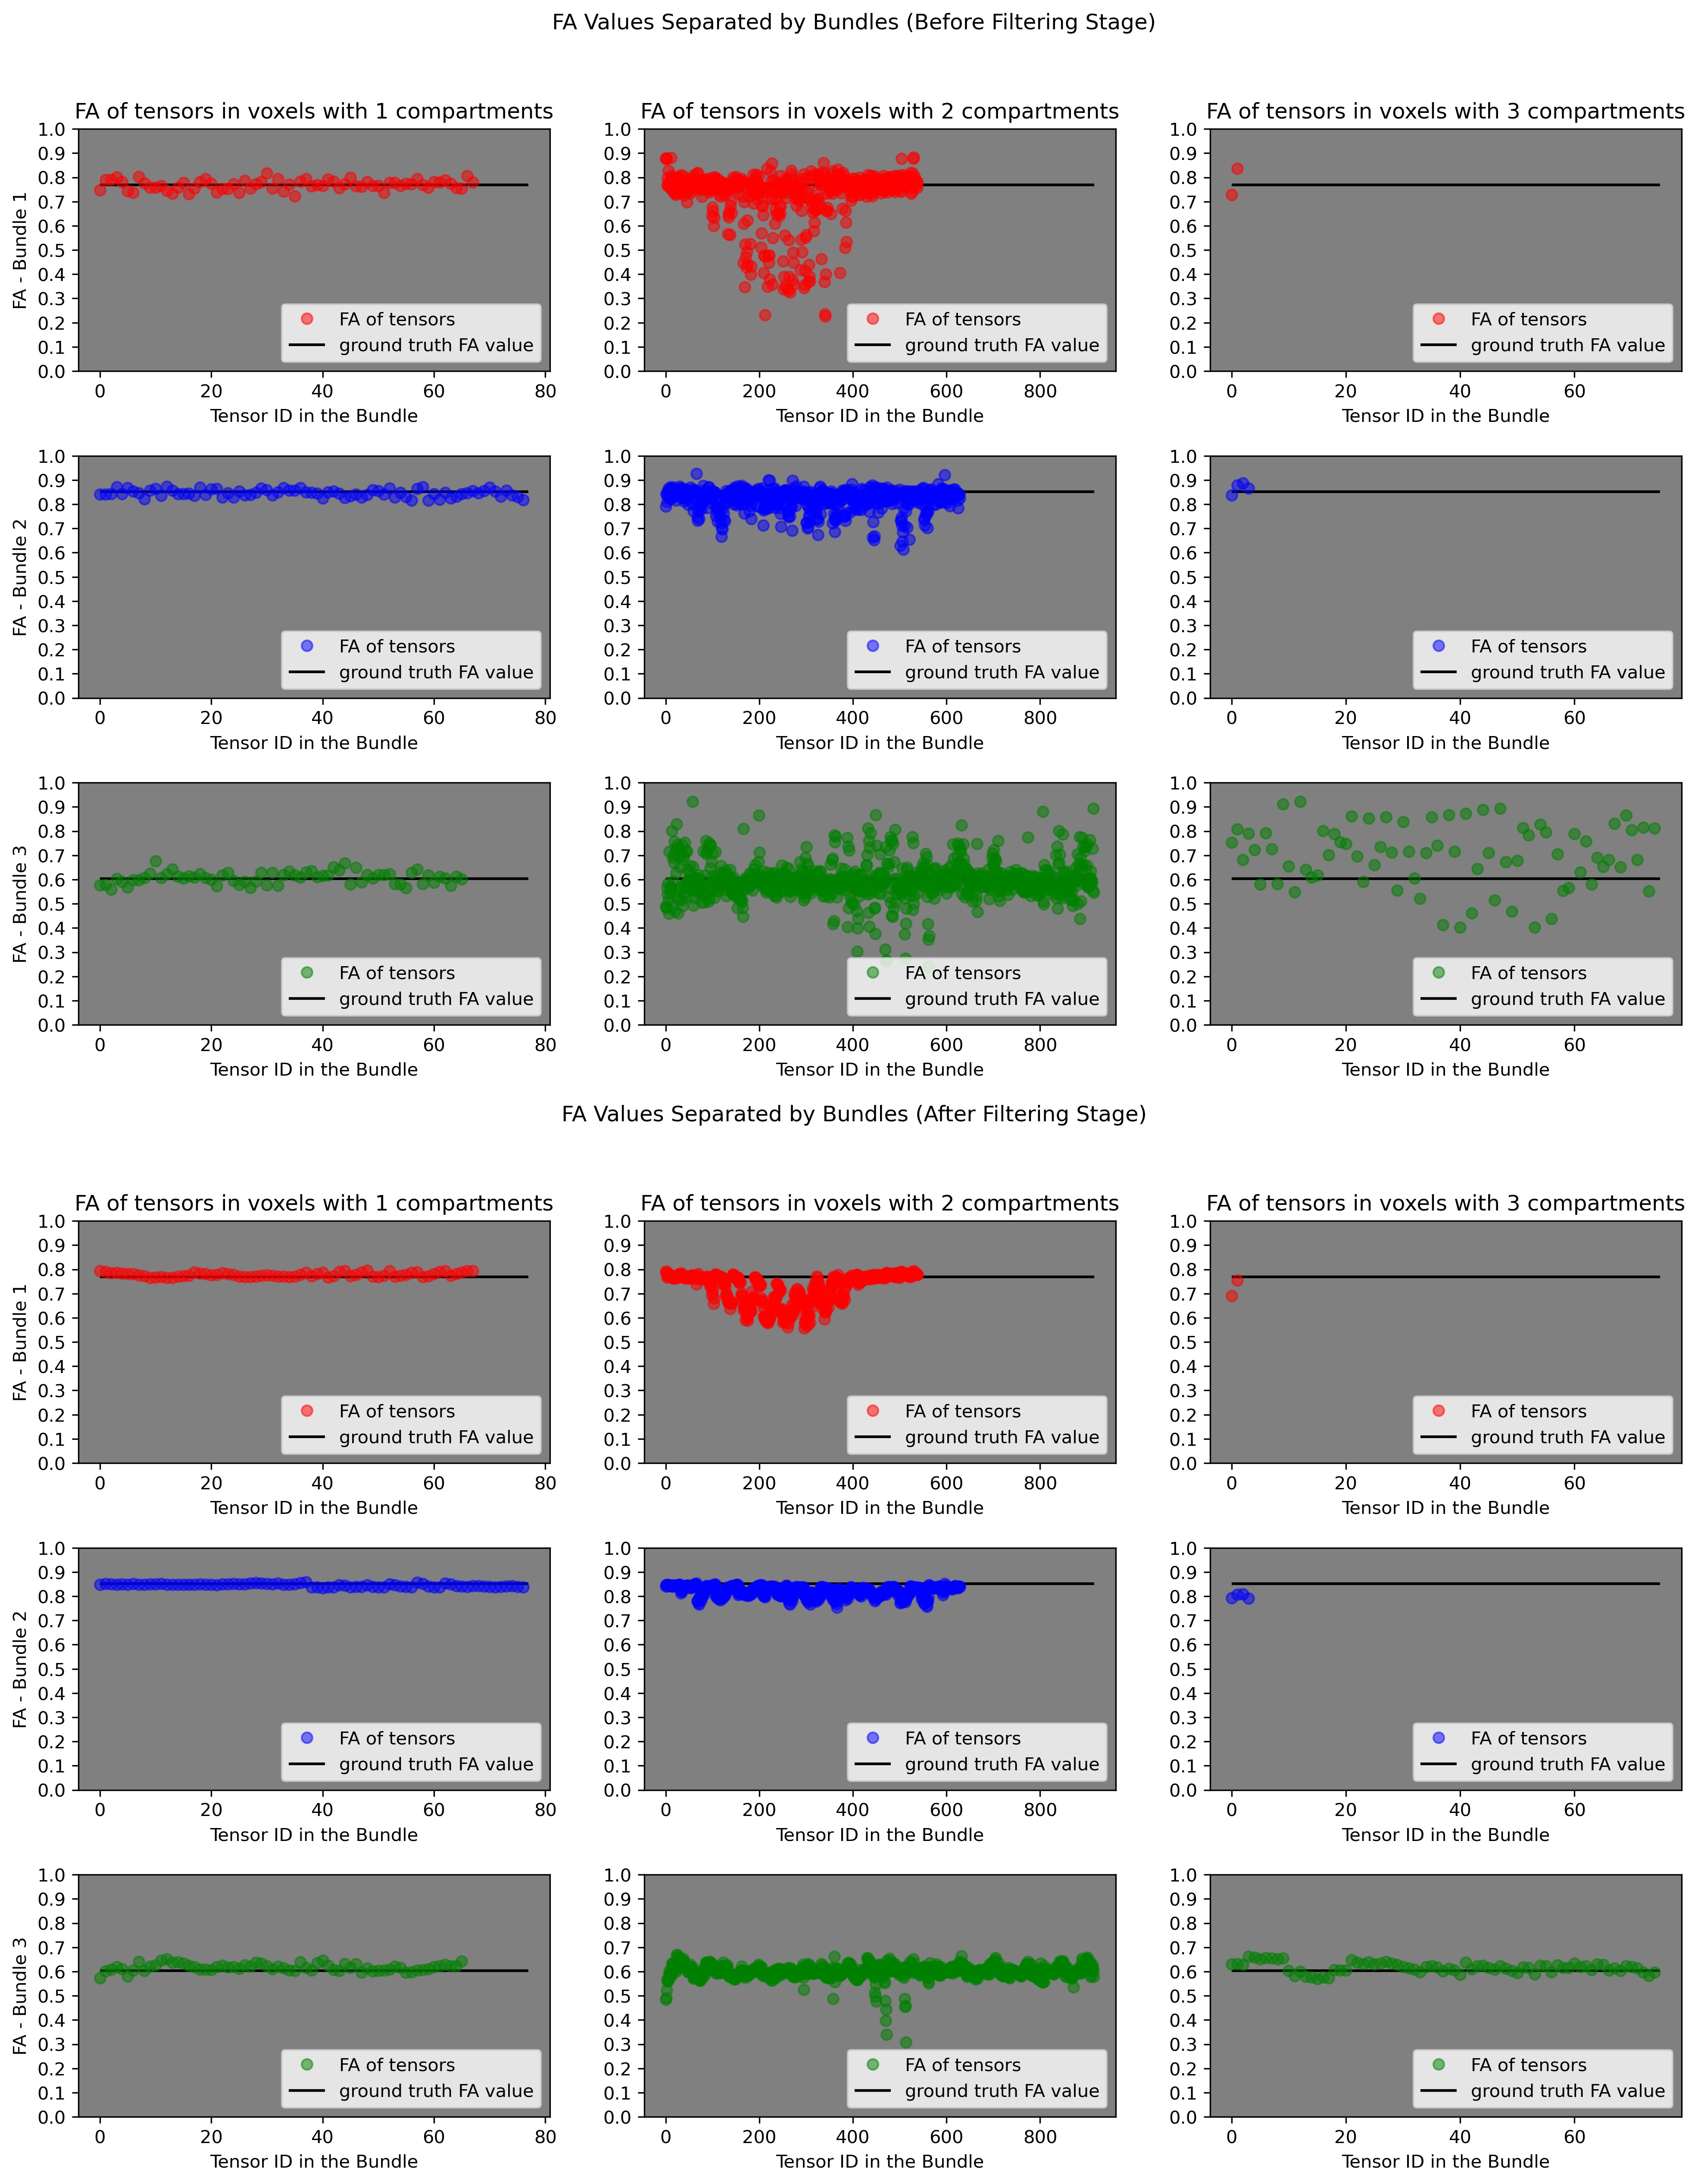
Fig. 3 FA values along each bundle (up) before the filtering stage and (down) after the filtering stage. Each row represents the FA values for a bundle. Each column represents, respectively, FA values in voxels with 1, 2 and 3 compartments (i.e., FA values in each bundle are shown separated depending on the number of compartments). For comparison, the ground-truth FA value for each bundle was added as horizontal lines. One can identify which bundle is healthy (blue profile), partially damaged (protuberance in the middle of the red profile) or fully damaged (green profile).
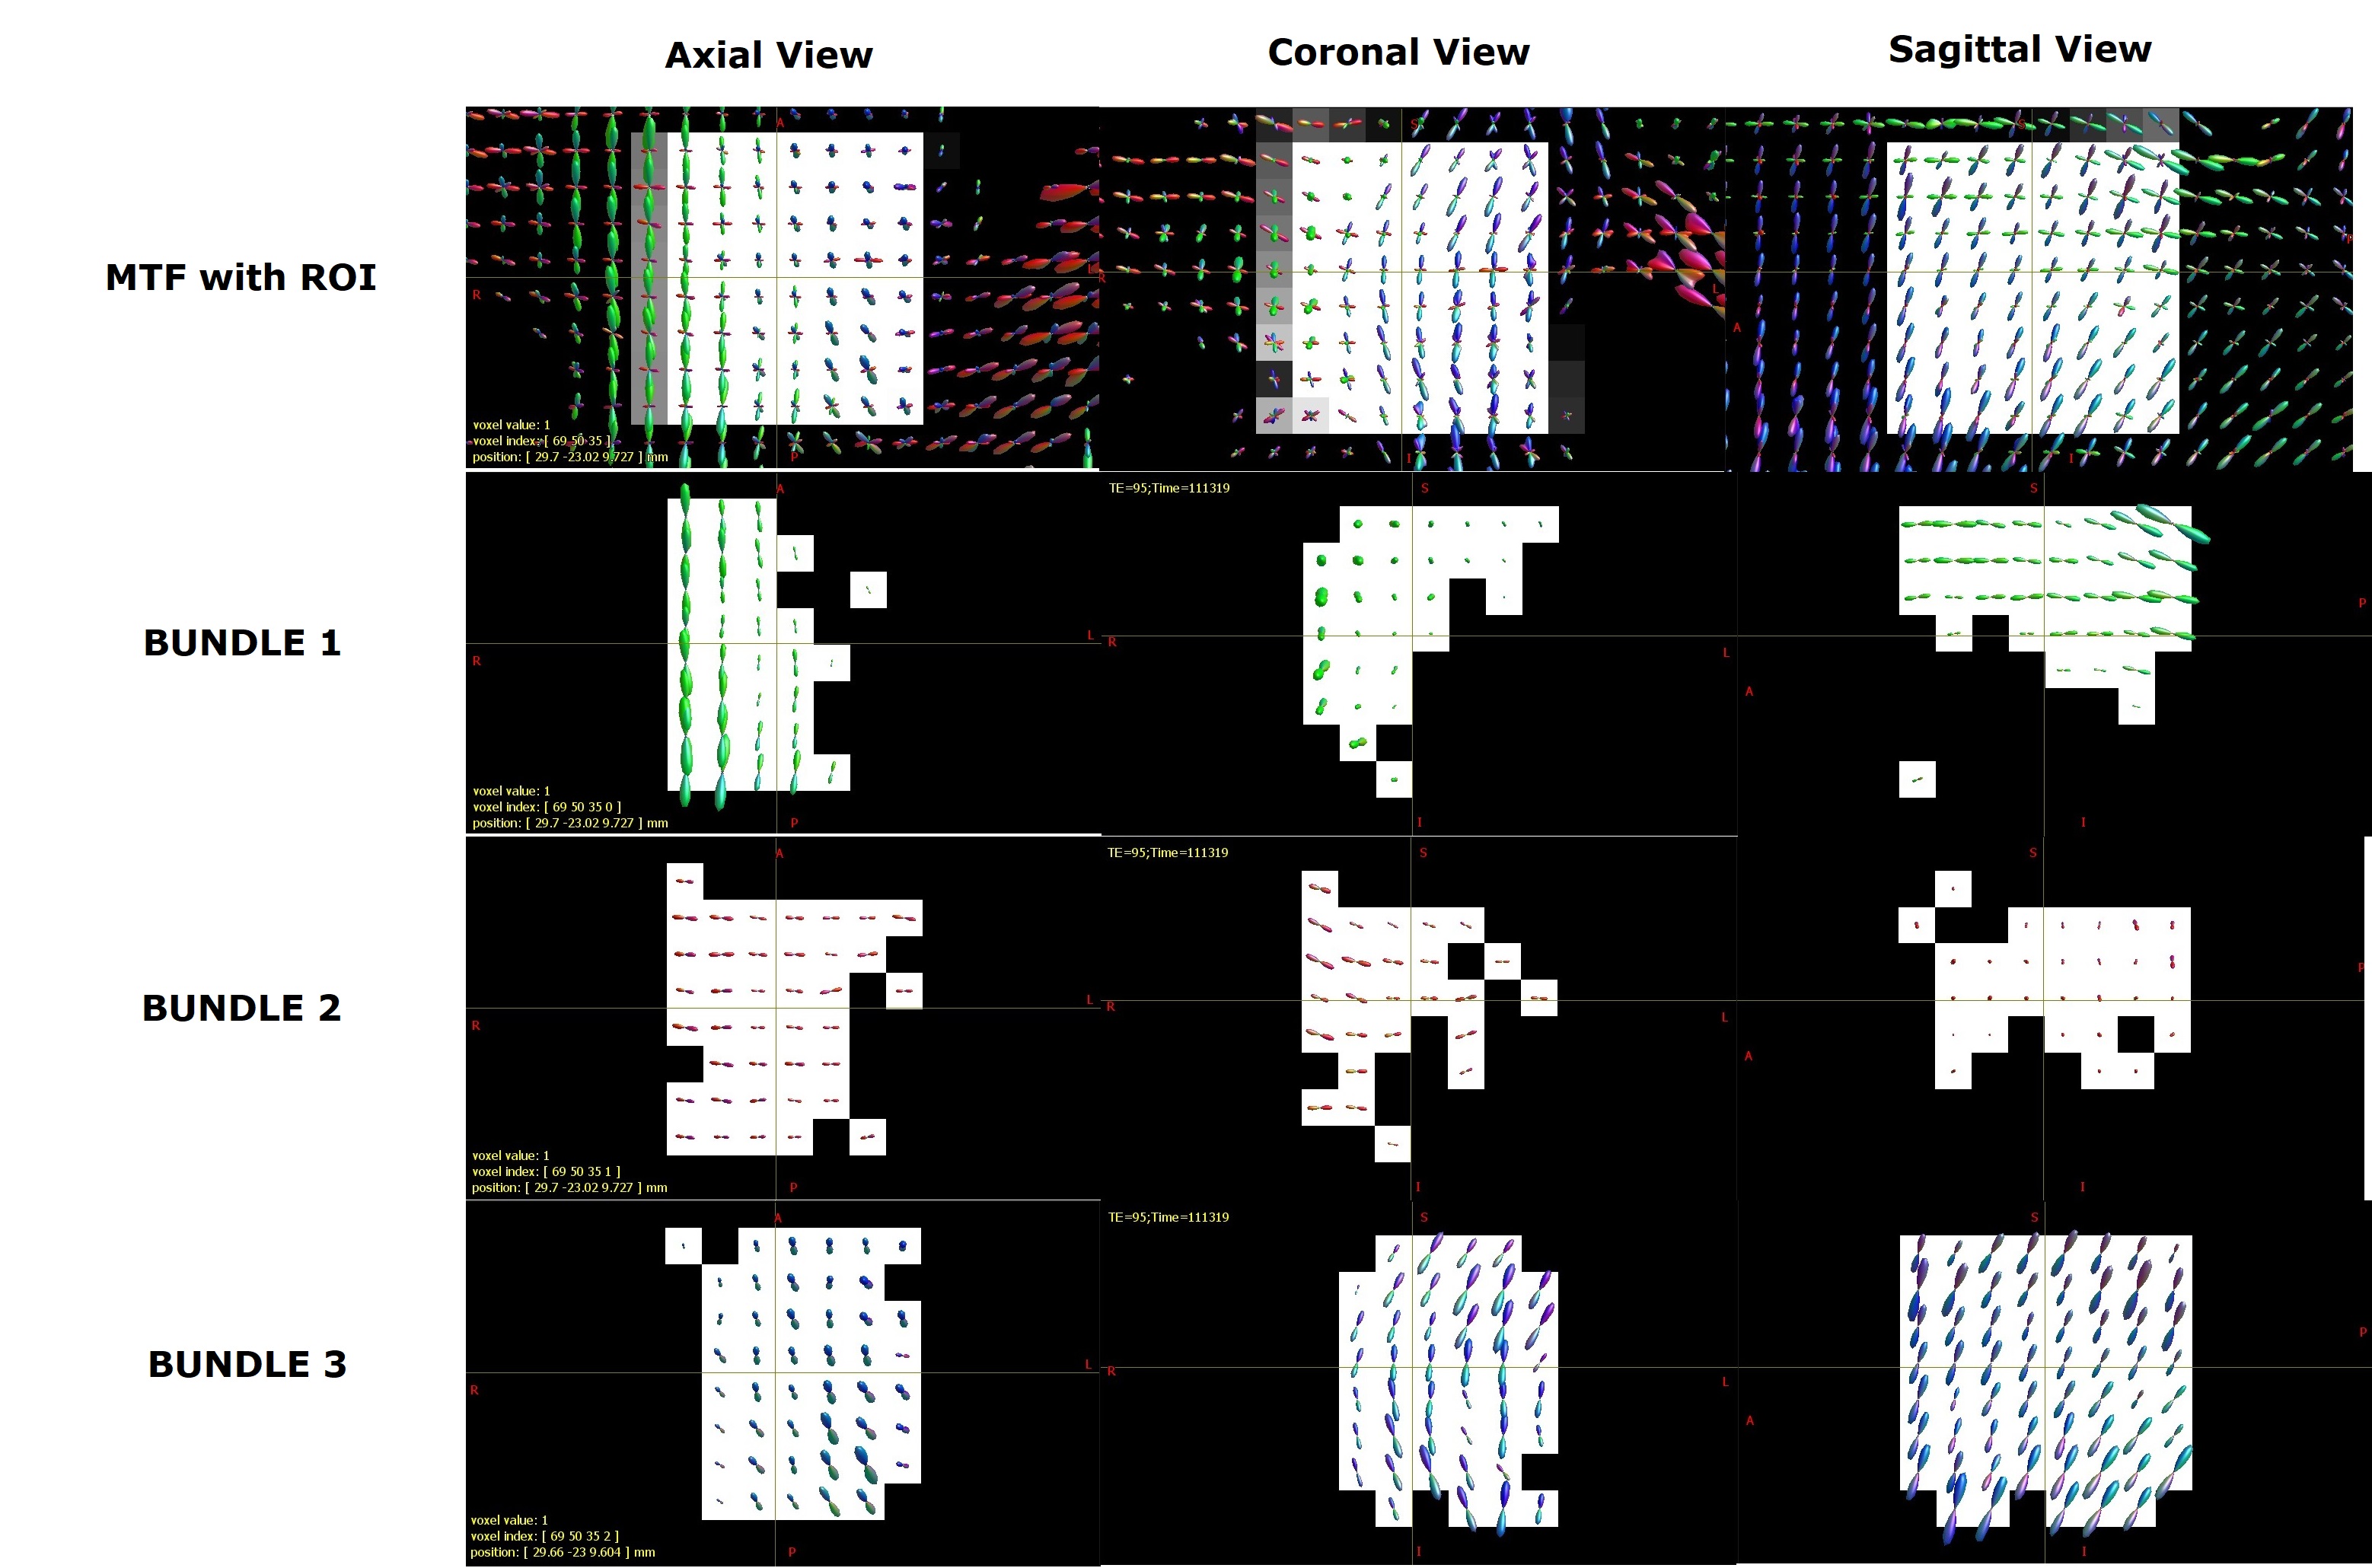
Fig. 4 Results of the segmentation on Penthera3T dataset. The first row shows the MTF estimated with MRDS as well as the region-of-interest (ROI). In this case, the ROI is the centrum semiovale in the right hemisphere of the human brain. Rows 2,3 and 4 show, respectively, the obtained bundle 1 (green), bundle 2 (red) and bundle 3 (blue). The colors of the bundles are maintained for the results in Fig. 5. Each column gives the orthogonal views of the same ROI.
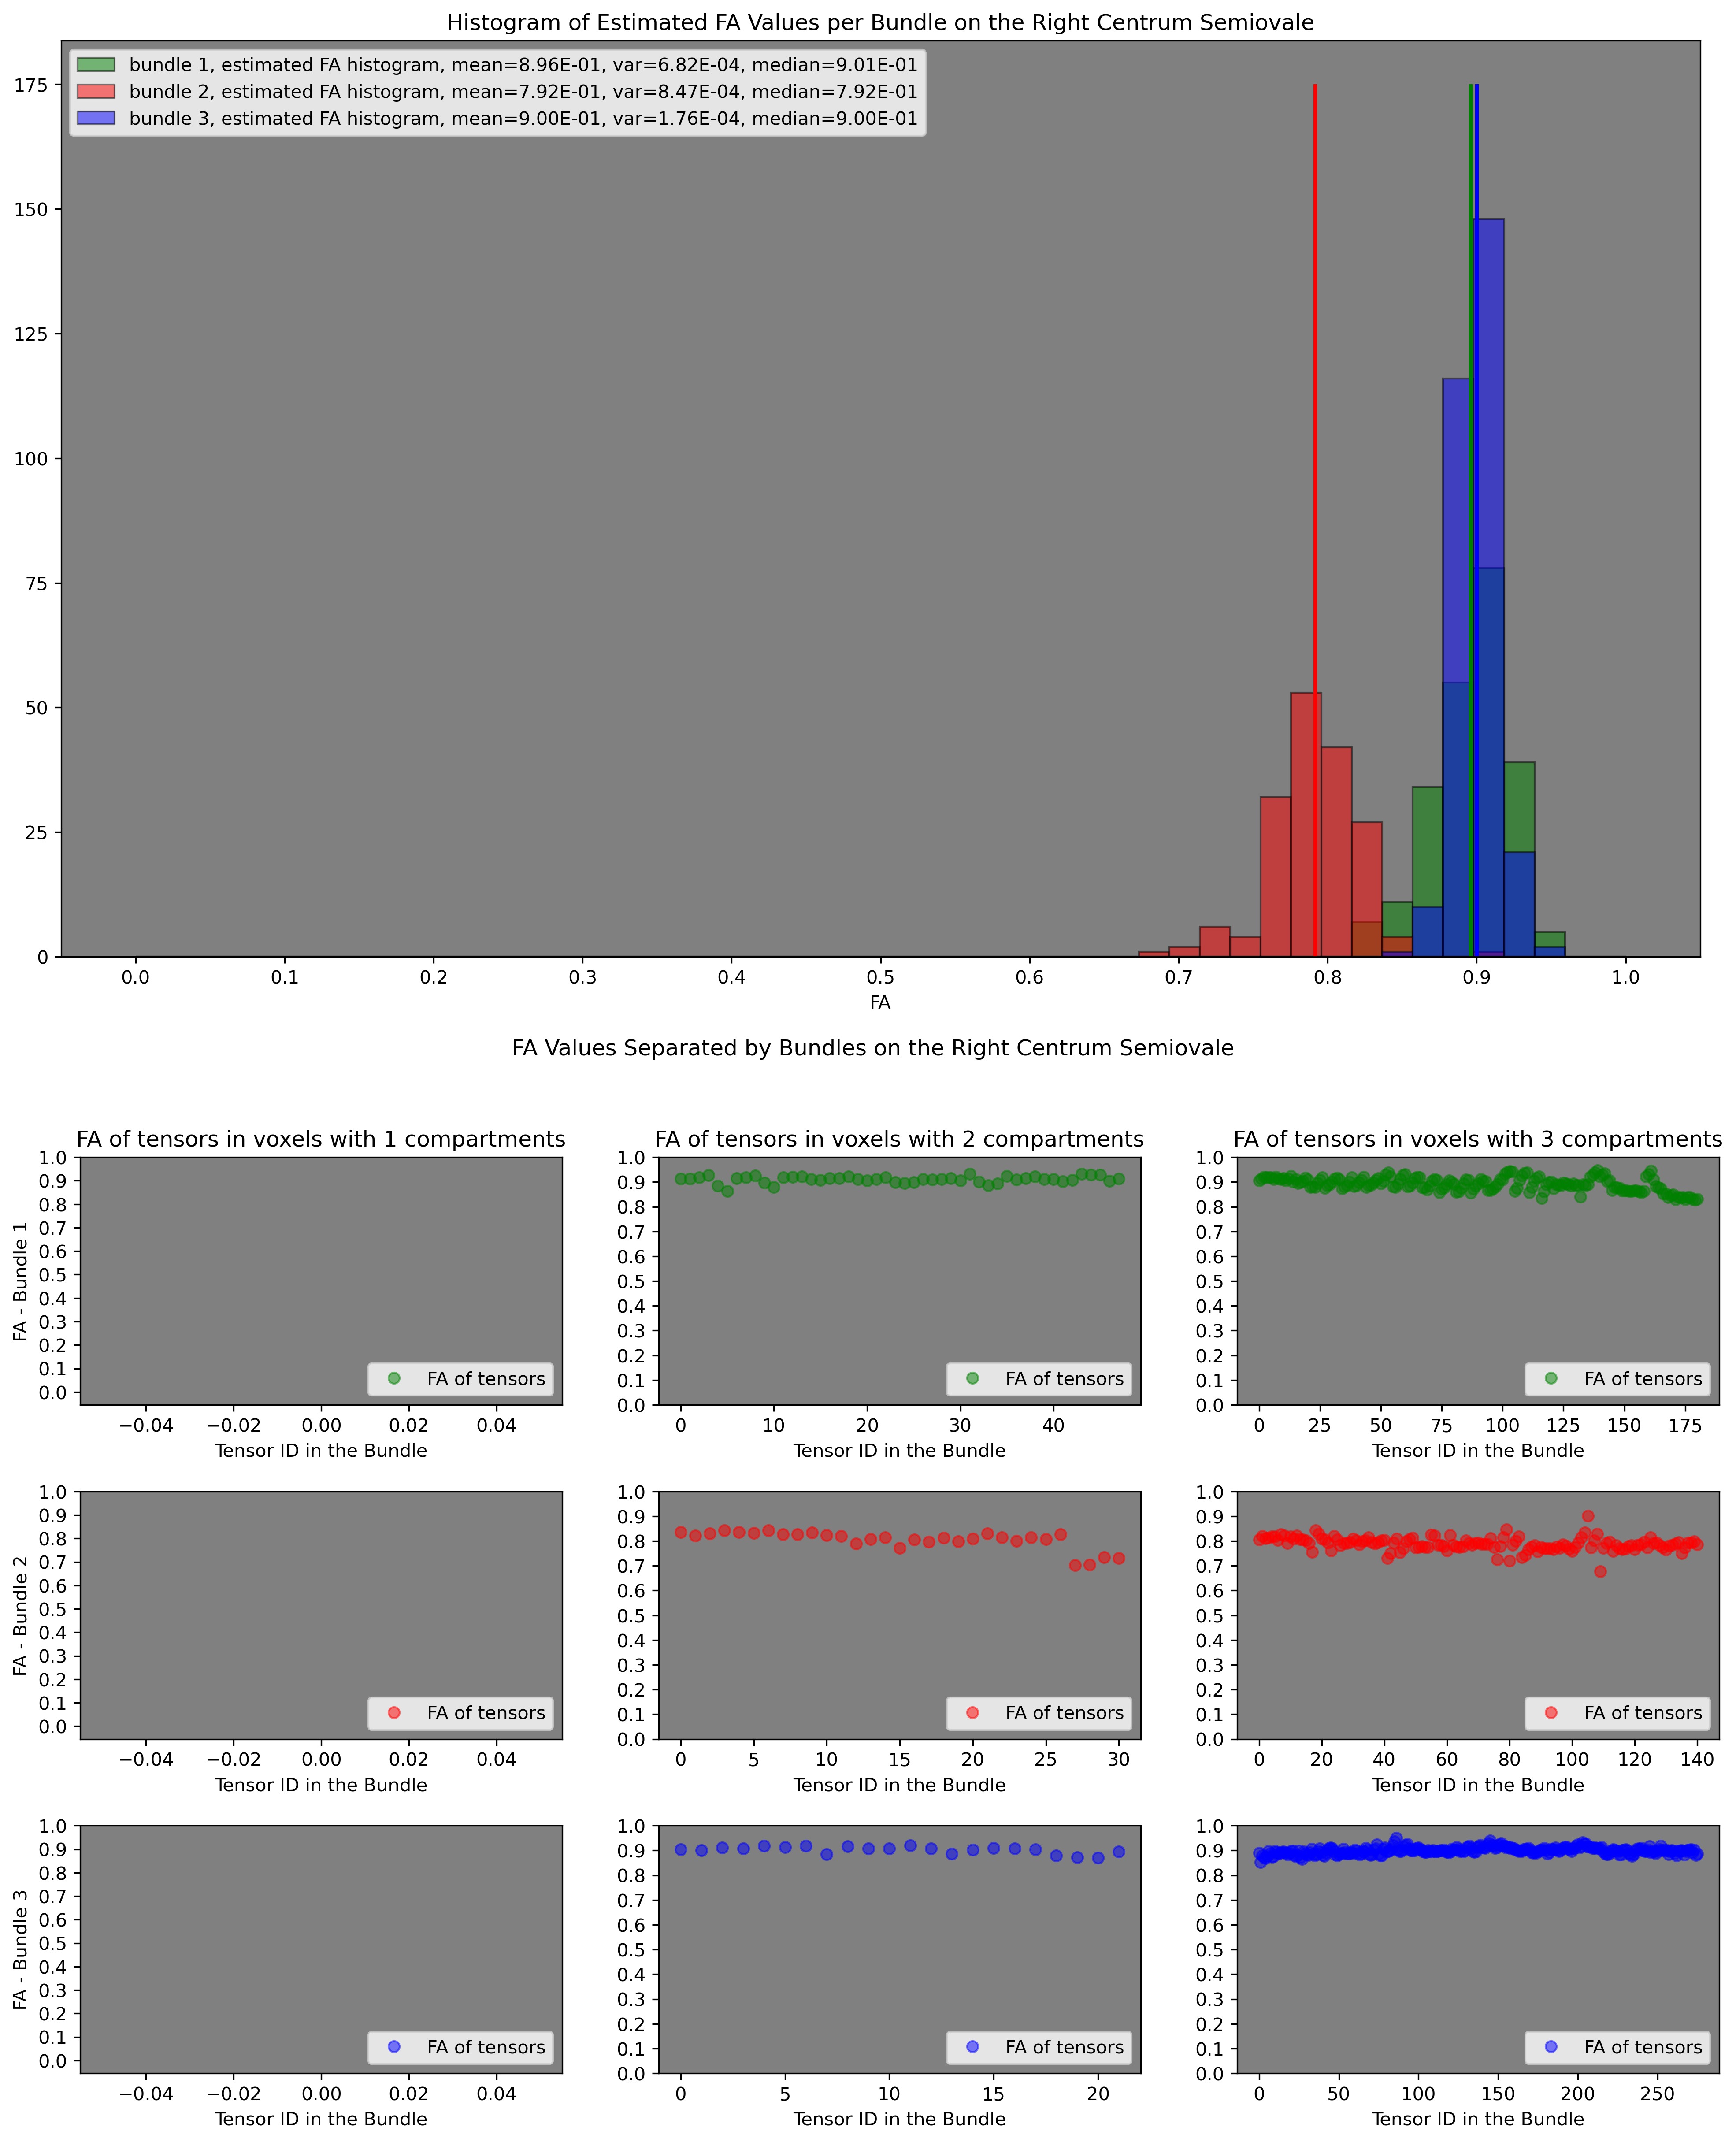
Fig. 5 Results of the FA estimation per bundle on Penthera3T dataset. (up) Histograms of the estimated FA values per bundle. (down) FA values along each bundle. All these results include the filtering stage.