4291
Advantage of simultaneous multi-slice readout-segmented echo-planar imaging on diffusion MRI measurements of the human optic nerve
Hiromasa Takemura1,2, Wei Liu3, Hideto Kuribayashi4, and Ikuhiro Kida1,2
1Center for Information and Neural Networks (CiNet), National Institute of Information and Communications Technology, Suita-shi, Japan, 2Graduate School of Frontier Biosciences, Osaka University, Suita-shi, Japan, 3Siemens Shenzhen Magnetic Resonance Ltd, Shenzhen, China, 4Siemens Healthcare K.K., Tokyo, Japan
1Center for Information and Neural Networks (CiNet), National Institute of Information and Communications Technology, Suita-shi, Japan, 2Graduate School of Frontier Biosciences, Osaka University, Suita-shi, Japan, 3Siemens Shenzhen Magnetic Resonance Ltd, Shenzhen, China, 4Siemens Healthcare K.K., Tokyo, Japan
Synopsis
Diffusion MRI measurements of the human optic nerve remain challenging due to susceptibility-induced artifacts, despite their importance in neuro-ophthalmology research. Here, we demonstrate that simultaneous multi-slice (SMS) readout-segmented echo-planar imaging (rsEPI) acquisition has advantages in measuring the human optic nerve over conventional SMS single-shot EPI (ssEPI) with respect to image quality. This result was confirmed with statistical comparisons demonstrating higher fractional anisotropy along the optic nerve in SMS rsEPI data compared with that in SMS ssEPI data. Taken together, this study demonstrates the utility of SMS rsEPI for diffusion MRI measurements of tissue properties of the optic nerve.
Introduction
Diffusion MRI (dMRI) and tractography are the only available methods for evaluating the tissue properties of visual white matter pathways in living humans, and thus provides important insights into clinical studies on retinal disorders1,2. However, dMRI measurement of the optic nerve using conventional single-shot echo-planar imaging (ssEPI) remains challenging because of susceptibility-induced artifacts. Readout-segmented EPI (rsEPI3) has been proposed to reduce susceptibility-induced artifacts by dividing the acquisition space into multiple segments and enabling acquisition of dMRI data using a shorter echo time. While this approach has been confirmed to reduce susceptibility-induced artifacts, a major drawback of rsEPI is its prolonged acquisition time4. Recently, simultaneous multi-slice (SMS) rsEPI has been proposed to reduce the acquisition time of rsEPI5. However, it is not yet understood which part of the white matter tracts SMS rsEPI acquisition has advantages over SMS ssEPI. This study aimed to evaluate the advantages of SMS rsEPI for performing dMRI measurements of the human optic nerve.Methods
Fourteen healthy subjects participated in this study after providing written informed consent. dMRI data were collected by using a Siemens 3T scanner (MAGNETOM Prisma, Siemens Healthcare, Erlangen, Germany) with 32-channel head coil. We acquired dMRI data using SMS rsEPI (prototype sequence) and SMS ssEPI in two different acquisition conditions (Experiment 1: 2 mm isotropic, 30 directions, b=1000 s/mm2; Experiment 2: 1.8 mm isotropic, 64 directions, b=2000 s/mm2). As a result of five readout-segmentations, SMS rsEPI acquisition was performed with a shorter echo time (53 ms and 63 ms for Exp 1 and 2) than that for SMS ssEPI (63 ms and 75 ms for Exp 1 and 2). SMS rsEPI data were acquired with shorter echo spacing (0.34 ms for both Exp 1 and 2) than that for SMS ssEPI data (0.65 and 0.70 ms for Exp 1 and 2). SMS ssEPI acquisition was repeated multiple times to match the acquisition time (13:11 and 35:00 for Exp 1 and 2) to that of SMS rsEPI (12:50 and 35:17 for Exp 1 and 2). dMRI images were corrected for susceptibility-induced distortions and eddy-current distortions using FSL6,7. We fit the diffusion tensor model to dMRI data to calculate fractional anisotropy (FA8) in each voxel, by using RESTORE9. We identified the optic nerve from dMRI data using probabilistic tractography implemented in MRTrix310,11. We also identified the optic tract and the optic radiation using conTrack12.Results
Figure 1 depicts dMRI images collected by SMS rsEPI and ssEPI in Experiment 1, with and without susceptibility-induced distortion correction. It shows that SMS rsEPI data had less susceptibility-induced distortion in the optic nerve than that with SMS ssEPI data in both cases. Figure 2 depicts FA along the optic nerve. In Experiment 1, we found that FA along the optic nerve in both hemispheres was significantly higher in SMS rsEPI data than in SMS ssEPI data (Figure 2; left, Cohen’s d’ = 1.20, P = 0.0001; right, d’ = 1.15, P < 0.0001). This result was replicated in Experiment 2 (left, d’ =2.07, P < 0.0001; right, d’ = 2.10, P < 0.0001). Figure 3 depicts FA along the optic tract. We did not find a significant difference in FA between SMS rsEPI and ssEPI in Experiment 1 (left, d’ = 0.33, P = 0.08; right, d’ = 0.31, P = 0.06), while we found that FA was significantly higher in SMS rsEPI data in Experiment 2 (left, d’ = 1.06, P < 0.0001; right, d’ = 1.24, P < 0.0001). Figure 4 depicts the results for the optic radiation. Similar to the optic tract, we did not find significant differences in FA in Experiment 1 (left, d’ = 0.11, P = 0.08; right, d’ = 0.09; P = 0.09), while we found that SMS rsEPI data had higher FA in Experiment 2 (left, d’ = 0.55, P < 0.0001; right, d’ = 0.52, P < 0.0001).Discussion
We found that SMS rsEPI data have better image quality and higher FA in the optic nerve than SMS ssEPI data. This result was replicated in two experiments. Since the optic nerve is composed of myelinated axons with a relatively uniform fiber orientation, a higher FA may suggest higher dMRI signal quality in SMS rsEPI in this tract. In contrast, in the optic tract and the optic radiation, we only found a significant difference in Experiment 2, in which longer echo time required for high b-value acquisition may increase susceptibility-induced artifacts in SMS ssEPI. While we observed significantly higher FA in these tracts in Experiment 2, the effect sizes were smaller than those in the optic nerve, suggesting that SMS rsEPI may have limited advantage in dMRI measurements along these tracts, presumably because they are less affected by susceptibility-induced artifacts.Conclusion
This study demonstrates that while SMS rsEPI may not have advantages in all situations, it has a clear advantage in dMRI measurements of the human optic nerve over conventional SMS ssEPI. Therefore, this study opens an avenue to apply SMS rsEPI in evaluating the tissue properties of the optic nerve as a consequence of retinal disorders.Acknowledgements
We thank Yusuke Sakai in support of data acquisition and analysis. This work is supported by Japan Society for the Promotion of Science (JSPS) KAKENHI (JP17H04684, H.T.).References
- Raz N, Levin N. Cortical and white matter mapping in the visual system-more than meets the eye: on the importance of functional imaging to understand visual system pathologies. Front. Integr. Neurosci. 2014; 8:68.
- Takemura H, Ogawa S, Mezer AA, et al. Diffusivity and quantitative T1 profile of human visual white matter tracts after retinal ganglion cell damage. Neuroimage Clin. 2019; 23:101826.
- Porter DA, Heidemann RM. High resolution diffusion-weighted imaging using readout-segmented echo-planar imaging, parallel imaging and a two-dimensional navigator-based reacquisition. Magn Res Med. 2009; 62:468–475.
- Kida I, Ueguchi T, Matsuoka Y, et al. Comparison of Diffusion-Weighted Imaging in the Human Brain Using Readout-Segmented EPI and PROPELLER Turbo Spin Echo With Single-Shot EPI at 7 T MRI. Invest. Radiol. 2016; 51:435–439.
- Frost R, Jezzard P, Douaud G, et al. Scan time reduction for readout-segmented EPI using simultaneous multislice acceleration: Diffusion-weighted imaging at 3 and 7 Tesla. Magn. Reson. Med. 2015; 74:136–149.
- Andersson JLR, Skare S, Ashburner J. How to correct susceptibility distortions in spin-echo echo-planar images: application to diffusion tensor imaging. Neuroimage 2003; 20:870–888.
- Andersson JLR, Sotiropoulos SN. An integrated approach to correction for off-resonance effects and subject movement in diffusion MR imaging. Neuroimage 2016;125:1063–1078.
- Basser PJ, Pierpaoli C. Microstructural and physiological features of tissues elucidated by quantitative-diffusion-tensor MRI. J. Magn. Reson. B 1996;111: 209–219.
- Chang L-C, Jones DK, Pierpaoli C. RESTORE: robust estimation of tensors by outlier rejection. Magn. Reson. Med. 2005;53:1088–1095.
- Tournier J-D, Smith R, Raffelt D, et al. MRtrix3: A fast, flexible and open software framework for medical image processing and visualisation. Neuroimage 2019;202:116137.
- Miller N, Liu Y, Krivochenitser R, Rokers B. Linking neural and clinical measures of glaucoma with diffusion magnetic resonance imaging (dMRI). PLoS One 2019;14: e0217011.
- Sherbondy AJ, Dougherty RF, Ben-Shachar M,et al. ConTrack: finding the most likely pathways between brain regions using diffusion tractography. J. Vis. 2008; 8:15.1–16.
Figures
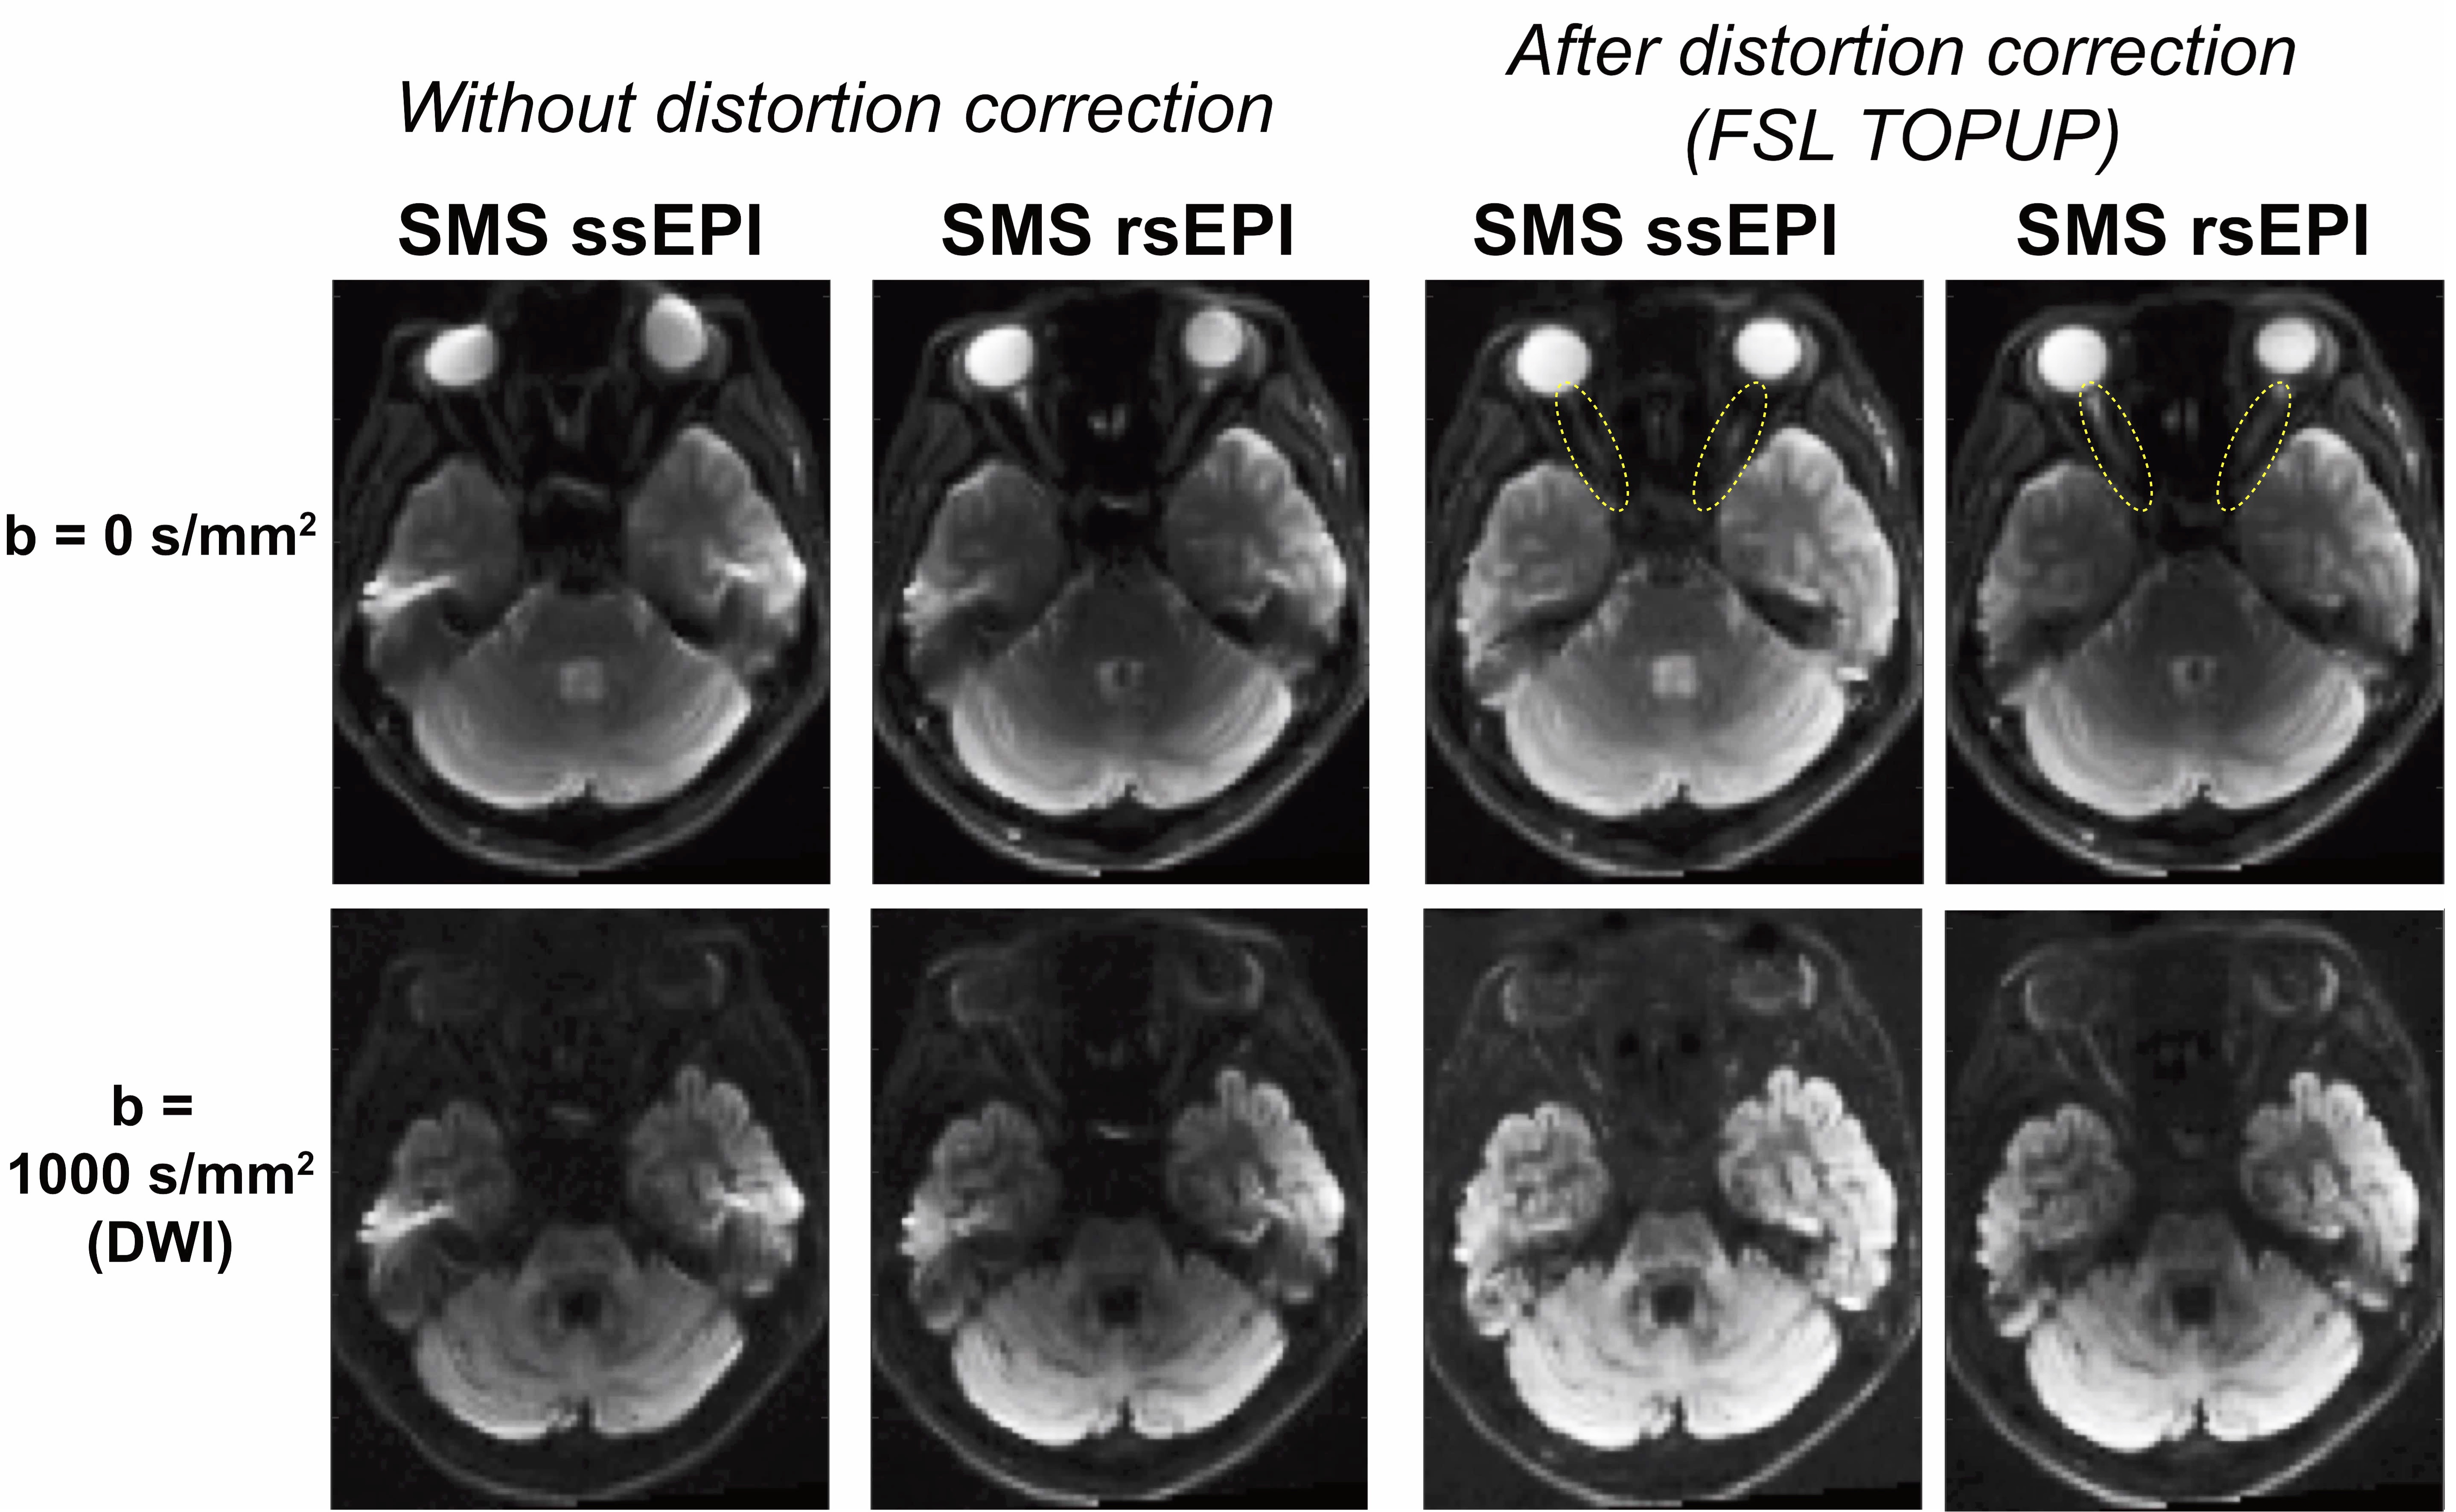
Figure 1. Comparison of dMRI image quality between SMS ssEPI and SMS rsEPI in an axial slice of a representative subject (top, b = 0 s/mm2; bottom, b = 1000 s/mm2). Left: dMRI images without susceptibility-induced distortion correction. Image quality in the optic nerve and near ear cavity is improved by SMS rsEPI. Right: dMRI images after susceptibility-induced distortion correction6. SMS rsEPI data may still have higher image quality along the optic nerve (yellow dotted circles).
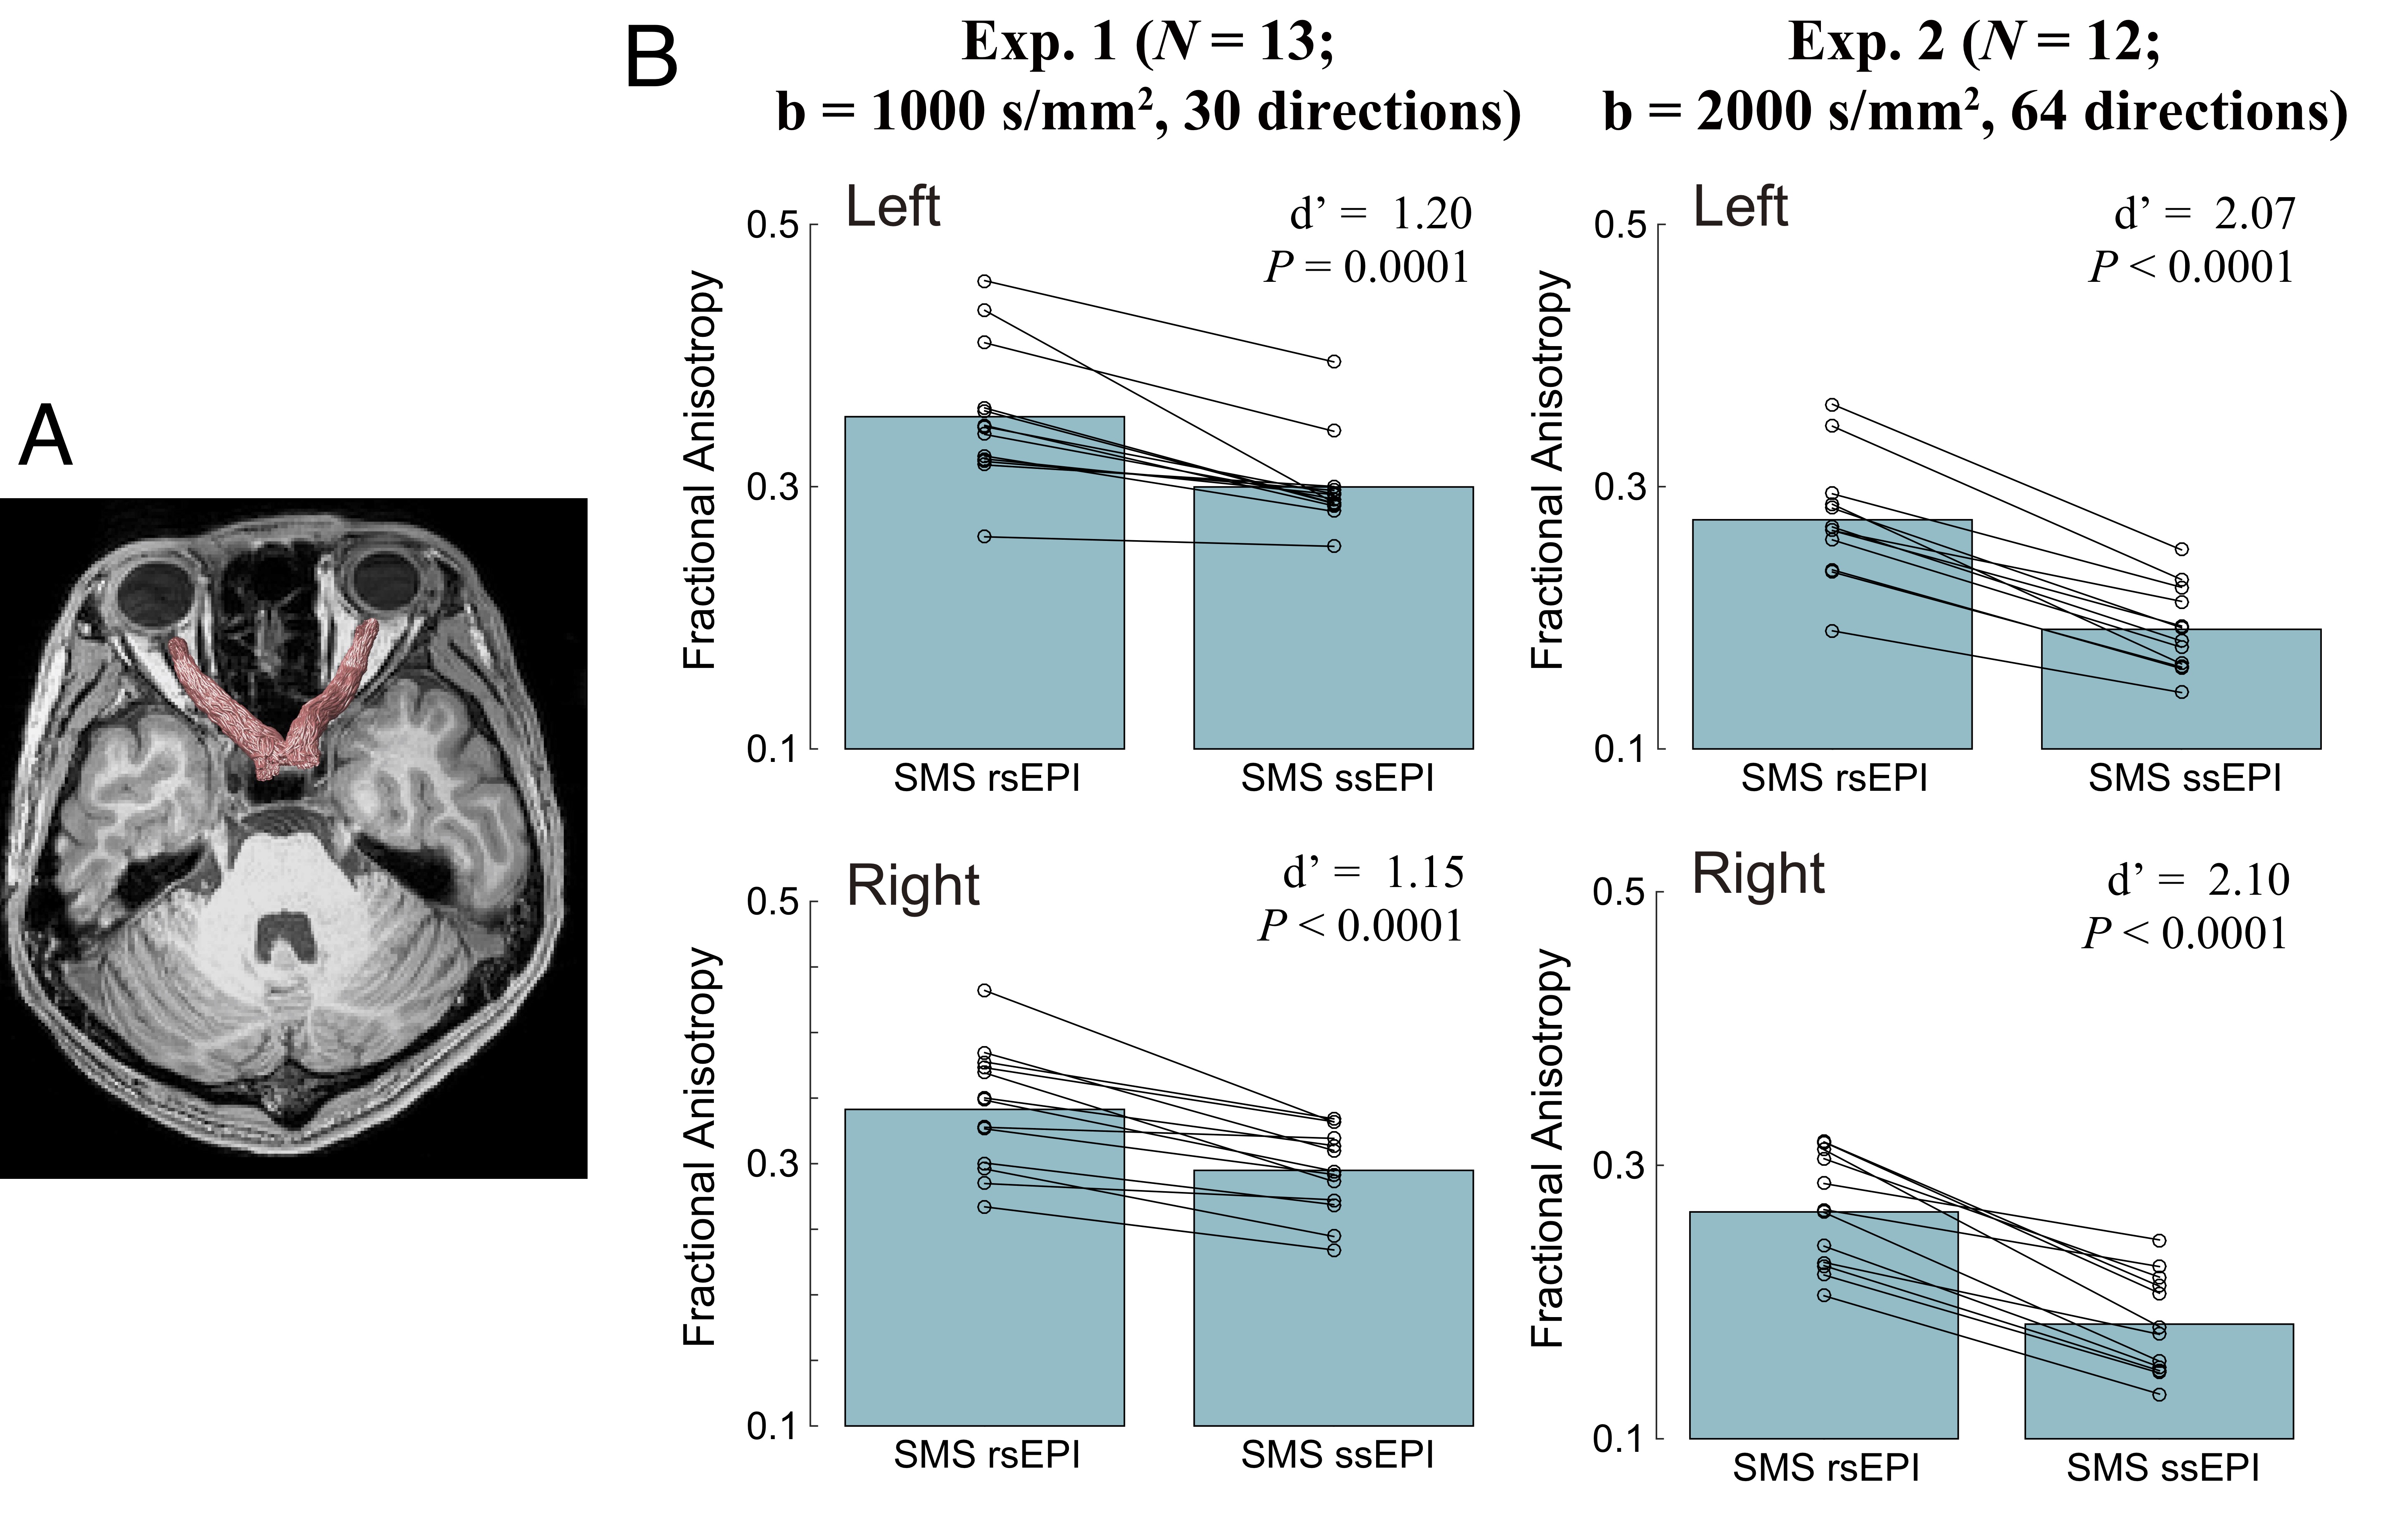
Figure 2. A. Optic nerve identified using tractography in a representative subject. B. Comparison of fractional anisotropy (FA) along the optic nerve between SMS rsEPI and SMS ssEPI data (top, left hemisphere; bottom, right hemisphere). The bar depicts the mean FA across all subjects, whereas dots depict the data from individual subjects. Left: Experiment 1 (number of subjects = 13, b = 1000 s/mm2, 30 directions), Right: Experiment 2 (number of subjects = 12, b = 2000 s/mm2, 64 directions).
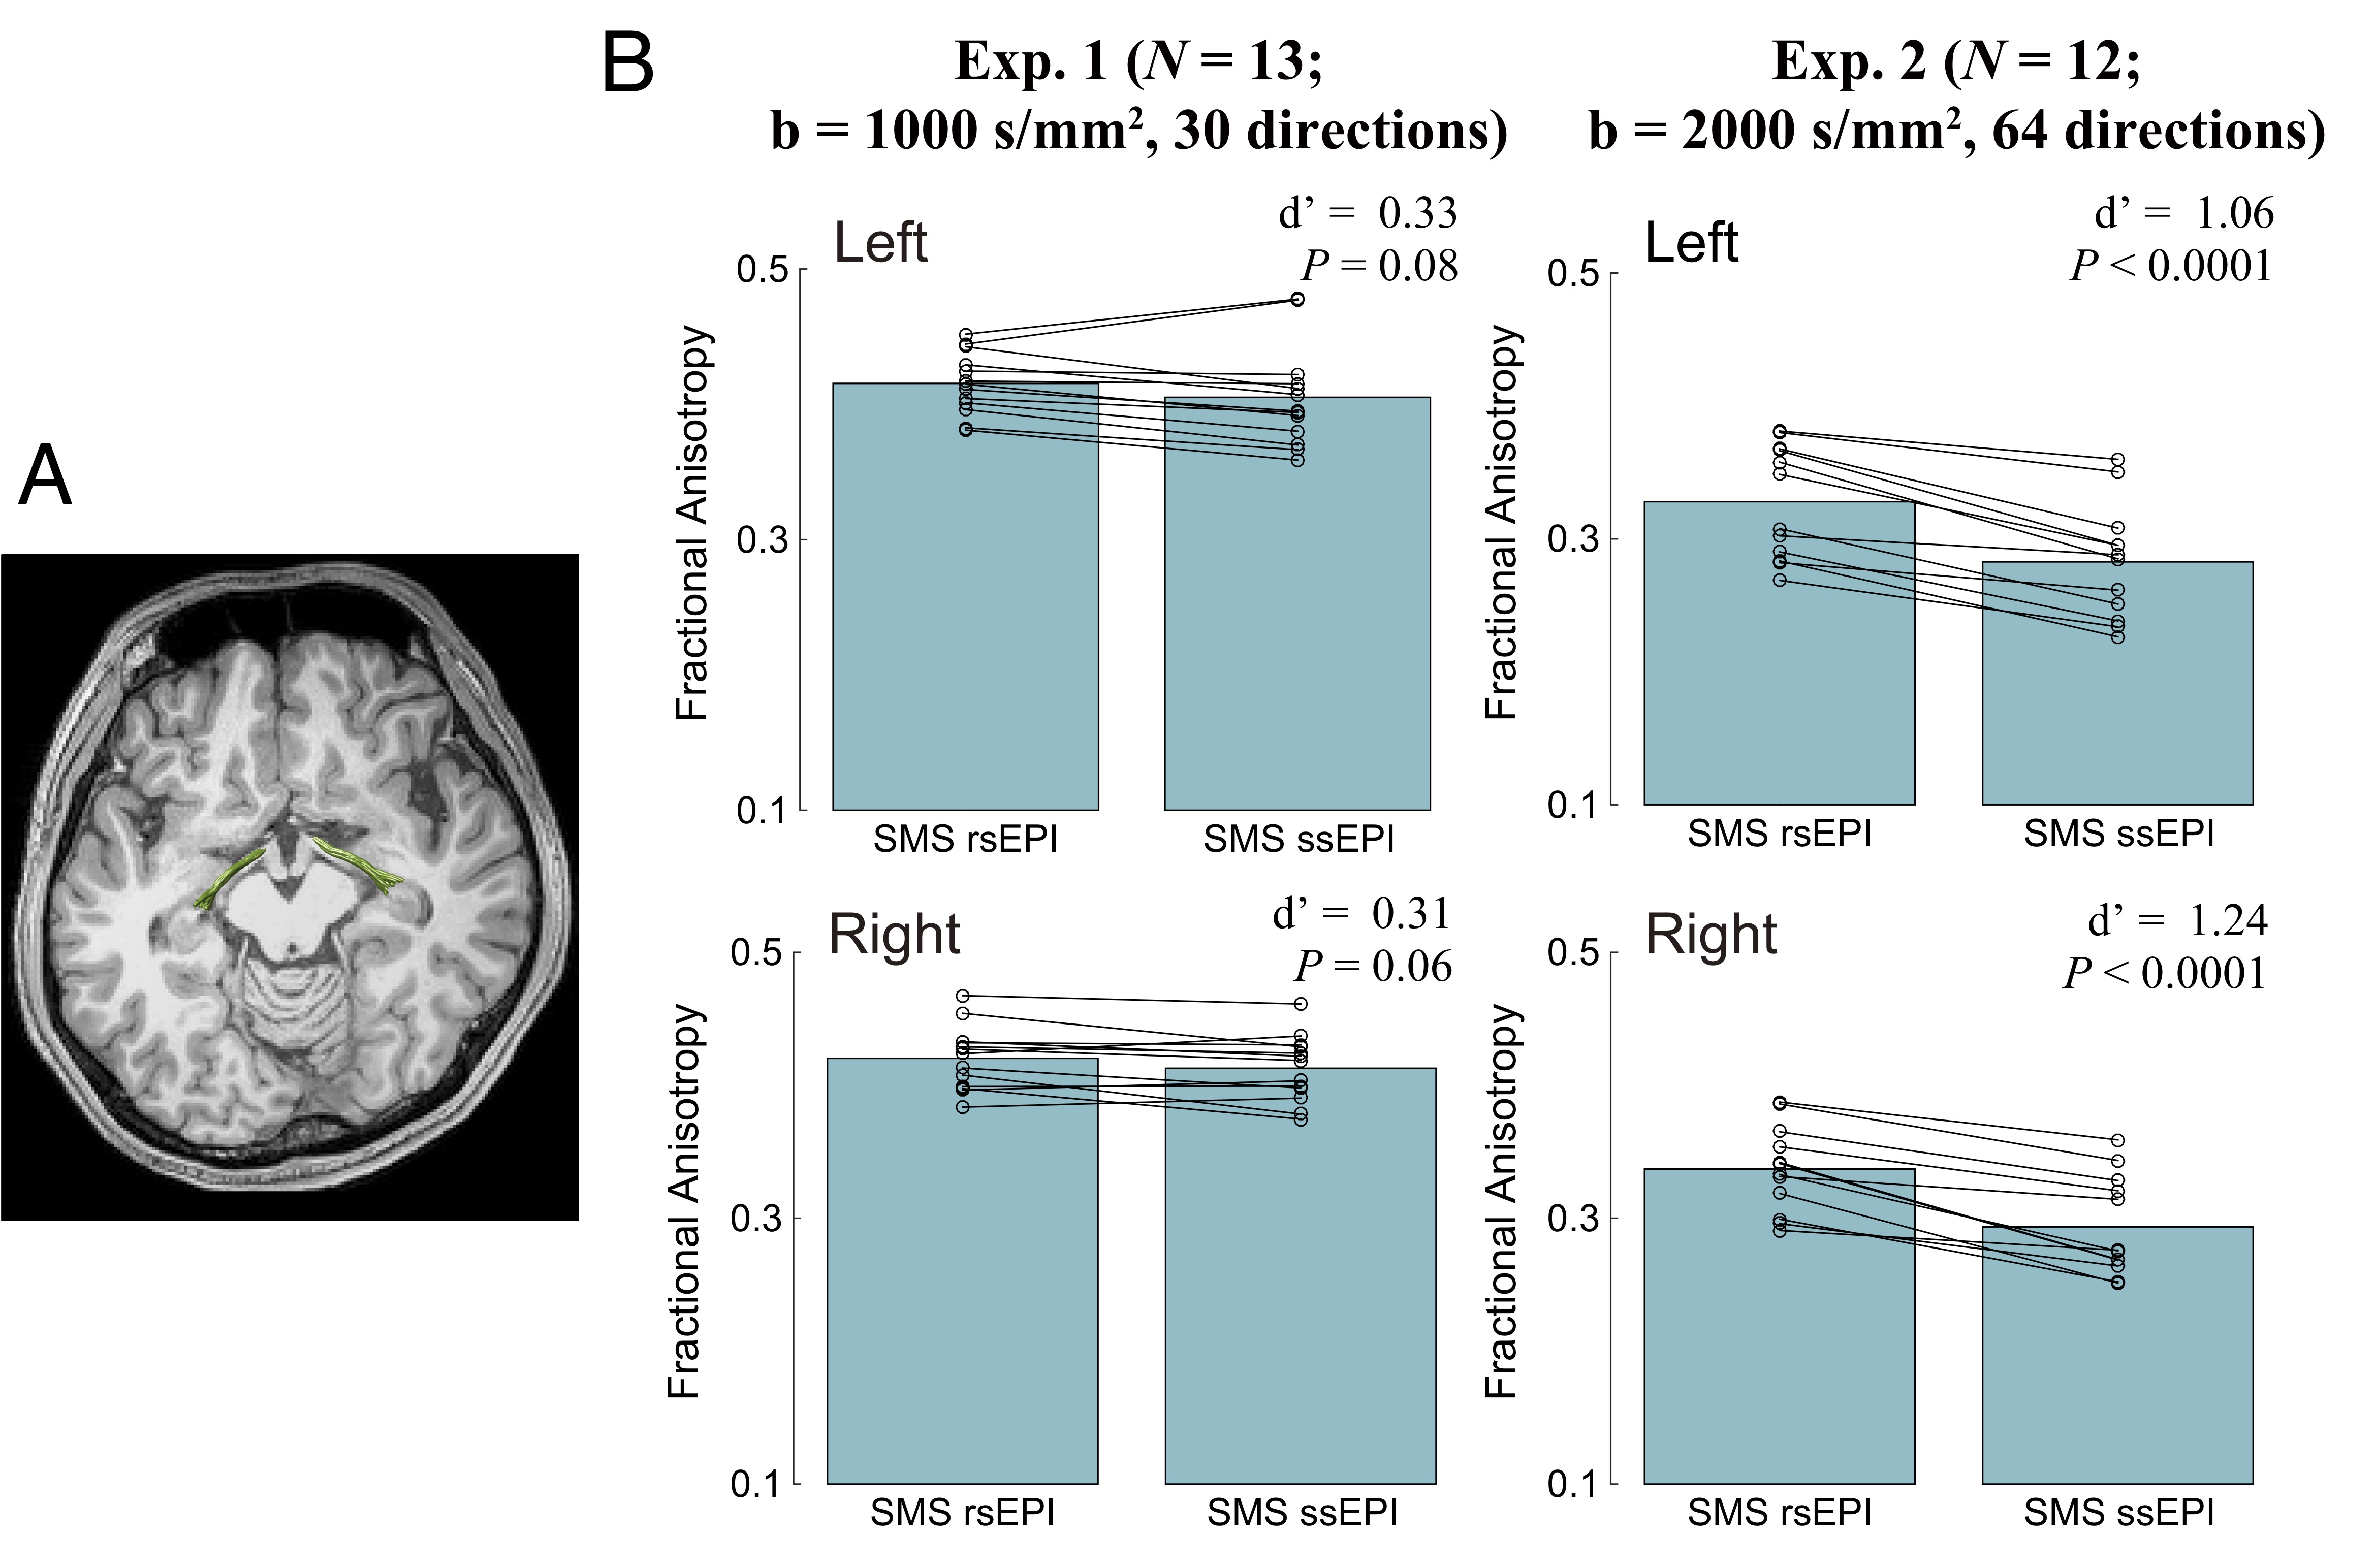
Figure 3. A. Optic tract identified using tractography in a representative subject. B. Comparison of FA along the optic tract between SMS rsEPI and SMS ssEPI data. Conventions are identical to those used in Figure 2.
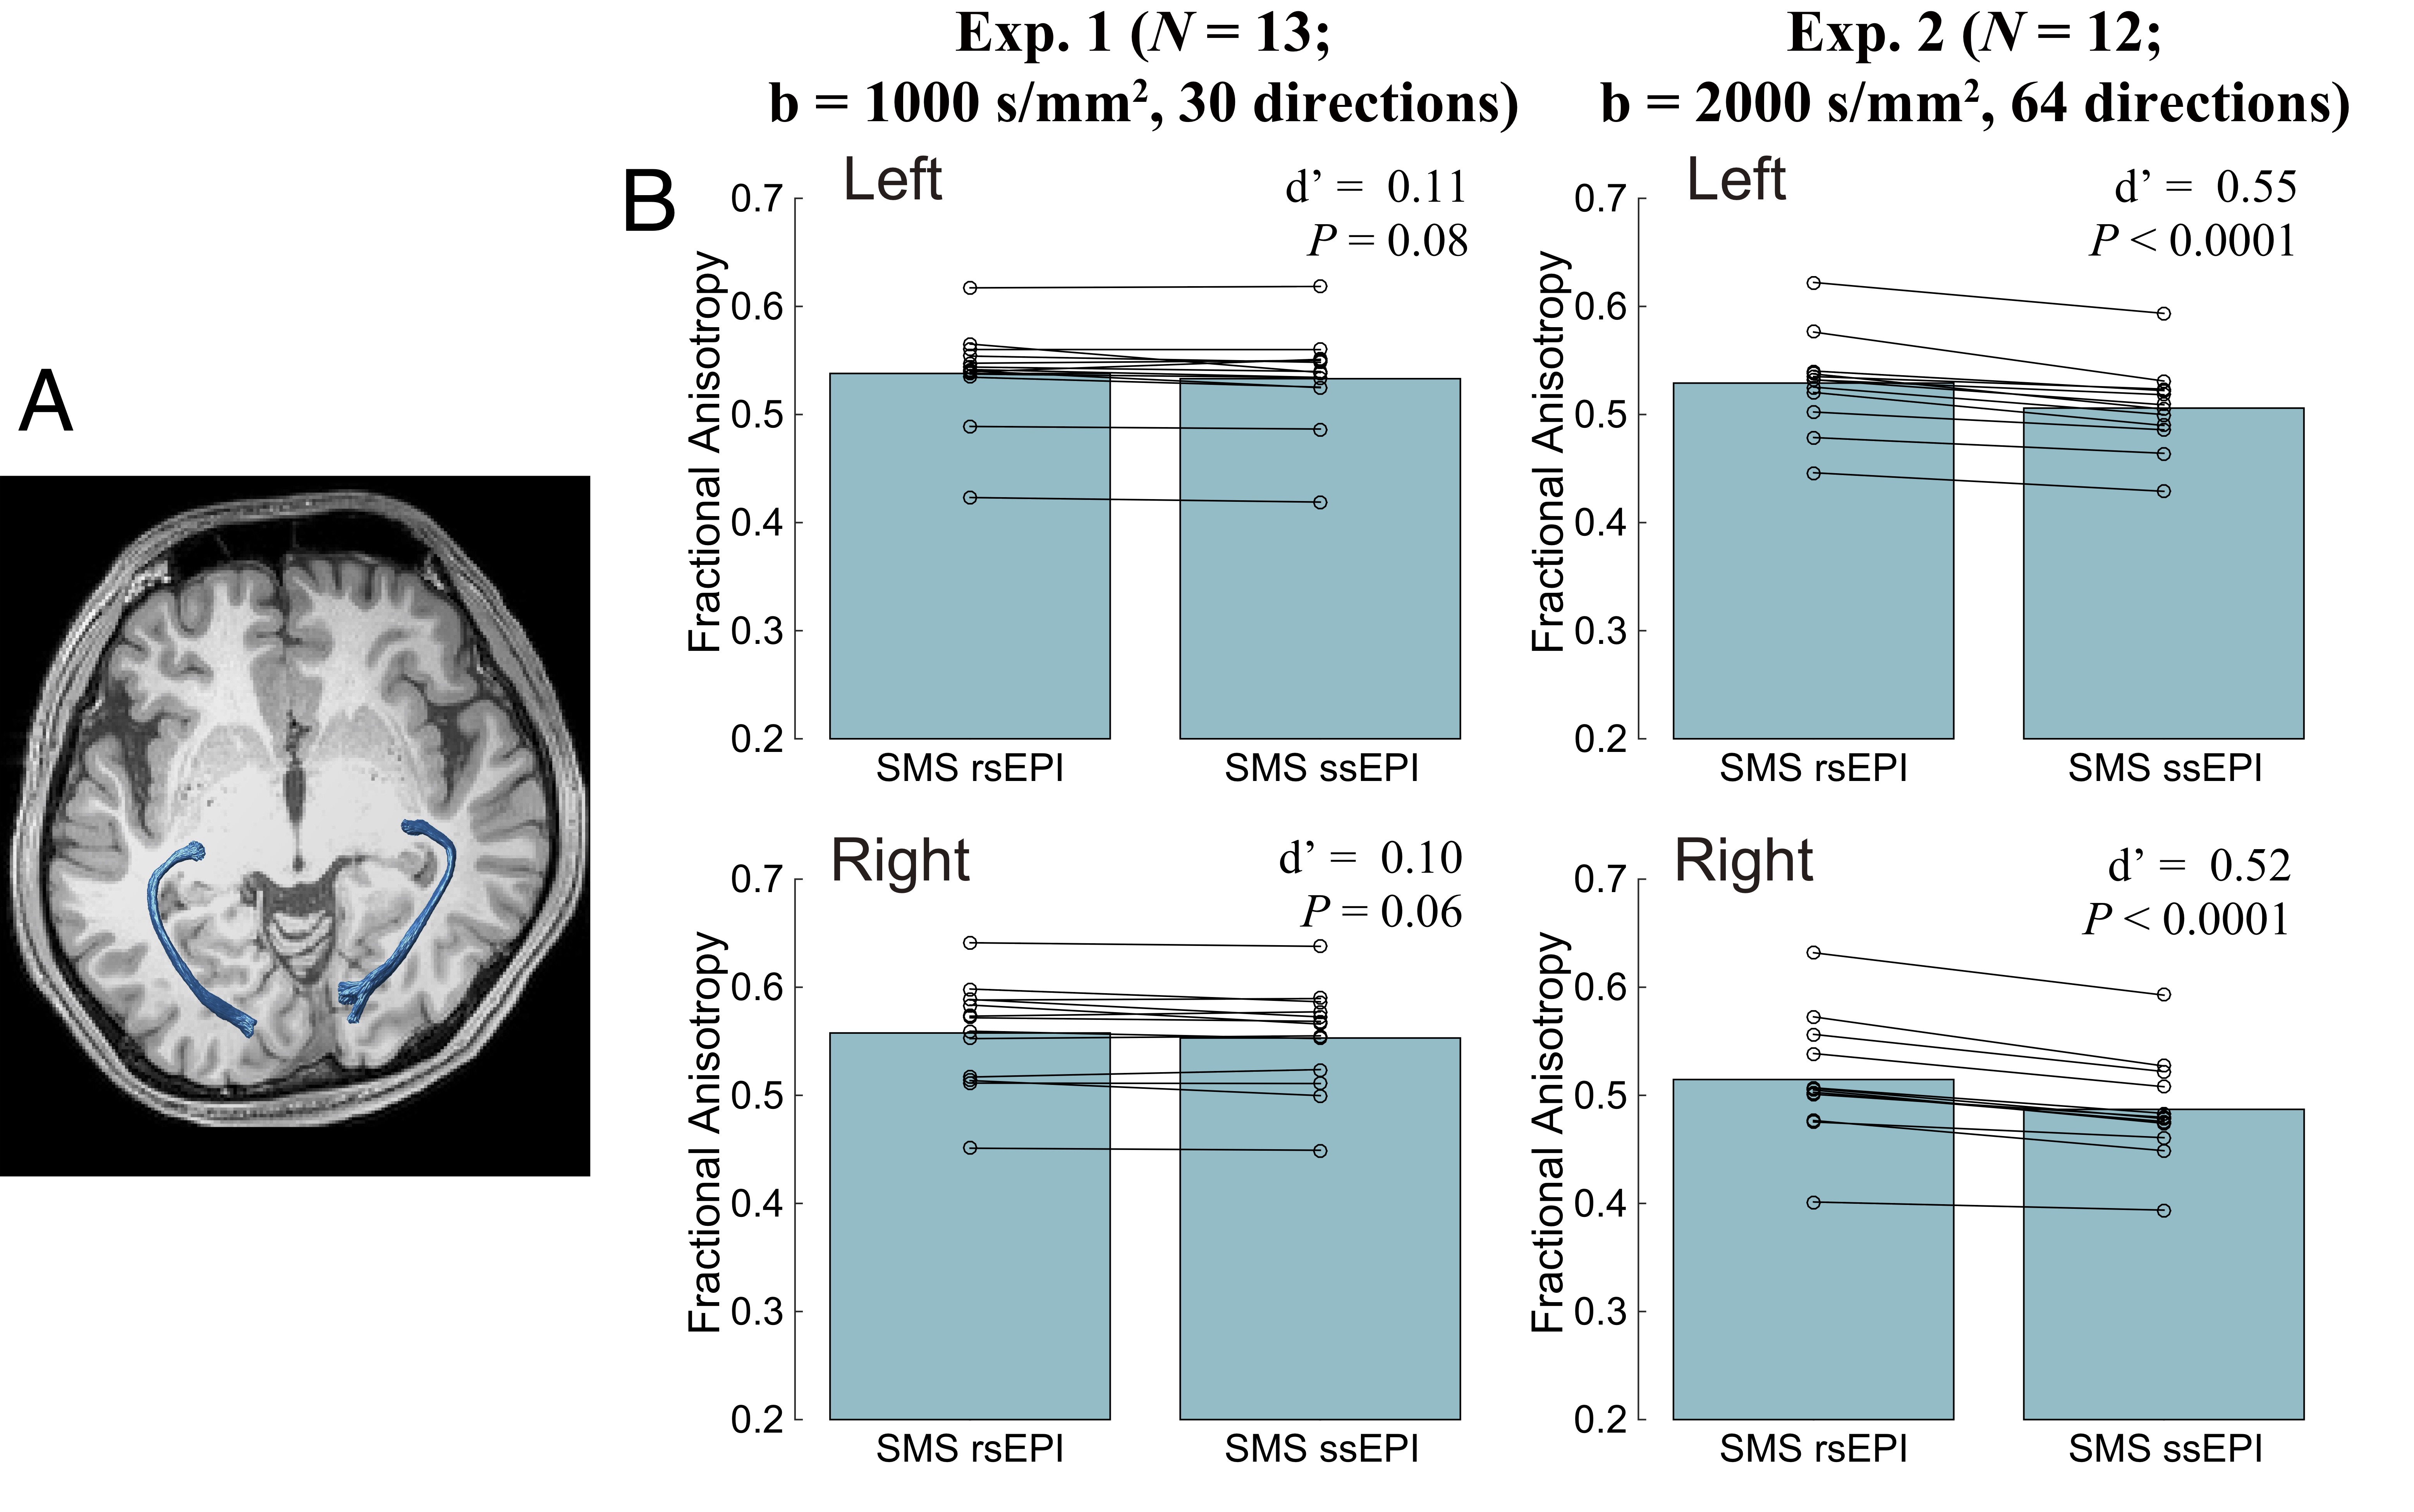
Figure 4. A. Optic radiation identified using tractography in a representative subject. B. Comparison of FA along the optic radiation between SMS rsEPI and SMS ssEPI data. Conventions are identical to those used in Figure 2.