4290
Probabilistic Tractography of the Arcuate Fasciculus: Sensitivity and Specificity of Standardised fMRI and Atlas-based Approaches1King's College London, London, United Kingdom, 2Department of Neuroradiology, King's College Hospital, London, United Kingdom, 3Computer Assisted Clinical Medicine, Medical Faculty Mannheim, Heidelberg University, Mannheim, Germany, 4Department of Medical Physics and Bioengineering, NHS Highland, Inverness, United Kingdom, 5Department of Biomedical Engineering, School of Biomedical Engineering and Imagine Sciences, King's College London, London, United Kingdom
Synopsis
Atlas and fMRI-based approaches to standardise seed and end regions for probabilistic tractography of the arcuate fasciculus are investigated. fMRI-based approaches use spheres centered on language task peak activation. Within this pilot cohort, an atlas-based approach demonstrates the greatest sensitivity. fMRI-based approaches are more specific, but sensitivity can be increased by enlarging sphere size. Within each approach, a trade-off between sensitivity and specificity is seen as seed/end region size increases. For patients with abnormalities or lesions, where atlas approaches might be compromised, fMRI methods may be preferred. Further work to optimise fMRI-based approach is warranted, alongside application to patient data.
Introduction
Pre-surgical functional mapping can be used to protect eloquent brain function and optimise the neurosurgical plan. This is particularly relevant when language structures are involved, as they are highly individual specific and can re-organise1. In this area, fMRI and multi-fibre probabilistic tractography are established imaging tools2, but currently there are no widely accepted protocols for clinically feasible and robust image acquisition and post-processing.In this pilot study we investigate the standardisation of arcuate fasciculus (AF) tractography for clinical use, focussing on the definition of the seed and end regions, and evaluating the use of both brain atlases and fMRI data.
Methods
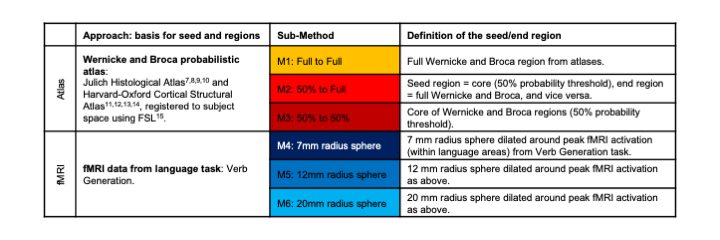
Multi-fibre probabilistic AF tractography was performed in MRTrix33 using data acquired with a DTI SE-EPI sequence (TE/TR = 86/9500ms, voxel size = 2.5mm3, 6 baseline images at b = 0s/mm2 and 64 diffusion directions at b = 1500s/mm2) with 15 healthy right-handed volunteers at 1.5T (Siemens Magnetom Aera, Erlangen, Germany). The iFOD2 tractography algorithm4 was used for the probabilistic streamline tractography, sampling a fibre orientation distribution estimated using constrained spherical deconvolution5.The tractography was implemented with a target of 10,000 acceptable streamlines from a maximum of 10 million seed attempts from within a defined seed region. In each case, acceptable streamlines must reach the defined end region. Two approaches for defining seed and end regions were implemented: an atlas-based approach and fMRI-based6 with three sub-methods trialled within each (see Table 1).
Tractography is run on the dominant left hemisphere from seed to end region and vice-versa, and two tract density images (TDIs) are produced. To reduce spurious streamlines, these two TDIs are combined in a final ‘dual-direction’ TDI image which preserves only voxels that are present in both runs.
For quantitative evaluation, the final TDIs from each method are compared to an independent AF atlas (MegaTrack16 atlas, probability threshold = 0.25, registered to subject space) using FSL and MATLAB R2018b. Sensitivity and specificity are calculated from the overlap of the two binarised maps as follows:
$$Sensitivity=\frac{True.Positives}{(True.Positives+False.Negatives)}\times100$$
$$Specificity=\frac{True.Negatives}{(True.Negatives+False.Positives)}\times100$$
Results
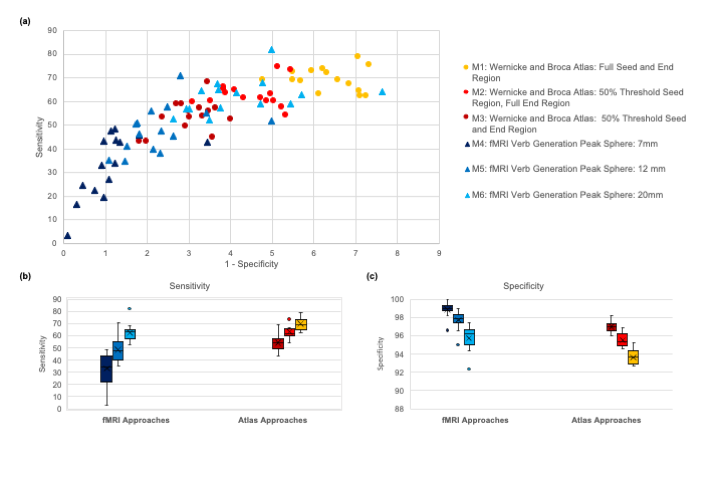
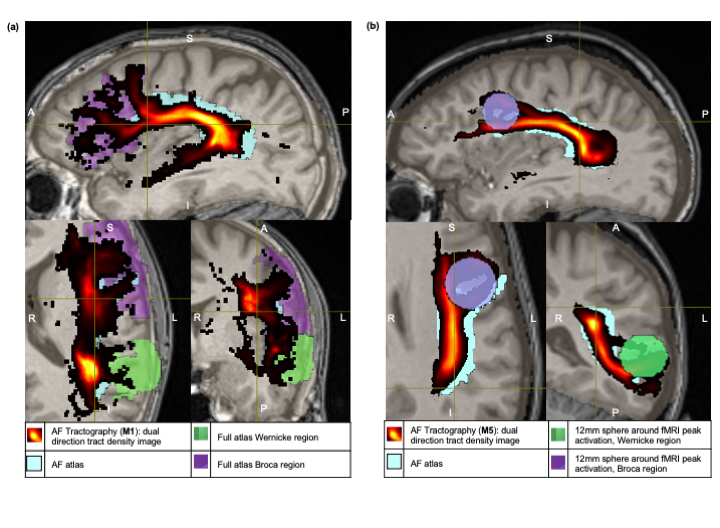
Sensitivity and specificity results for the resulting 90 AF TDIs (6 sub-methods per each of 15 volunteers) are shown in Figure 1. Example AF TDI from an atlas-based (M1) and fMRI-based approach (M5) are shown in Figure 2.Overall, both the atlas-based and fMRI approaches show substantial overlap between the generated tracts and the reference AF atlas (Figure 2), with tracts matching the expected anatomical pathways.
Comparing across sub-methods, there is a trade-off between sensitivity and specificity (Figure 1a), with larger seed/end regions favouring sensitivity over specificity. For example, the fMRI-based 7mm sphere sub-method (M4) has the lowest average sensitivity (33%) but the highest average specificity (99%), while the unthresholded atlas-based sub-method (M1) has the highest average sensitivity (70%) and the lowest specificity (94%). Sensitivity in particular shows a large range of values (Figure 1b).
For each sub-method however, the final 15 subject AFs group in identifiable clusters in terms of sensitivity and specificity (Figure 1a). In particular, the inter-quartile ranges of specificity for sub-methods, within each approach, do not overlap (Figure 1c).
Increasing the size of the spheres (fMRI approaches) or atlas-based regions, is seen to boost the sensitivity of the results although compromises specificity. Using a 12 or 20mm sphere (M5, M6) increases the sensitivity of the fMRI-based approaches to levels comparable with the atlas-based approaches and reduces variability in these results (Figure 1b). However, there is increased variation in specificity across subjects with larger spheres (Figure 1c), although on average specificity remains slightly higher than comparable atlas-based approaches (eg. full atlas sub-method, M1).
Discussion
Within this pilot healthy volunteer cohort, an atlas-based approach using full regions (M1) consistently provides optimal sensitivity with acceptable specificity, and a comprehensive depiction of the AF. However, for patients with morphological abnormalities or large lesions, where brain morphology and atlas registration might be compromised, fMRI approaches with larger spheres may be able to maintain accuracy of the estimated tract due to the more individualised approach.Further work to optimise the fMRI approach in terms of sphere size and use of additional language task data is required. In this work, the use of multiple tasks to define the spheres has been considered. Initial evaluation suggests that activation peaks are spatially close and therefore this aspect has minimal impact on the results, but it will be explored further.
Currently, the binarised reference atlas provides a means to relatively compare TDIs produced using different methods. However, in future evaluation we will aim to compare the population probability distributions directly17. Furthermore, in subsequent validation on patient datasets, intra-operative data will be employed for subject-specific evaluation of the AF tractography.
Conclusion
Our results suggest that both the atlas and fMRI-based approaches have potential for a robust standardised approach to perform AF tractography. Next steps will focus on refining the fMRI approach and the validation techniques, and to extend this work to patient cases.Acknowledgements
This work was carried out at, and supported by, the Department of Neuroradiology at King’s College Hospital NHS Foundation Trust. EDV is supported by the Wellcome EPSRC Centre for Medical Engineering (WT 203148/Z/16/Z). The views expressed are those of the authors and not necessarily those of the NHS, the NIHR or the Department of Health.References
1 Bizzi A. Presurgical Mapping of Verbal Language in Brain Tumors with Functional MR Imaging and MR Tractography. Neuroimaging Clin N Am 2009; 19:573-596.
2 Mormina E, Longo M, Arrigo A, et al. MRI Tractography of Corticospinal Tract and Arcuate Fasciculus in High-Grade Gliomas Performed by Constrained Spherical Deconvolution: Qualitative and Quantitative Analysis. AJNR Am J Neuroradiol 2015, 36:1853-1858.
3 MRTrix3 http://mrtrix.org
4 Tournier J-D, Calamante F, Connelly A. Improved probabilistic streamlines tractography by 2nd order integration over fibre orientation distributions. Proceedings of the International Society for Magnetic Resonance in Medicine 2010
5 Tournier J-D, Calamante F, Connelly A. Robust determination of the fibre orientation distribution in diffusion MRI: Non-negativity constrained super-resolved spherical deconvolution. NeuroImage 35.4 (May 2007).
6 Saur D, Kreher B, Schnell S, et al. Ventral and dorsal pathways for language. Proc Natl Acad Sci U S A 2008,105(46):18035-18040. DOI: https://doi.org/10.1073/pnas.0805234105.
7 Eickhoff SB, Stephan KE, Mohlberg H, Grefkes C, Fink GR, Amunts K, et al. A new SPM toolbox for combining probabilistic cytoarchitectonic maps and functional imaging data. Neuroimage. 2005 May 1;25(4):1325-35.
8 Eickhoff SB, Heim S, Zilles K, Amunts K. Testing anatomically specified hypotheses in functional imaging using cytoarchitectonic maps. Neuroimage. 2006 Aug 15;32(2):570-82.
9 Eickhoff SB, Paus T, Caspers S, Grosbras MH, Evans AC, Zilles K, Amunts K. Assignment of functional activations to probabilistic cytoarchitectonic areas revisited. Neuroimage. 2007 Jul 1;36(3):511-21.
10 Amunts K, Schleicher A, Bürgel U, Mohlberg H, Uylings HB, Zilles K. Broca's region revisited: cytoarchitecture and intersubject variability. Journal of Comparative Neurology. 1999 Sep 20;412(2):319-41.
11 Makris N, Goldstein JM, Kennedy D, Hodge SM, Caviness VS, Faraone SV, et al. Decreased volume of left and total anterior insular lobule in schizophrenia. Schizophr Res. 2006 Apr;83(2-3):155-71.
12 Frazier JA, Chiu S, Breeze JL, Makris N, Lange N, Kennedy DN, et al. Structural brain magnetic resonance imaging of limbic and thalamic volumes in pediatric bipolar disorder. Am J Psychiatry. 2005 Jul;162(7):1256-65.
13 Desikan RS, Ségonne F, Fischl B, Quinn BT, Dickerson BC, Blacker D, et al. An automated labeling system for subdividing the human cerebral cortex on MRI scans into gyral based regions of interest. Neuroimage. 2006 Jul 1;31(3):968-80.
14 Goldstein JM, Seidman LJ, Makris N, Ahern T, O'Brien LM, Caviness VS Jr, et al. Hypothalamic abnormalities in schizophrenia: sex effects and genetic vulnerability. Biol Psychiatry. 2007 Apr 15;61(8):935-45.
15 M. Jenkinson, C.F. Beckmann, T.E. Behrens, M.W. Woolrich, S.M. Smith. FSL. NeuroImage, 62:782-90, 2012
16 Mega Track Atlas https://megatrackatlas.org
17 Ashmore J, Pemberton HG, Crum WD, Jarosz J, Barker GJ (2020) Implementation of clinical tractography for pre-surgical planning of space occupying lesions: An investigation of common acquisition and post-processing methods compared to dissection studies. PLoS ONE 15(4): e0231440.
Figures