4289
On false positive control in Fixel-Based Analysis1Florey Institute of Neuroscience & Mental Health, Melbourne, Australia, 2Florey Department of Neuroscience and Mental Health, The University of Melbourne, Melbourne, Australia, 3School of Biomedical Engineering & Imaging Sciences, King's College London, London, United Kingdom, 4Department of Electrical Engineering, KU Leuven, Leuven, Belgium, 5Department of Physics, University of Antwerp, Antwerp, Belgium, 6Department of Neurology, Austin Health, Melbourne, Australia
Synopsis
While the Fixel-Based Analysis (FBA) framework provides familywise error control across a whole-brain template accounting for the presence of crossing fibres in the white matter, its typical usage fails to correct for multiple hypothesis tests due to the utilisation of multiple quantitative metrics. We demonstrate different methods that can be employed to provide more comprehensive false positive control in this context.
Introduction
Fixel-Based Analysis (FBA) enables whole-brain statistical inference of white matter quantitative measures in a manner tailored to the complex fibre geometry of the brain white matter1. Familywise error (FWE) corrected p-values are provided using nonparametric permutation testing2. This multiple comparison correction however occurs only across fixels within the brain template ("weak" FWE), not across multiple hypothesis tests ("strong" FWE)3. This may be considered especially problematic for FBA given that within the recommended pipeline, there are three separate quantitative measures tested1. The likelihood of reporting at least one false positive across the experiment is therefore elevated above the intended 5% level even in the most basic experimental case. Here, we evaluate options for providing holistic experimental false positive control specifically in the context of FBA.Methods
Within the recommended FBA pipeline, there are three quantitative measures tested for statistical significance1 for any given effect of interest:- Fibre Density (FD), reflecting microscopic intra-axonal volume;
- Fibre bundle Cross-section (FC), reflecting macroscopic morphological changes orthogonal to bundle orientation;
- Fibre Density and bundle Cross-section (FDC), reflecting the overall capacity of the WM to relay information.
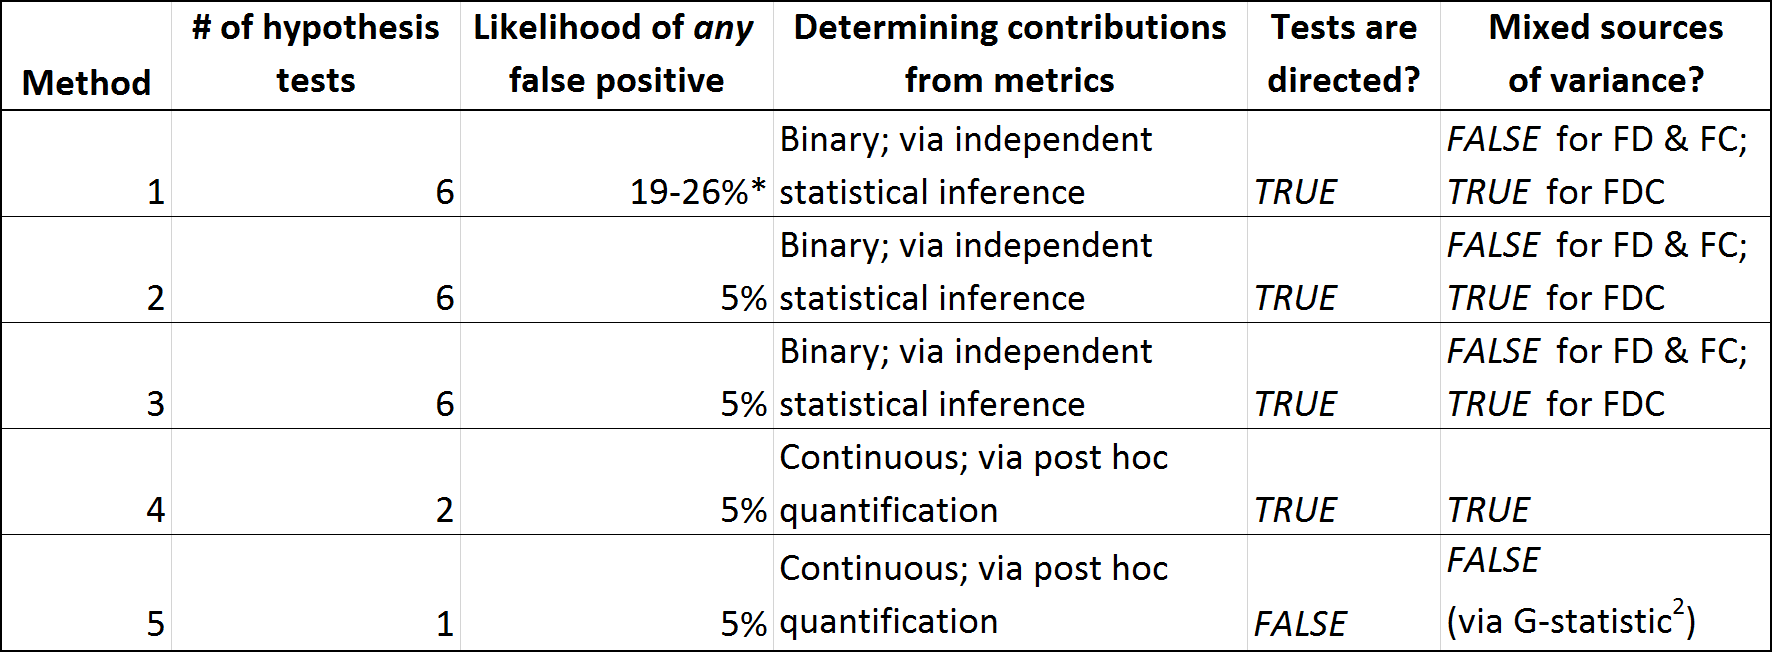
We consider the following multiple hypothesis correction strategies within the context of a basic unpaired t-test (e.g., a group comparison between patients and controls), testing for significant group differences in either direction (see Figure 1 for contrasts in attributes of these methods):
- Historical advice for FBA, i.e. independent testing of each variable for each direction, with independent false positive control not corrected across hypotheses;
- Bonferroni correction across both three metrics and two directions of effect (revise thresholding to p < 0.05/6);
- Non-parametric strong familywise error control by using a single null distribution across all three metrics (with requisite restricted exchangeability and heteroscedasticity considerations2) and both directions of effect3;
- Statistical inference performed on FDC only, with strong FWE control across the two directions of testing3, with post hoc quantification of relative contributions from FD and FC toward the result4;
- F-test2 across FD and (log-transformed1) FC (with requisite restricted exchangeability and heteroscedasticity considerations2), with post hoc investigation of both responsible metrics and directions of effects.
Results
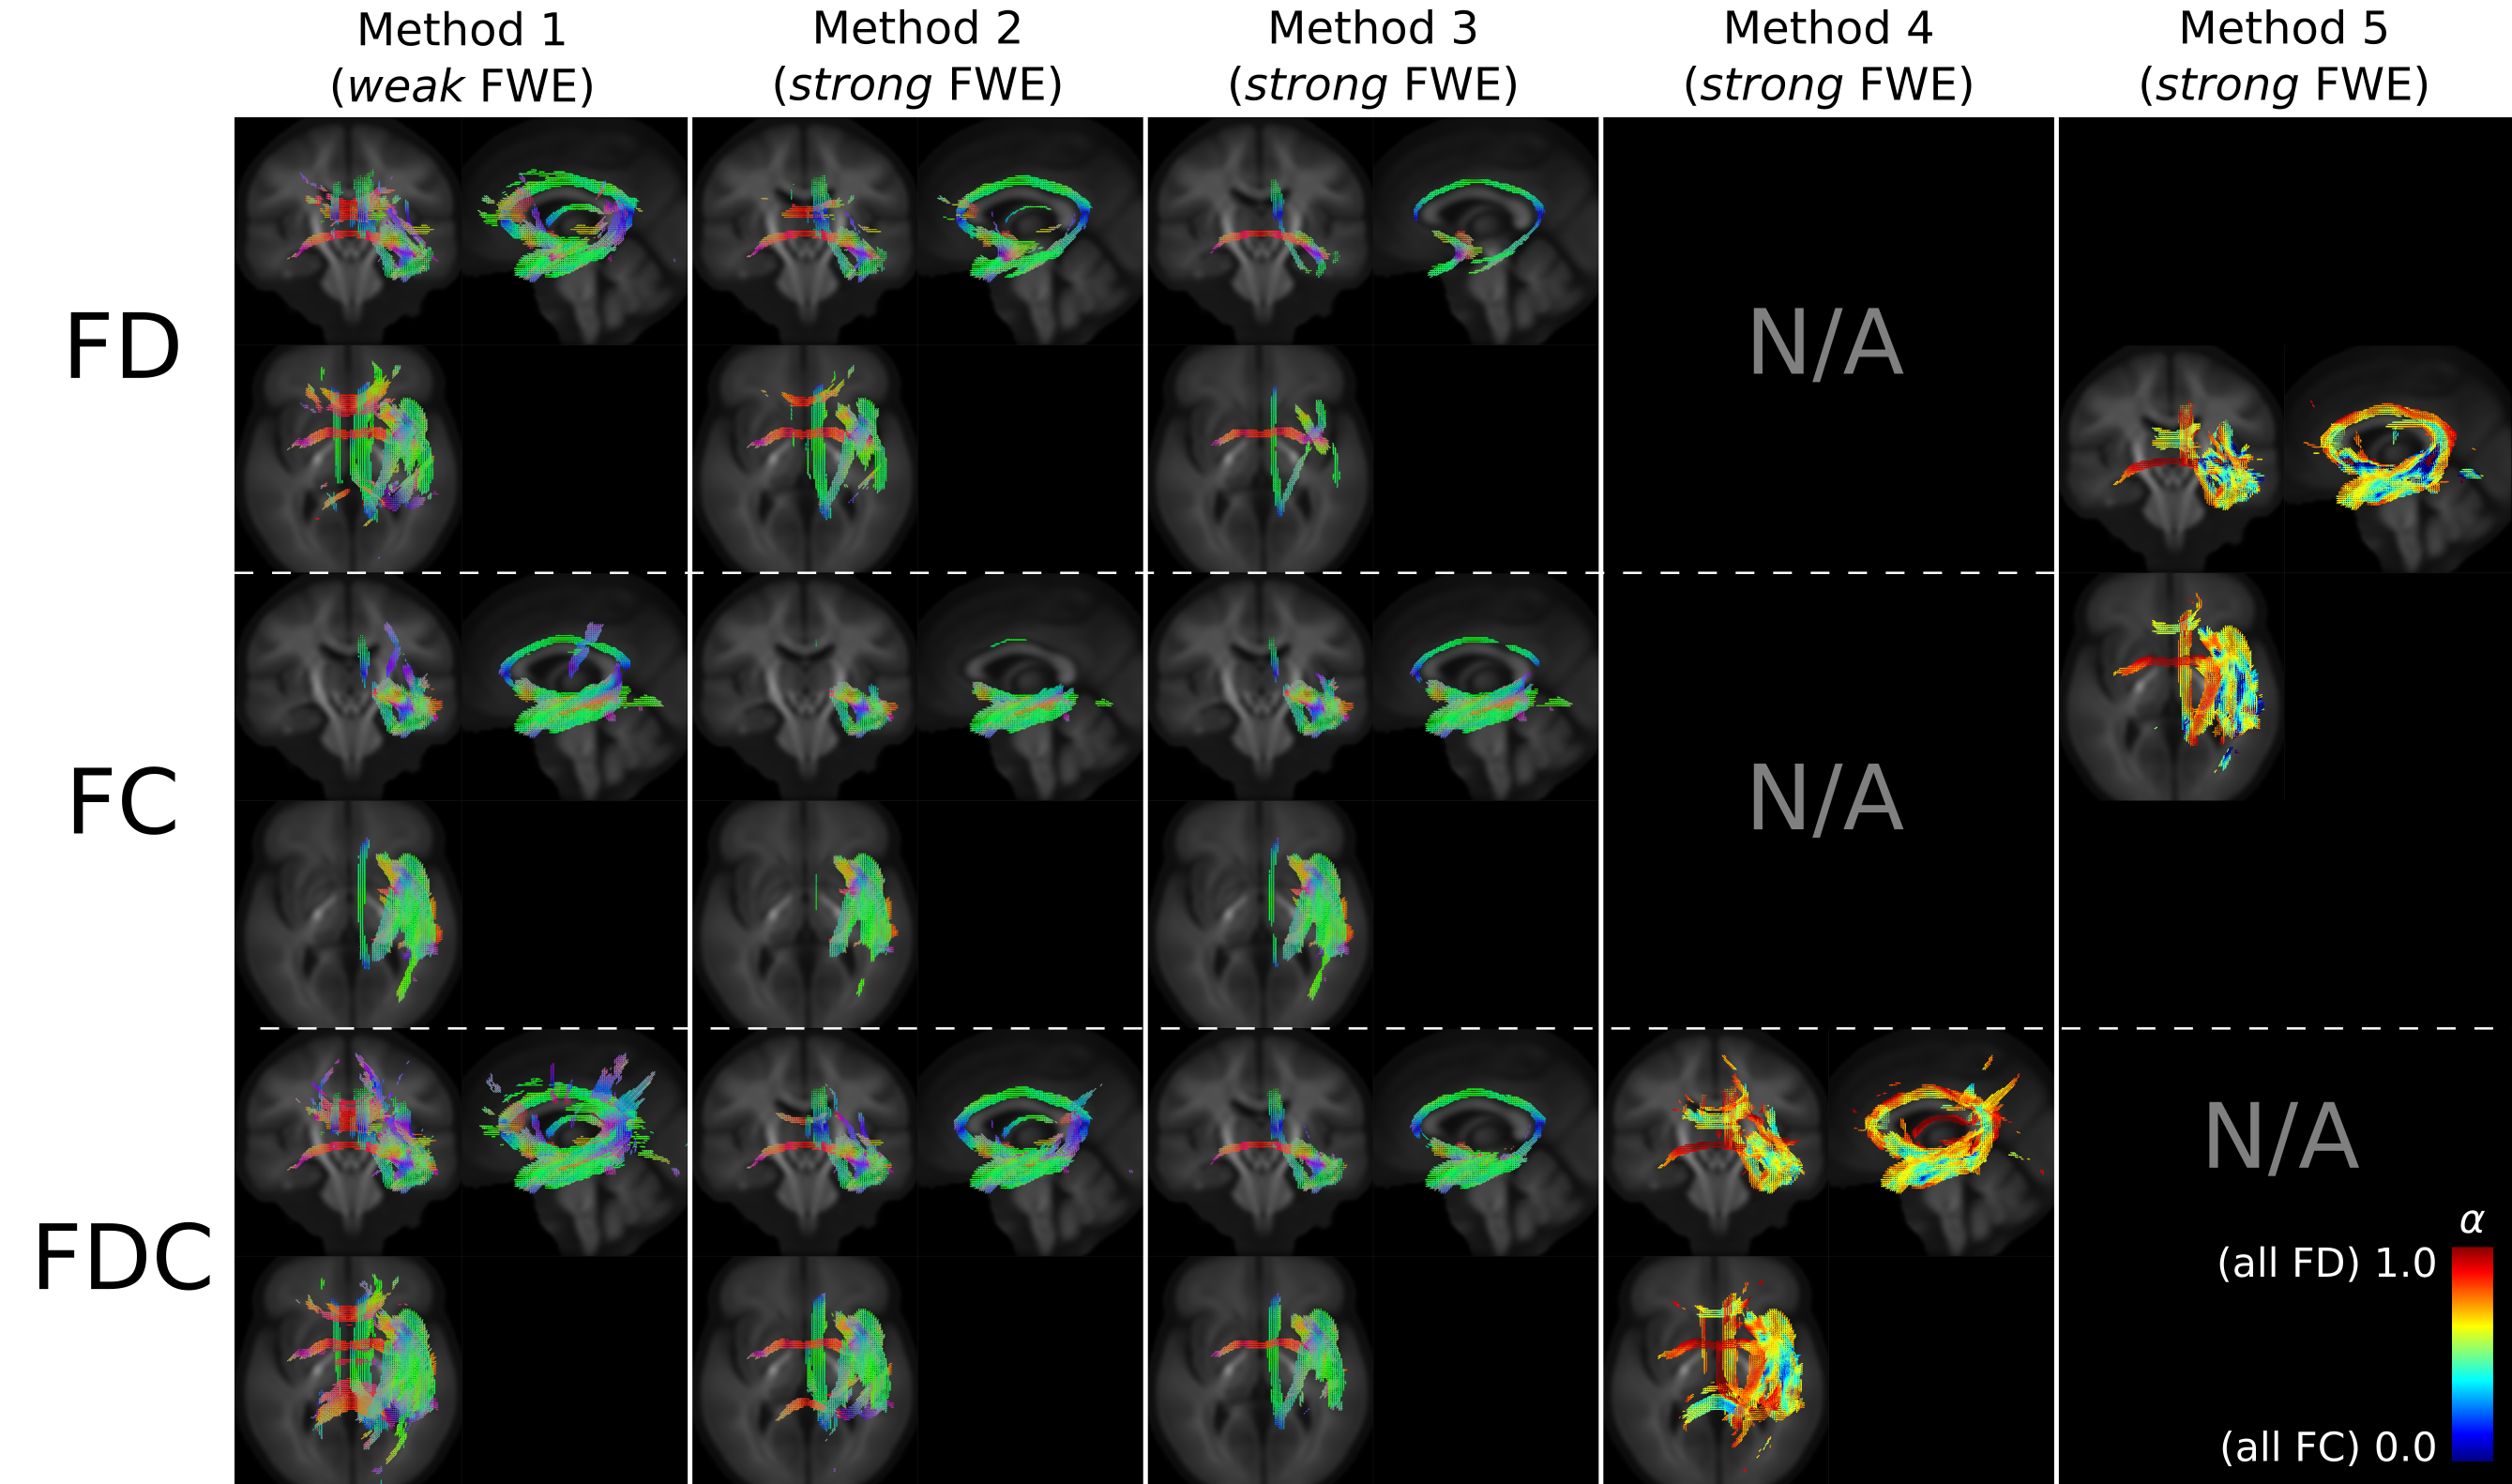
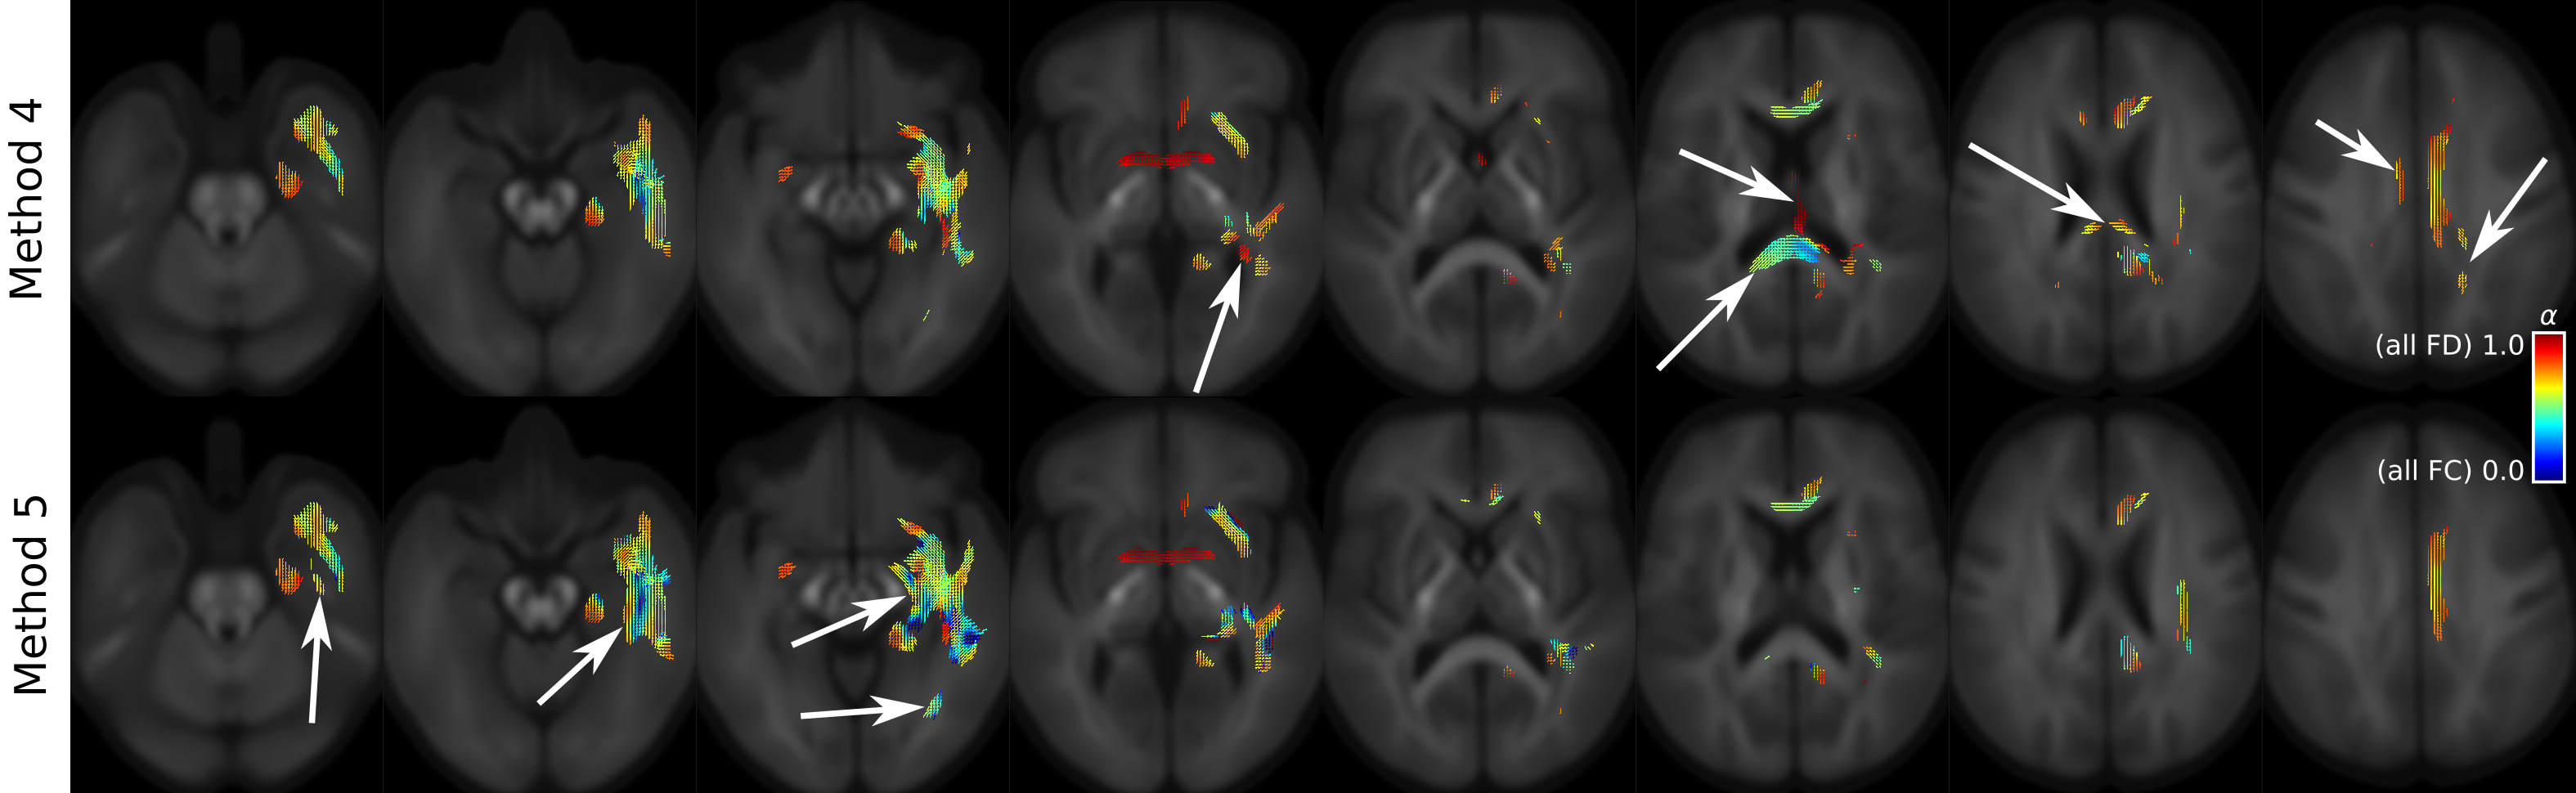
Figure 2 demonstrates the implications of a priori choice of multiple comparison control method on a previously published Temporal Lobe Epilepsy (TLE) cohort5 (results for TLE < control shown only). Methods 2-5 all exhibit reduced spatial extent of statistical significance compared to Method 1, owing to the more rigorous false positive control mechanisms employed. Methods 4 and 5 yield results for which the extent of statistical significance is maximal under strong FWE control, though notably results do vary considerably between the two methods (Figure 3).Discussion
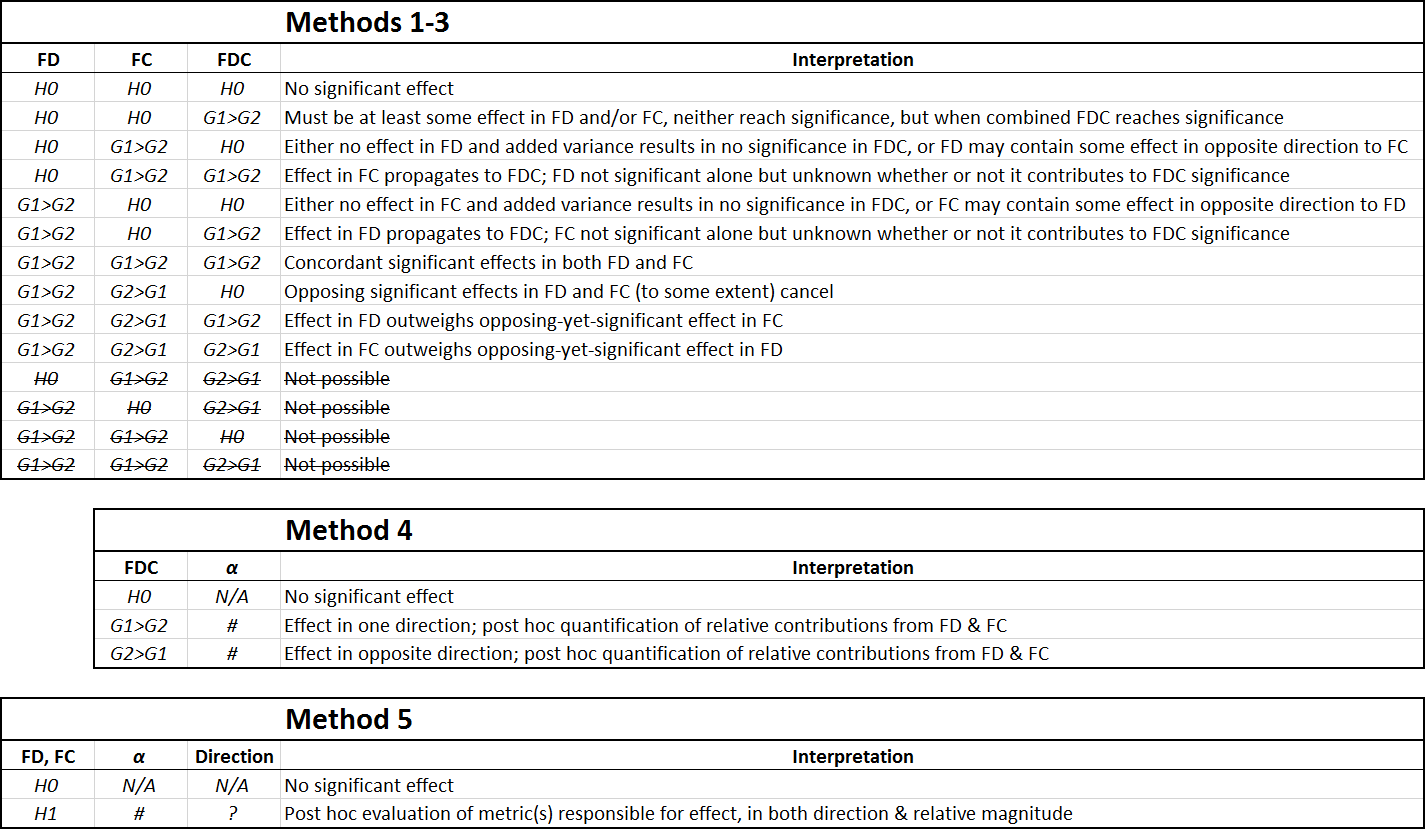
While it is possible to condense a basic group comparison FBA to a single hypothesis test (per direction in the case of Method 4)—with post hoc interrogation of contributions toward statistically significant results—both methods suggested for doing so present complications:- Method 4 intrinsically mixes sources of variance from FD and FC in the calculation of FDC, and may therefore suffer from reduced sensitivity to genuine effects present in one metric if, within a particular dataset, the other metric contributes substantial variance;
- Method 5 is not directed in group effect nor does it require contributions from FD and FC to be in the same direction. In cases where FD and FC exhibit effects in opposing directions, Method 5 may uniquely yield a statistically significant result, reflecting "a change in the white matter" (i.e. F-test) that would not necessarily affect "the white matter's ability to relay information" (i.e. the FDC metric).
Conclusion
Good scientific practice requires holistic experimental false positive control. We have shown that in the context of FBA there are two viable alternatives to address the conflict between this expectation and the presence of three standard FBA quantitative metrics; moreover, utilisation of one of these methods improves not only robustness against experimental false positives but also the interpretability of results. While we tentatively suggest use of Method 4 with FBA ongoing due to its implication of a greater total number of WM bundles in this instance (despite Method 5 implicating a greater volume of the ipsilateral temporal lobe), further validation on a wider range of retrospective FBA cohorts is necessary to ensure generality of this recommendation.Acknowledgements
RS, DV and GJ are grateful to the National Health and Medical Research Council (NHMRC) of Australia, and the Victorian Government's Operational Infrastructure Support Program for their support.
RS is supported by fellowship funding from the National Imaging Facility (NIF), an Australian Government National Collaborative Research Infrastructure Strategy (NCRIS) capability.
DC is supported by the Flemish Research Foundation (FWO; grant number 12ZV420N).
MP is funded in part by the Bill & Melinda Gates Foundation (INV-005774).
JDT is supported by ERC grant agreement no. 319456 (dHCP project), by core funding from the Wellcome/EPSRC Centre for Medical Engineering [WT203148/Z/16/Z] and by the National Institute for Health Research (NIHR) Biomedical Research Centre based at Guy’s and St Thomas’ NHS Foundation Trust and King’s College London and/or the NIHR Clinical Research Facility. The views expressed are those of the author(s) and not necessarily those of the NHS, the NIHR or the Department of Health and Social Care.
References
- Raffelt, David A., J.-Donald Tournier, Robert E. Smith, David N. Vaughan, Graeme Jackson, Gerard R. Ridgway, and Alan Connelly. “Investigating White Matter Fibre Density and Morphology Using Fixel-Based Analysis.” NeuroImage 144 (January 2017): 58–73.
- Winkler, Anderson M., Gerard R. Ridgway, Matthew A. Webster, Stephen M. Smith, and Thomas E. Nichols. “Permutation Inference for the General Linear Model.” NeuroImage 92 (May 2014): 381–397.
- Alberton, Bianca A. V., Thomas E. Nichols, Humberto R. Gamba, and Anderson M. Winkler. “Multiple Testing Correction over Contrasts for Brain Imaging.” NeuroImage 216 (August 1, 2020): 116760. https://doi.org/10.1016/j.neuroimage.2020.116760.
- Arun, Arush Honnedevasthana, Alan Connelly, Fernando Calamante, and Robert E. Smith. “Characterization of White Matter Asymmetries in the Healthy Human Brain Using Diffusion MRI Fixel-Based Analysis.” NeuroImage, November 2, 2020, 117505. https://doi.org/10.1016/j.neuroimage.2020.117505.
- Vaughan, David N., David Raffelt, Evan Curwood, Meng-Han Tsai, Jacques-Donald Tournier, Alan Connelly, and Graeme D. Jackson. “Tract-Specific Atrophy in Focal Epilepsy: Disease, Genetics, or Seizures?” Annals of Neurology 81, no. 2 (February 2017): 240–50. https://doi.org/10.1002/ana.24848.
Figures