4287
Group Average Tractography of the Human Brain using Direct Streamline Mapping1Center for Biomedical Imaging, Dept. of Radiology, New York University School of Medicine, NEW YORK, NY, United States
Synopsis
Diffusion MRI based tractography is widely used to examine structural connectivity in the brain. Due to noises and motions, tractography in individual subject may contain erroneous results, which may be removed by averaging over a group. Although several group average tractography (GAT) approaches are available, their accuracy has not been thoroughly examined. In this study, we compared GAT based on spatial normalization of fiber orientation distribution maps and direct streamline mapping. Our results suggest that direct streamline mapping better preserve small and secondary axonal projections and is better-suited for studying group average tractography of the brain.
Introduction
Diffusion MRI based tractography has been developed for non-invasive reconstruction of major white matter tracts in the brain. Current diffusion MRI techniques, such as HARDI and diffusion spectrum imaging[1,2], can estimate fiber orientation distribution (FOD) to characterize complex organization of white matter tracts in each pixel and perform tractography[3,4]. However, FOD and tractography results from individual subject may contains errors due to imaging noises and subject motions.Group average tractography with spatial normalization can reduce random errors within individual data and define average structural connectivity in a group[5,6]. Several reports have demonstrated success in mapping individual white matter tracts reconstructed in their original image space to a template before averaging, but this approach is limited by the number of tracts that can be consistently reconstructed from individual data.
In this study, we explored two approaches to address the limitation. One approach is direct mapping of FODs[7,8]. Currently, spatial normalization of FOD data can be performed by sampling a given FOD with a set of vectors equally distributed over a sphere and, followed by reorienting the vectors based on the mapping, and reconstructing a modified FOD[9,10]. The accuracy of FOD mapping using this method, however, has not been investigated in details due to lack of gold standard[11]. The other approach is direct mapping of whole brain tractography using the concept of Track Orientation Density (TOD) described by Dhollander [12]. TODs map the distribution of tracks in the spatial domain, and similar to FOD, using a set of spherical harmonics (SH) basis functions. We compared the two approaches with direct mapping of fiber streamlines as ground truth.
Method
We selected 10 subject data from the HCP dataset and used fractional anisotropy (FA) and mean DWI from each subject generate diffeomorphic mappings between subject and a selected template using LDDMM. Using MRtrix, FOD maps were estimated and whole brain probabilistic tractography (minimum fiber length: 15mm, maximum length: 30mm, and number of streamlines is 16million). Spatial normalization of FODs as well as tractography streamlines using the LDDMM-derived mapping was performed using MRtrix. TODs were constructed based on the tractography streamlines after the spatial normalization process with 16 million total streamlines.We calculated the Jacobian matrix at each voxel from the mapping and used it as a linear approximation of image deformation. From the local Jacobian matrix, the Fractional Anisotropy Map (FA) is defined as the following:
$$FAjac=\sqrt{\frac{(λ_1-λ_2)^2+(λ_2-λ_3)^2+(λ_1-λ_3)^2}{2(λ_1^2+λ_2^2+λ_3^2)}}$$
where $$$λ_i$$$ is the ith eigenvalues of local Jacobian matrix.
Results
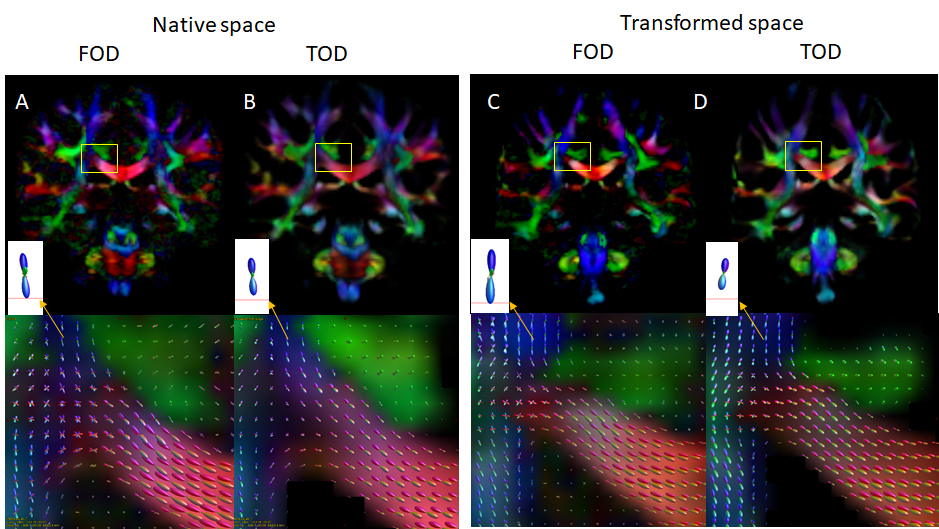
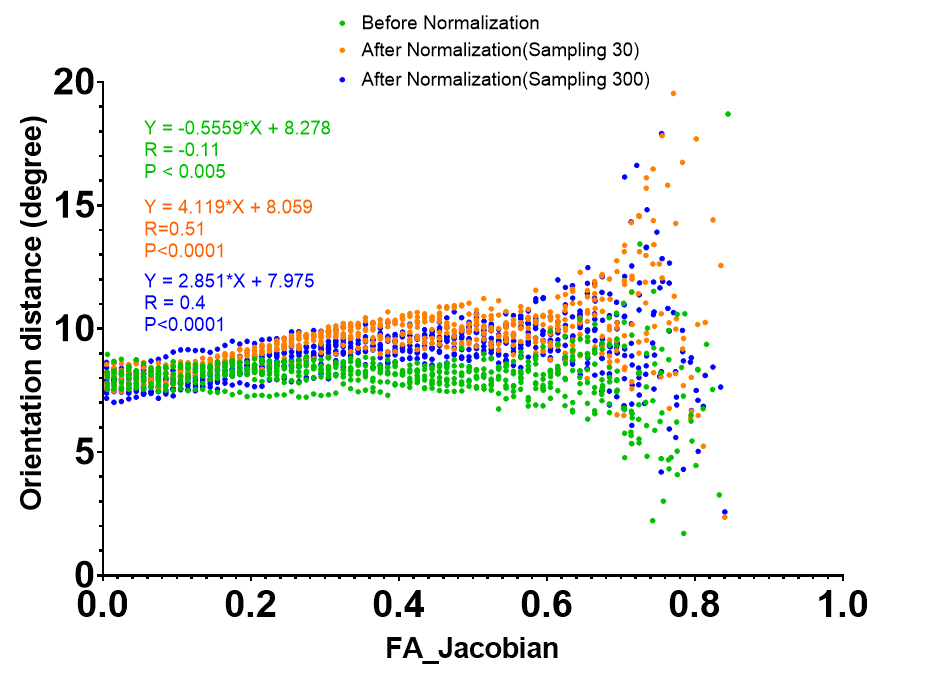
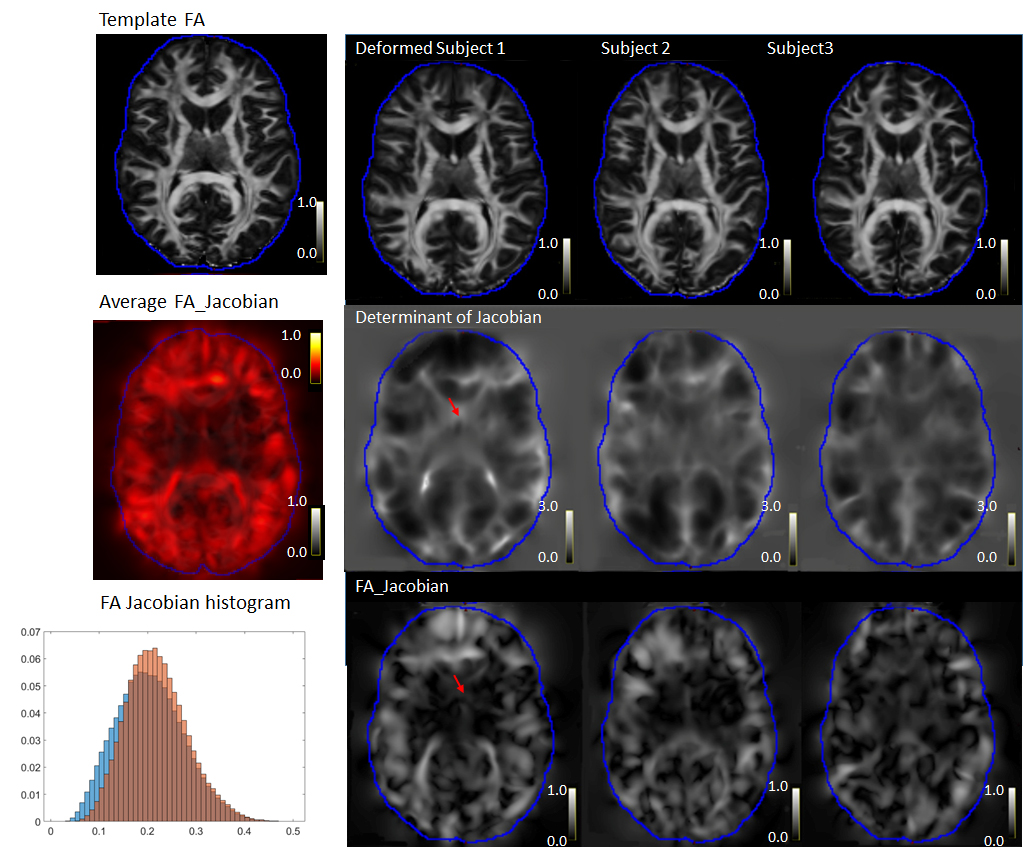
FOD and TOD maps in the original space (Fig. 1A-B) and after spatial normalization (Fig. 1C-D) mostly showed consistent peak orientations, but differences can be found in areas with large deformation after spatial normalization. Comparisons between FOD and TOD peak orientation shows a difference of approximately 8 degrees in the original space, likely due to noises and limited angular resolution of the diffusion encoding scheme (90 directions for b=3,000 s/mm2). Correlation analysis showed that the difference increased with the local FAJac values, which indicated the degree of non-uniform scaling in the normalization process (Fig. 2). Decreasing the number of sampling during FOD re-orientation using MRtrix from the default 300 directions to 30 directions further increased the difference, suggesting FOD reoriention in regions with large deformation could introduce a bias, which will affect tractography.Fig.3 shows normalized FA maps, Jacobian determinant, and FAjac maps of three subjects. Cortical regions with large inter-subject variability tend to have higher FAjac values than deep brain regions, as shown by overlaying the average FAjac maps from 9 subjects on the template FA map. In the histogram of the FAjac values in the entire brain, the mean FAjac was 0.2 (Blue bar), whereas FAjac values in the cortex was 0.22 (Orange bar). The results suggest that the cortical regions tend to have higher differences in peak orientation between spatially normalized FOD and TOD maps.
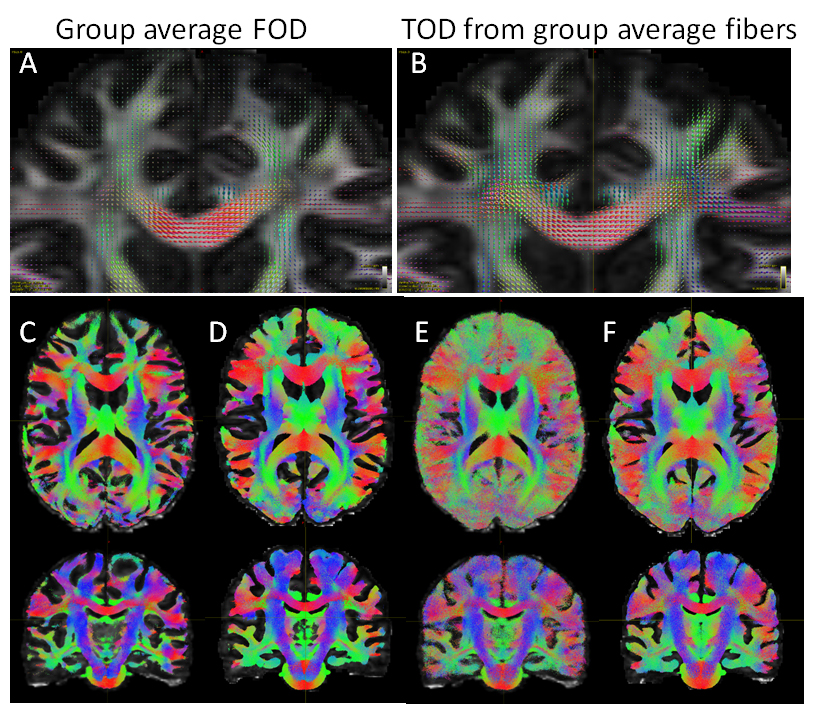
Compared to average FOD maps generated by averaging individual subject FOD maps after mapping (Fig. 4A), the TOD map generated from mapped streamlines (Fig. 4B) generally shows higher relative peak amplitude in subcortical white matter regions, with respect to the peak amplitude in the corpus callosum. Compared to tractography results from one subject (Fig. 4), the results from group average FOD maps (Fig. 4D) were more symmetric, and secondary axonal projections (e.g., the pontine crossing fibers) can be more readily identified. However, compared with results based on direct streamline mapping (Fig.4E) and group average TODs (Fig. 4F, with the same total streamlines as in Fig. 4D), the results based on group average FODs showed less subcortical tracts.
Discussion
Our results suggest that FOD mapping and averaging may introduce biases for regions with large anisotropic scaling, mostly distributed near the cortical surface. Direct streamline mapping, although computational expansive, preserved the tractography results in the original space. Using TODs generated from the direct streamline mapping results, small and secondary axonal projections were better preserved after averging.Conclusion
Direct streamline mapping should be used to study group average tractography of the brain.Acknowledgements
No acknowledgement found.References
[1]. Berman, J I et al. High angular resolution diffusion imaging probabilistic tractography of the auditory radiation.AJNR. American journal of neuroradiology 34, pp 1573-1578. (2013)
[2]. Wedeen VJ, Wang RP, Schmahmann JD, et al. Diffusion spectrum magnetic resonance imaging (DSI) tractography of crossing fibers. Neuroimage. 41, pp 1267-1277. (2008)
[3]. J.-D. Tournier, F. Calamante, D.G. Gadian, and A. Connelly. Direct estimation of the fiber orientation density function from diffusion-weighted MRI data using spherical deconvolution. NeuroImage 23, pp 1176-1185. (2004).
[4]. J. Tournier, F. Calamante and A. Connelly. Robust determination of the fiber orientation distribution in diffusion MRI: Non-negativity constrained super-resolved spherical deconvolution. NeuroImage 35, pp 1459-1472. (2007).
[5]. Yeh FC, Panesar S, Fernandes D, et al. Population-averaged atlas of the macroscale human structural connectome and its network topology. Neuroimage 178, pp 57-68. (2018)
[6]. Andreas Horn, Felix Blankenburg, Toward a standardized structural–functional group connectome in MNI space, NeuroImage, 124, pp 310-322. (2016)
[7]. X. Hong, L. R. Arlinghaus and A.W. Anderson. Spatial normalization of the fiber orientation distribution based on high angular resolution diffusion imaging data. Magnetic Resonance in Medicine 61. Pp. 1520-1527. (2009).
[8]. D. Raffelt, J.D. Tournier, S. Crozier A. Connelly and O. Salvado. Reorientation of fiber orientation distributions using Apodized Point Spread Functions. Magnetic Resonance in Medicine 67, pp. 844-855 (2012).
[9]. D. Raffelt, J.D. Tournier, S. Rose, G.R. Ridgway, and R. Henderson et al. Apparent Fiber Density: A novel measure for the analysis of diffusion-weighted magnetic resonance images. NeuroImage 59. pp. 3976-3994. (2012).
[10]. D. Haffelt, , J.D. Tournier, J. Fripp, S. Crozier and A. Connelly et al. Symmetric diffeomorphic registration of fiber orientation distributions. NeuroImage 56, pp. 1171-1180. (2011).
[11]. K.G. Schilling, V. Janve, Y. Gao, I. Stepniewska and B.A. Landman et al. Histological validation of diffusion MRI fiber orientation distributions and dispersion. NeuroImage 165, pp 200-221 (2018).
[12]. Dhollander T, Emsell L, Van Hecke W, Maes F, et al. Track Orientation Density Imaging (TODI) and Track Orientation Distribution (TOD) based tractography. NeuroImage 94. pp. 312-336.(2014)
Figures