4282
Where do streamlines come from? Seeding strategies impact on streamline distribution1Sherbrooke Connectivity Imaging Lab (SCIL), Université de Sherbrooke, Sherbrooke, QC, Canada, 2Videos & Images Theory and Analytics Laboratory (VITAL), Université de Sherbrooke, Sherbrooke, QC, Canada
Synopsis
Tractography algorithms require a seeding map in which each point initiates one streamline. We can determine how many streamlines end in each voxel from one of their ends, but their initial point is unknown. We propose a method to compute the initial streamline points (IPS) in each voxel and evaluate their distribution depending on two strategies of seeding. With the surface-based interface, IPSs maps are more uniform along the cortex independently of the cortical volume, allowing a greater cortical coverage and specificity at the level of the cortical regions both at the whole-brain and bundle level.
Introduction
Based on diffusion MRI, tractography virtually reconstructs white matter structural pathways by following the local orientation of estimated local models, thus generating streamlines [1,2]. Streamlines are initiated based on a seeding map, which depends either on the number of seeds per voxel or a total number of seeds. After a full tractogram is produced, we can determine the number of streamlines that pass through or end-in each voxel. However, from the whole-brain tractogram and current file formats for tractograms, there is no way to know which initial seed point generated which streamline. In this abstract, we propose a method to keep the information of the initial streamline point, e.g the seed that created it, and to evaluate the impact of the seeding strategy on the distribution of the initial streamline points.Methods
To generate the seed density map (SDM) and initial streamline point (ISP) map, tracking algorithms from Dipy were modified to save the initial seeding point alongside each streamline inside the tractogram file (data_per_streamline attribute for the trk format) during the tractography process. All following streamline post-processing scripts were then adapted to make sure the seeding information was kept during post-processing. The SDM represents the number of initial seed points in each voxel used to launch a streamline. The ISP map represents the number of seeds in each voxel that reconstructed a valid streamline. For the evaluation, all diffusion MRI data from fourteen subjects of the Human Connectome Project 1200 subjects [3] was used. Whole-brain probabilistic tractography was performed using Particle Filtering Tractography [4] to build two tractograms for each subject; one in which streamlines were initiated from the WM/GM interface mask (voxel-based) using TractoFlow [5], and another, initiated from the WM/GM interface mesh (surface-based) using Surface-Enhanced Tractography [6]. For each tractogram, a similar number of initialization seeds were used and streamlines that did not reach the cortex were excluded. 25 major white matter bundles were then extracted from the two whole-brain tractograms using RecoBundles [7]. We only report results for the Arcuate Fasciculus (AF) and the Inferior Frontal Orbital Fasciculus (IFOF). For each strategy, both SDM and ISP maps were generated. The ratio of all the resulting seeds in the ISP map over all the seeds in the SDM map was computed to evaluate the proportion of remaining seeds after tracking is over. To estimate the distribution of remaining seed ratio according to the cortical regions of the Brainnetome atlas [8], all SDM and ISP maps were nonlinearly warped to the MNI space and averaged across participants. Averaged values of seed count for each parcel of the Brainnetome atlas were then extracted from both maps to compute the remaining seeds ratio by parcel.Results
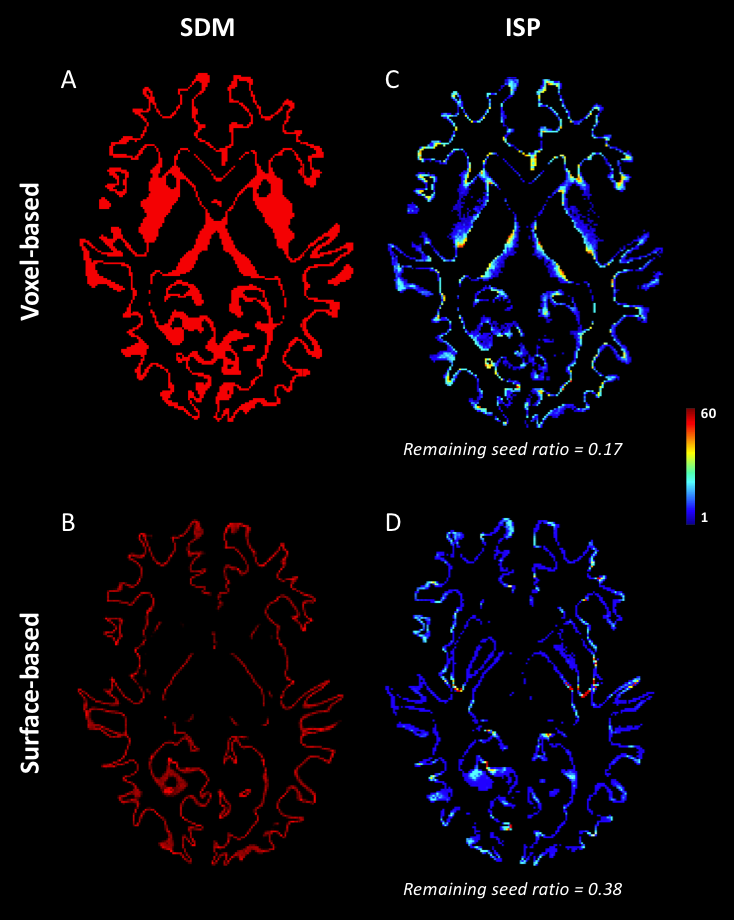
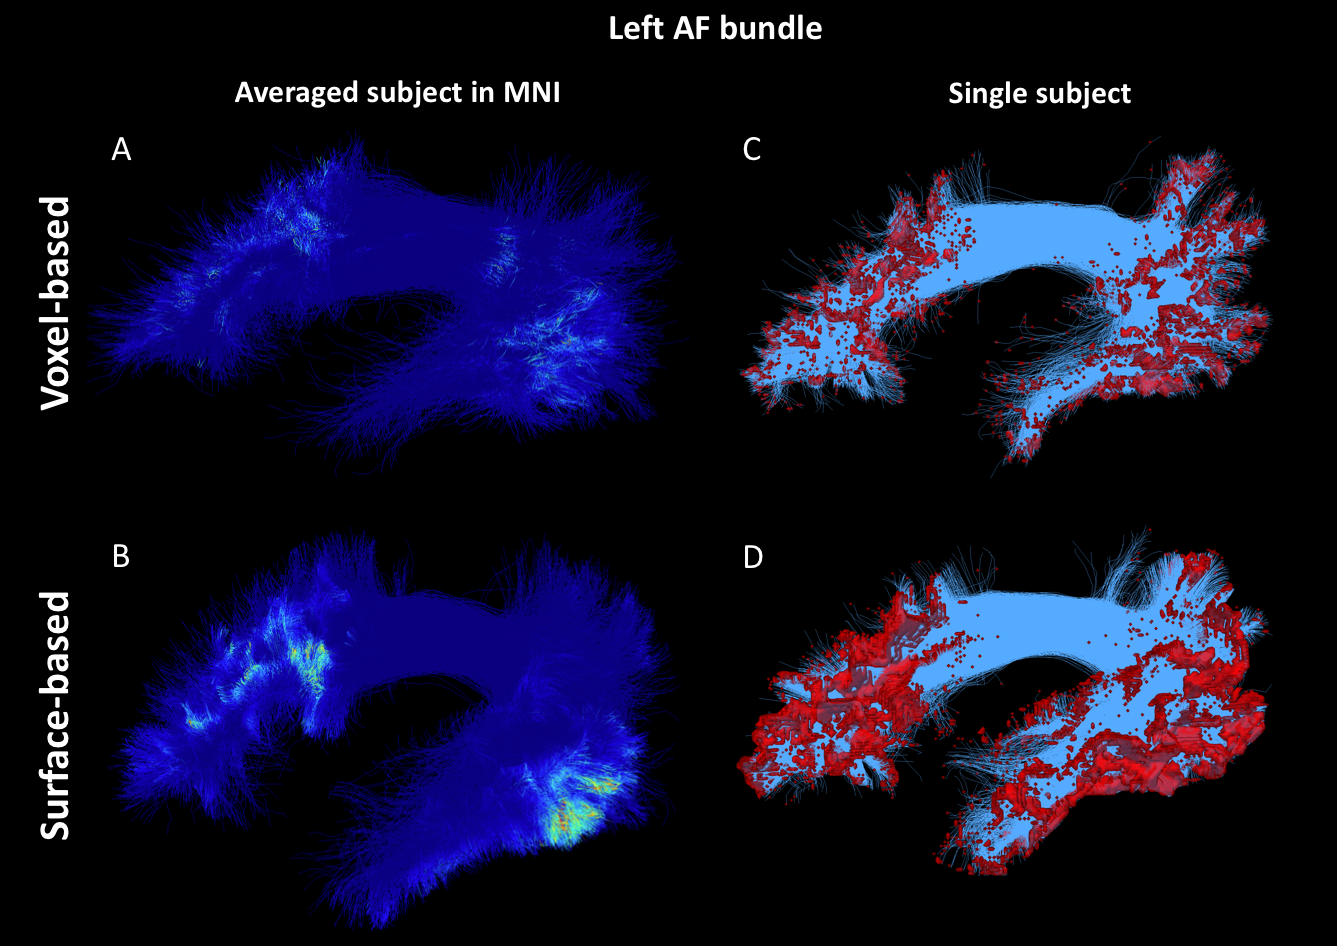
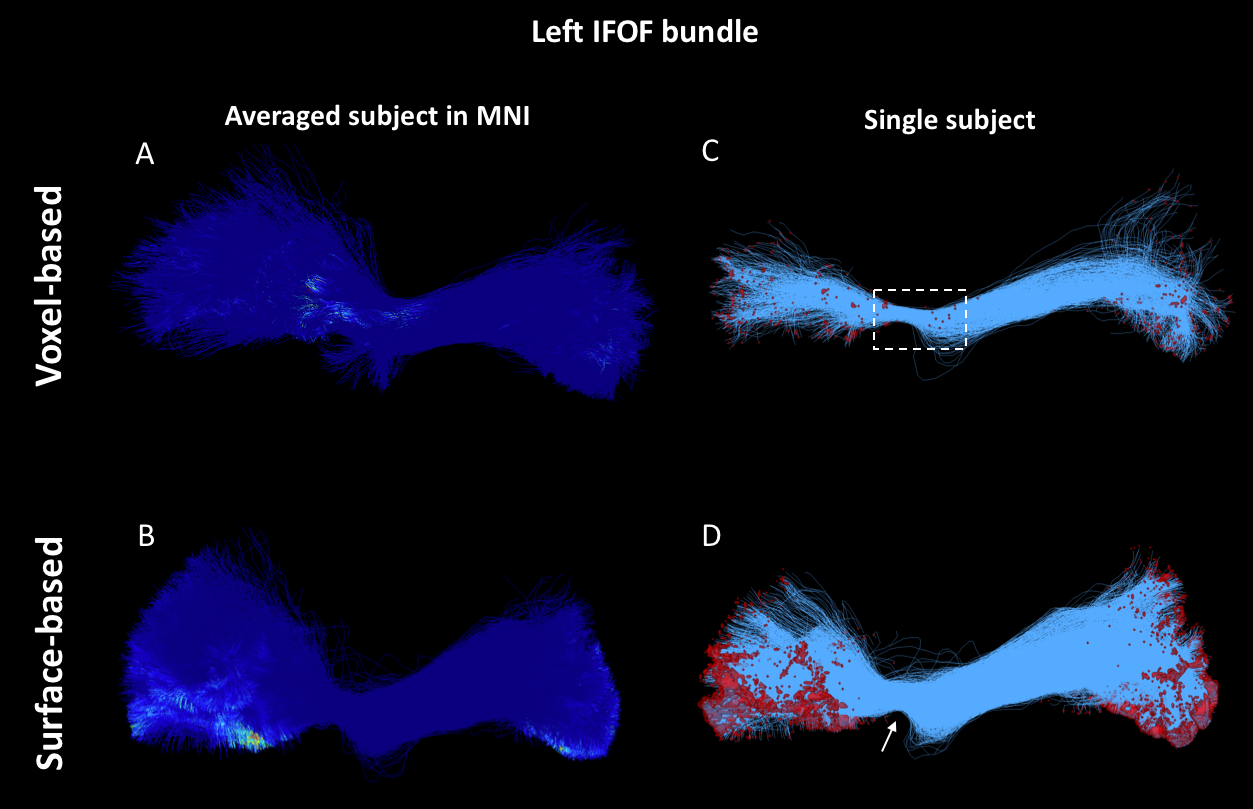
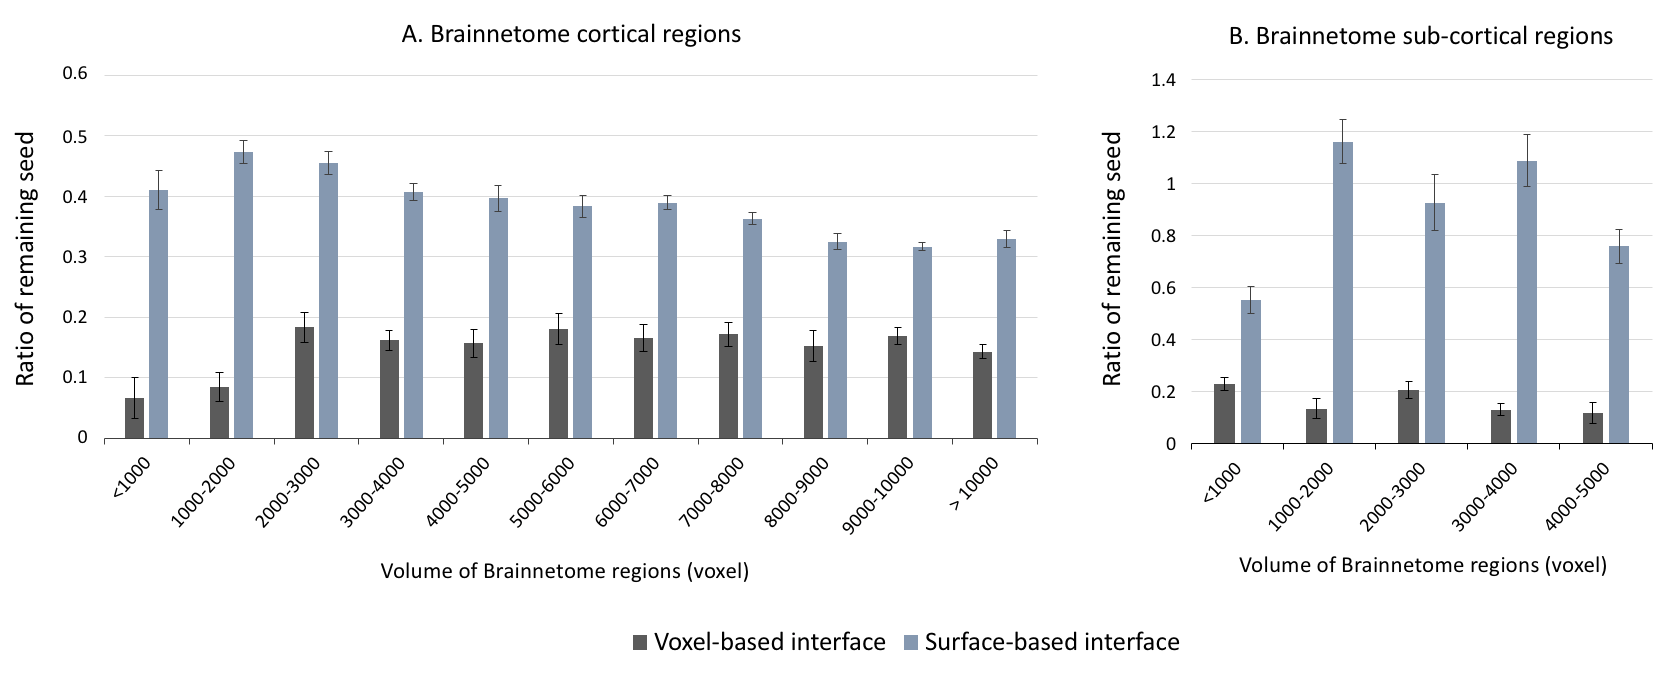
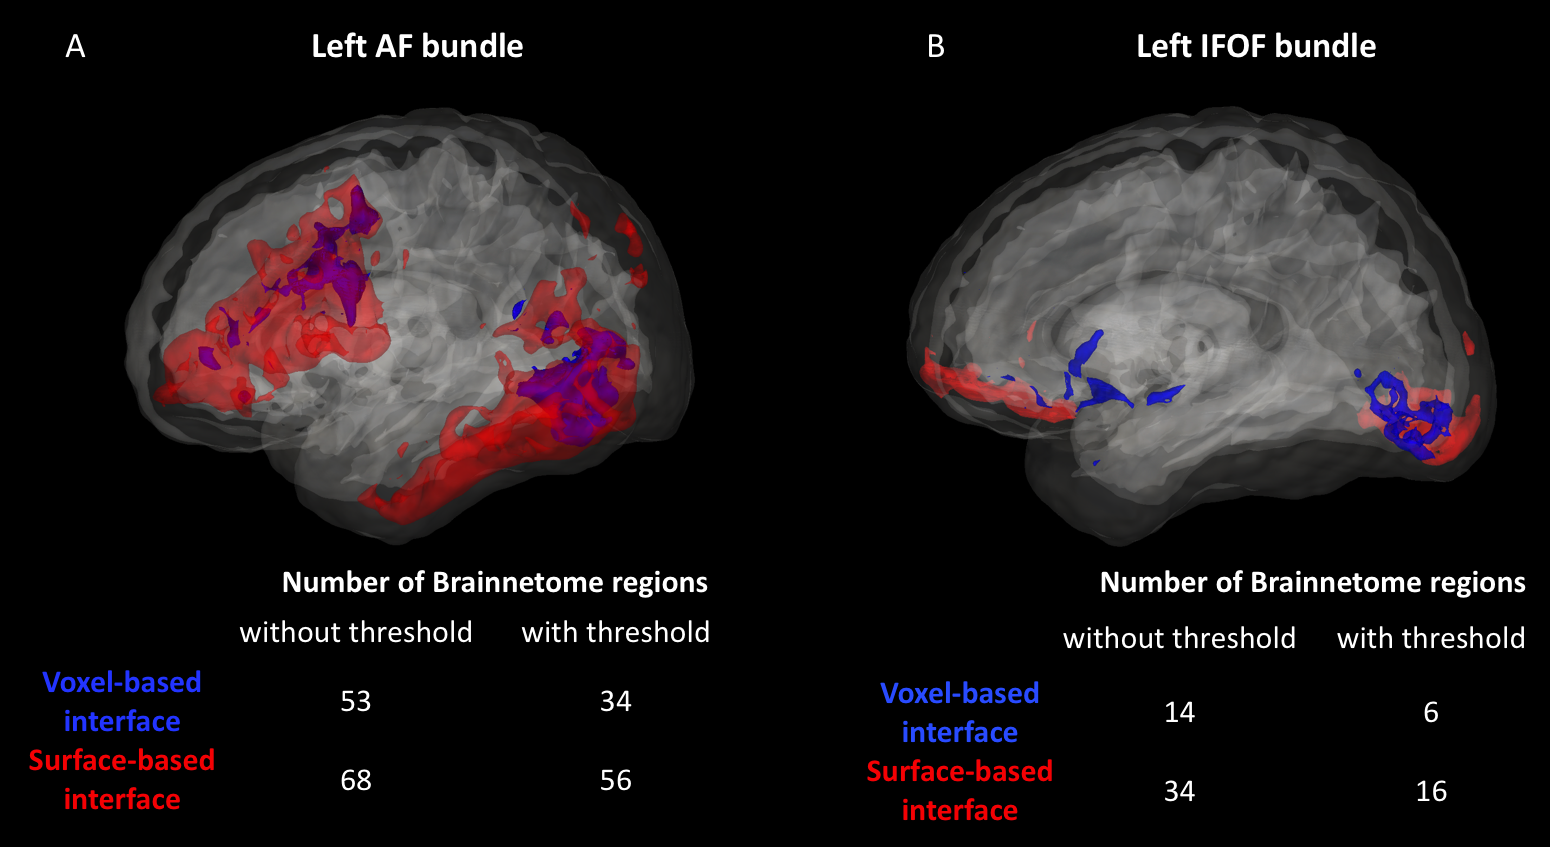
As shown in Figure 1, despite a uniform SDM for both approaches, the surface-based approach provides a more uniform distribution of ISP compared to the voxel-based approach. Figure 2 and 3 illustrates the distribution of IPS along bundles for each approach. Contrary to the voxel-based approach, the surface-based approach reveals a high number of ISPs in some specific areas (Fig 2-3, A-B). Moreover, a greater and more uniform cortical coverage of IPS compared to voxel-based interface and none of IPS are observed in sub-cortical regions for IFOF bundle (Fig 2-3, C-D, Fig 5B). Figure 4 illustrates the distribution of the ratio according to the volume of Brainnetome regions. With surface-based interface, a more homogenous ratio is observed independently of the cortical volume (Fig. 2A). Conversely, for the subcortical regions, the ratio for the voxel-based interface is more homogenous compared to surface-based interface (Fig 2B). Figure 5 illustrates binary maps for the number of ISPs present in at least 50% of the population and the corresponding number of regions with and without threshold for each bundle. A greater number of cortical regions is preserved after thresholding with the surface when compared to the voxel-based.Discussion & Conclusion
We have shown that the ISP maps are affected by the seeding strategies. The surface-based interface provides ISP maps with greater and more uniform cortical coverage. This coverage is maintained at the bundle level, even for hard to track bundles, and allows a greater specificity at the level of the cortical regions. Results on the volume of the cortical regions shows that no matter the seeding strategy, a larger interface volume or surface does not necessarily induce a greater ratio of remaining seeds. In connectomics, it's common to normalize the number of streamlines by the volume of the cortical regions. However, our results raise the question of the validity of this normalization. Regarding the subcortical regions, the number of IPSs was greater than the number of SDM with the surface-based interface. While the subcortical regions are entirely covered in SDM with the voxel-based interface, the number of ISPs is low (mean ratio = 0.15). This suggests that the volume or surface of subcortical regions affects the distribution of IPS. In conclusion, the ISP maps provide important additional information that should be considered for future analyzes, such as dynamic seeding and new alternative solutions to the tractography biases.Acknowledgements
No acknowledgement found.References
1. Jeurissen B, Descoteaux M, Mori S, Leemans A. Diffusion MRI fiber tractography of the brain. NMR Biomed. 25 sept 2017;
2. Descoteaux M, Poupon C. DIffusion-Weighted MRI. In: Comprehensive Biomedical Physics. 2014. p. 81‑97.
3. Glasser MF, Sotiropoulos SN, Wilson JA, Coalson TS, Fischl B, Andersson JL, et al. The minimal preprocessing pipelines for the Human Connectome Project. NeuroImage. 15 oct 2013;80:105‑24.
4. Girard G, Whittingstall K, Deriche R, Descoteaux M. Towards quantitative connectivity analysis: reducing tractography biases. Neuroimage. sept 2014;98:266‑78.
5. Theaud G, Houde J-C, Boré A, Rheault F, Morency F, Descoteaux M. TractoFlow: A robust, efficient and reproducible diffusion MRI pipeline leveraging Nextflow & Singularity. NeuroImage. 1 sept 2020;218:116889.
6. St-Onge E, Daducci A, Girard G, Descoteaux M. Surface-enhanced tractography (SET). Neuroimage. 01 2018;169:524‑39.
7. Rheault F, St-Onge E, Sidhu J, Maier-Hein K, Tzourio-Mazoyer N, Petit L, et al. Bundle-specific tractography with incorporated anatomical and orientational priors. NeuroImage. 1 févr 2019;186:382‑98.
8. Fan L, Li H, Zhuo J, Zhang Y, Wang J, Chen L, et al. The Human Brainnetome Atlas: A New Brain Atlas Based on Connectional Architecture. Cereb Cortex. 1 août 2016;26(8):3508‑26.
Figures