4278
A 5.7mW 1.5T Silicon Germanium Pre-Amp, and its Effects on Image Distortion1Electrical Engineering, Stanford University, Stanford, CA, United States, 2GE Healthcare, Aurora, OH, United States, 3Radiology, Stanford University, Stanford, CA, United States
Synopsis
A 5.7mW Silicon Germanium Pre-Amplifier was constructed, characterized, and its potential impact on image quality demonstrated. The amplifier demonstrates significant power savings relative to current implementations at the cost of increased device non-linearity and decreased input impedance. A benchtop measurement setup was constructed to simulate coils signals in conjunction with a physical receive chain. Measured image distortion began at peak input powers of -25dBm. This corresponds to high bandwidth, high dynamic range imaging sequences. For small coil sizes this distortion may not play a role, reducing the power barrier to wireless receive arrays.
Motivation
MRI pre-amps have traditionally been constructed from high electron mobility transistor (HEMT) devices. This achieved high dynamic range, low noise, and high input impedance at the cost of significant power consumption with bias currents often exceeding 30mA’s. This significant power consumption is a barrier to the development of wireless receive arrays, particularly in high channel count cases, in which power is limited [1]. To reduce power consumption the use of alternative Silicon Germanium HBT parts has been proposed [2,3]. Such devices have the potential to maintain desired gain and noise metrics at lower bias currents, but at the cost of increased device non-linearity and decreased input impedance. To determine the suitability of these devices to the MRI use case, one must examine the resulting impact of their more severe non-linearity on image quality. While prior work has demonstrated these effects via simulation [3], it is vital to evaluate these devices in a physically realized case.Amplifier Design
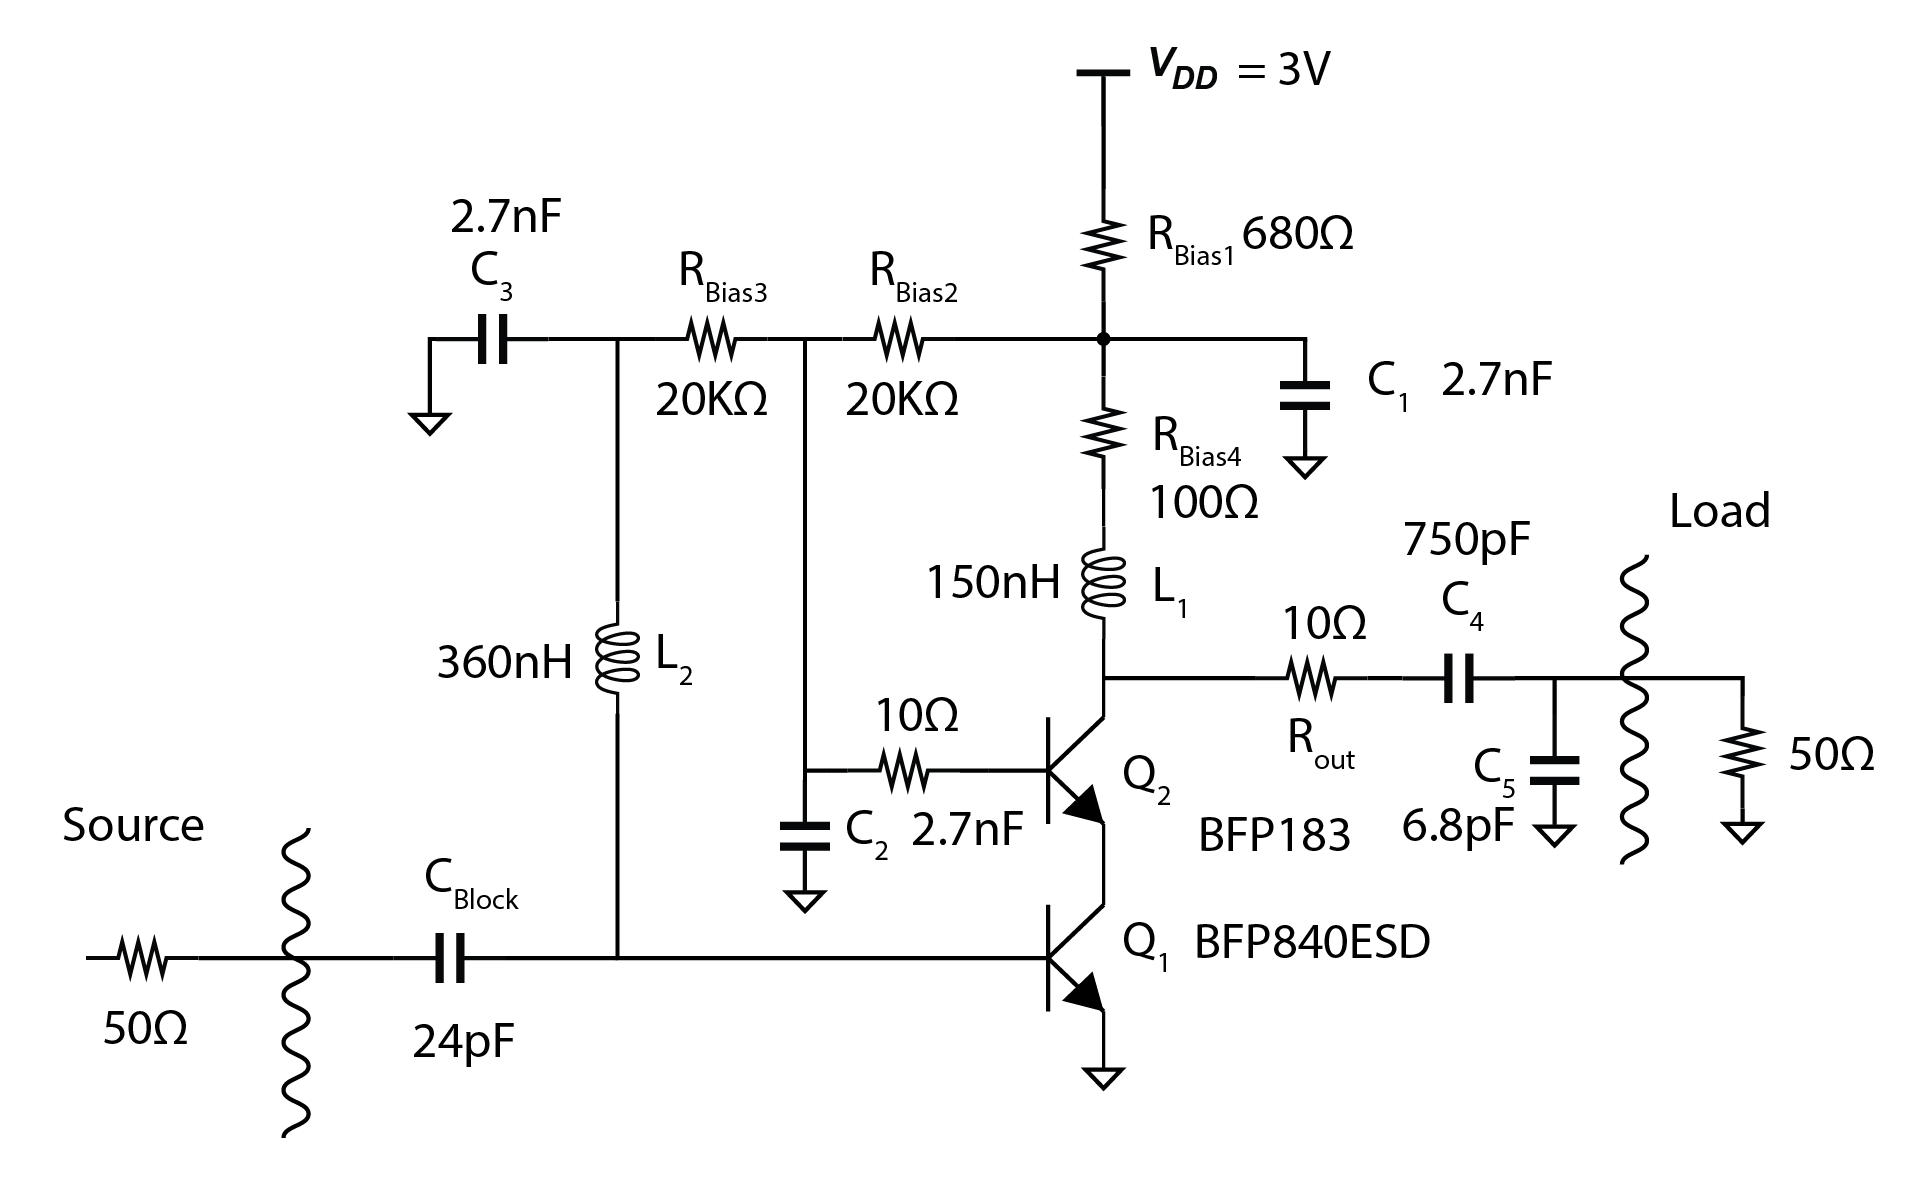
Adapting a previously simulated topology, a cascode common emitter SiGe amplifier based around the Infineon BFP840 was fabricated on FR4. A BFP183 NPN transistor was used as the cascode device. A regulated supply voltage of 3V, regulated down from 3.5V, was provided by a LT1761 LDO. The input matching network was designed for optimum noise match to a 50 Ohm system, chosen due to test equipment standards. A schematic of this amplifier is shown in Fig. 1.Bias Current Choice
Previous work in modeling of the nonlinear effects of this amplifier [3] indicated that with decreasing bias current device non-linearity increased, in keeping with known transistor behavior [4]. For the topology shown in Fig. 1 significant image artifacts began at 2mA bias. As such, 2mA was chosen to be a representative example of the tradeoff between power savings and image distortion. In addition, pre-amp decoupling requires a high input impedance [5]. HBT devices have an input impedance inversely proportional to bias current, providing another incentive to bias the device at a reduced current. Following fabrication of the amplifier the measured current consumption, gain, and noise figure for 1.5T operation at 64 MHz were 1.9mA, 17.25dB, and 0.55dB, respectively.Experimental Methods
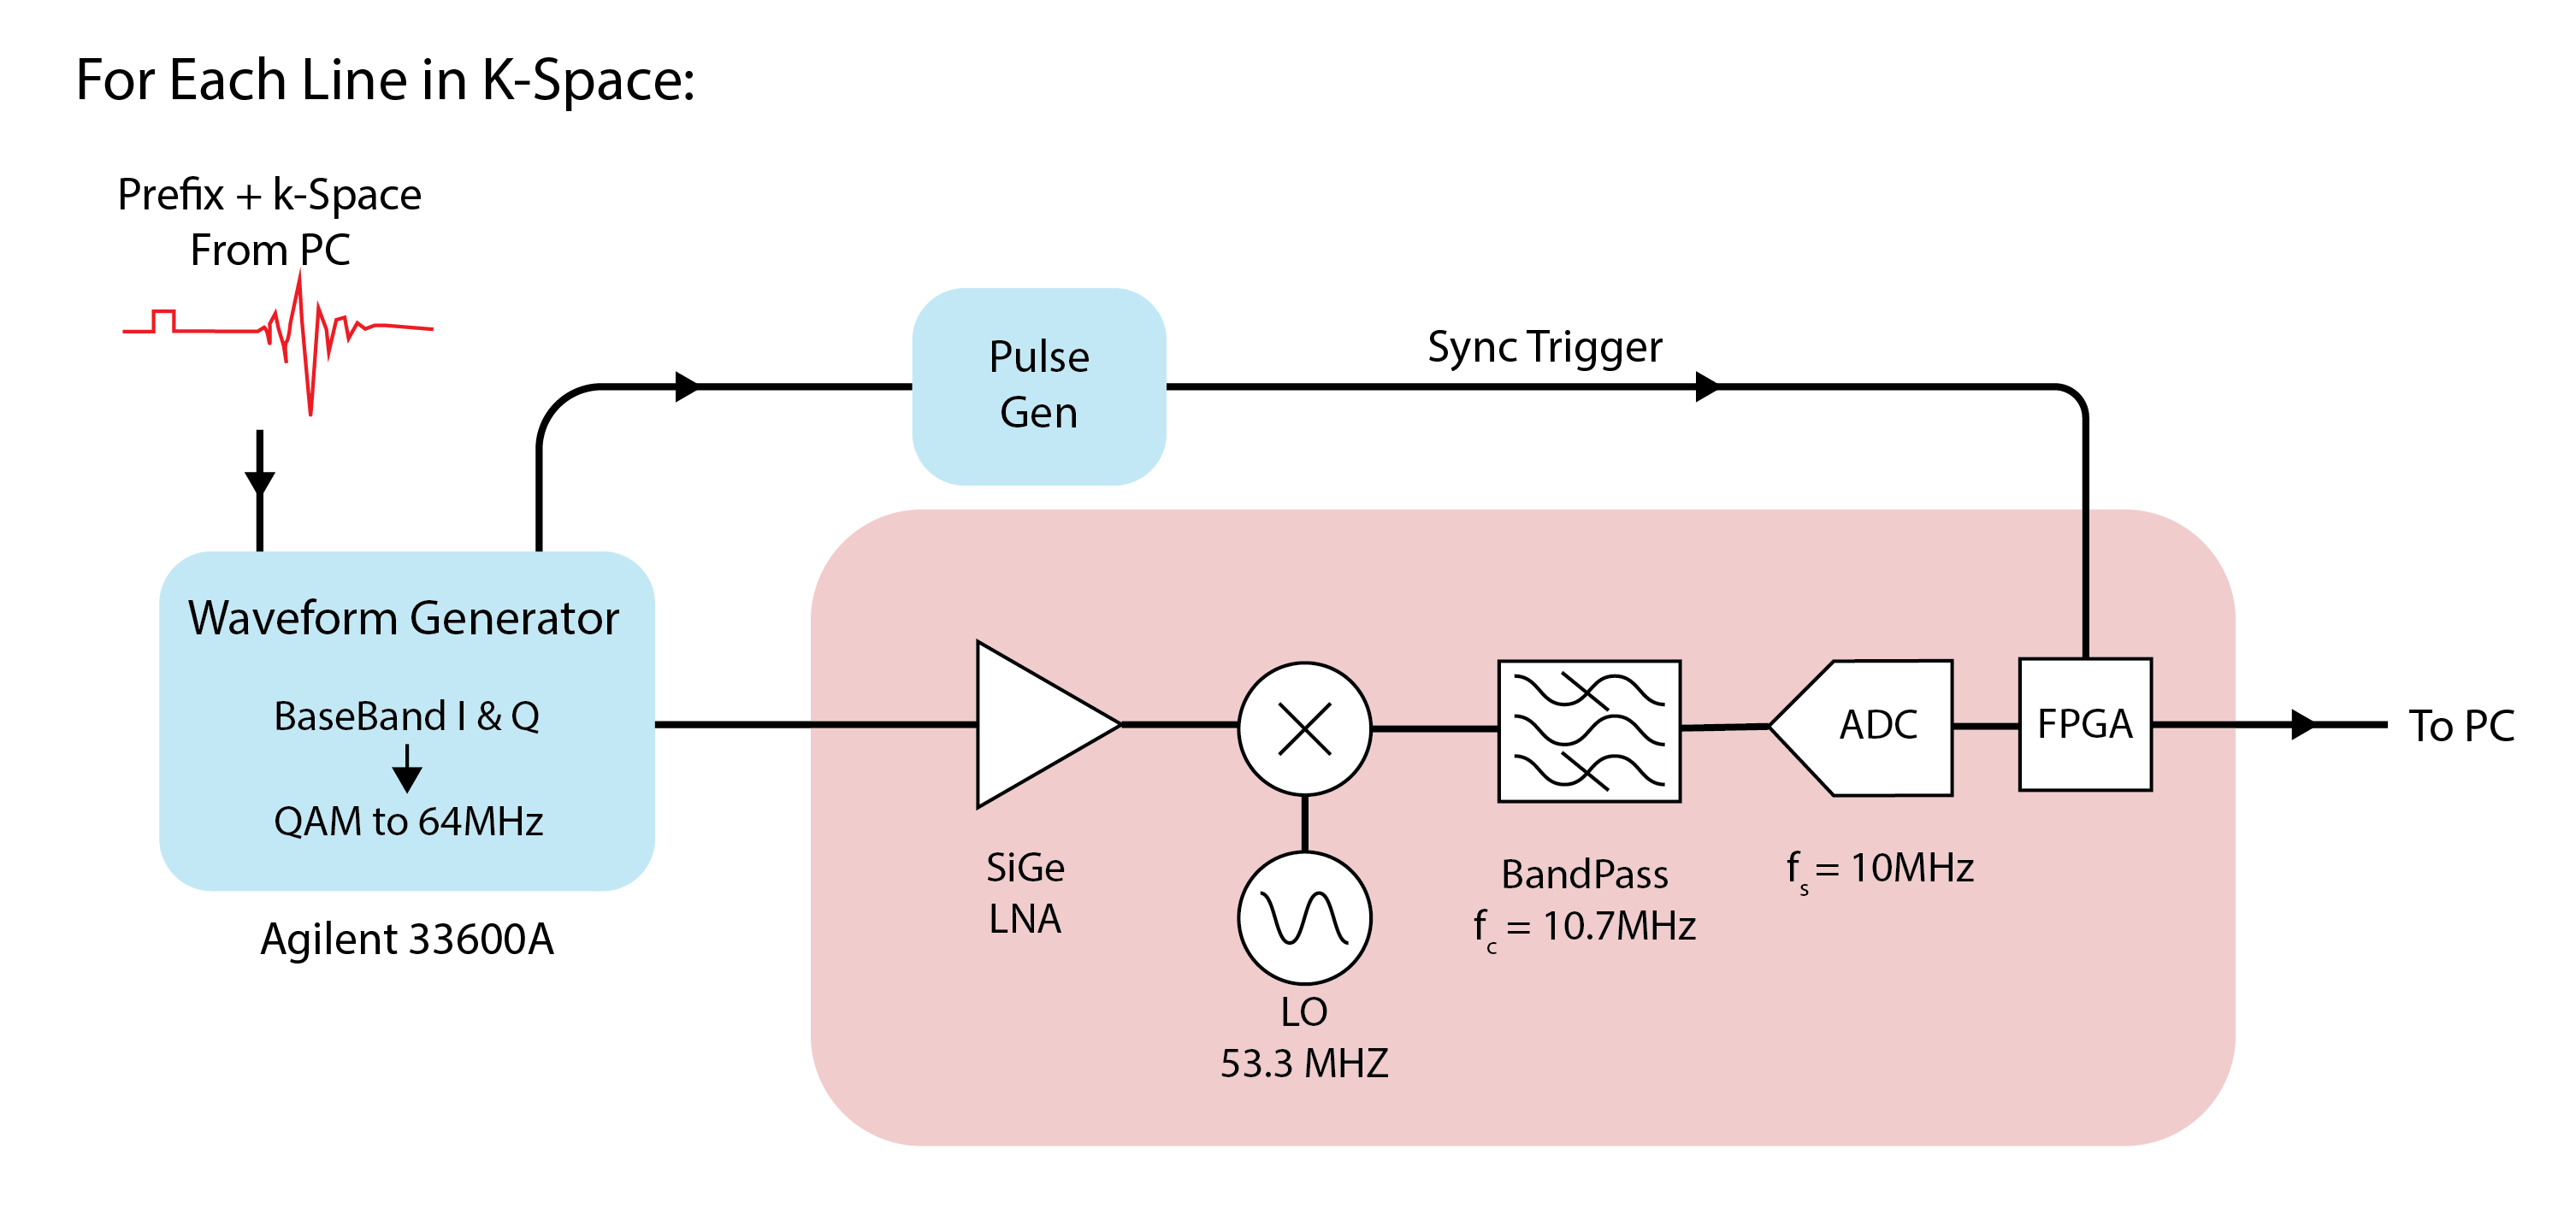
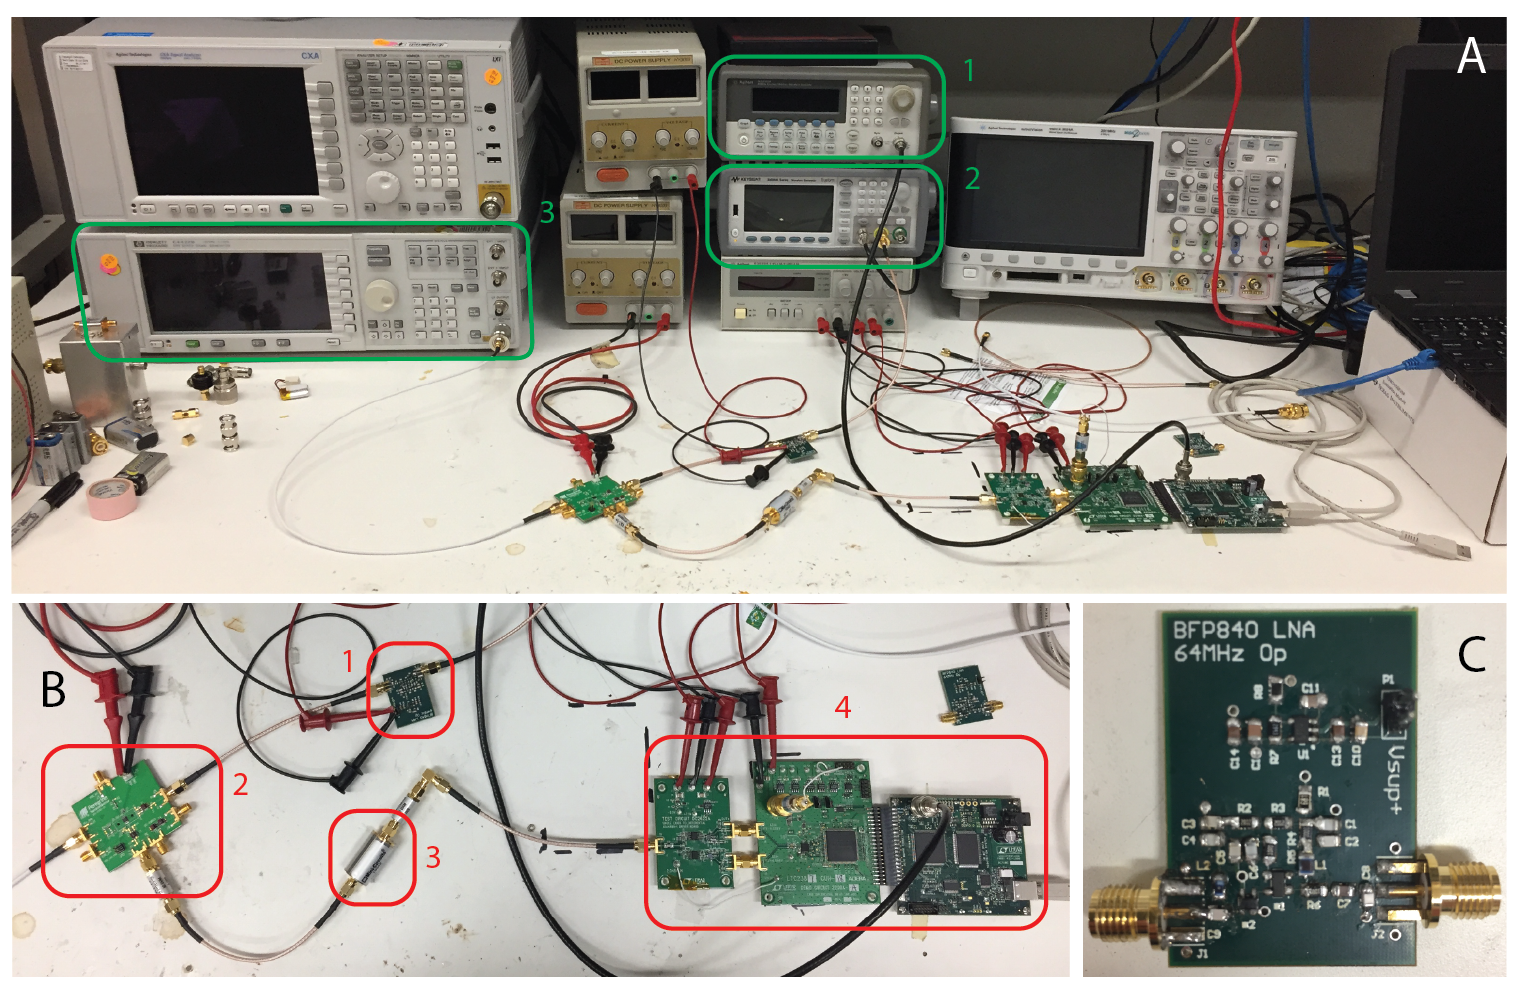
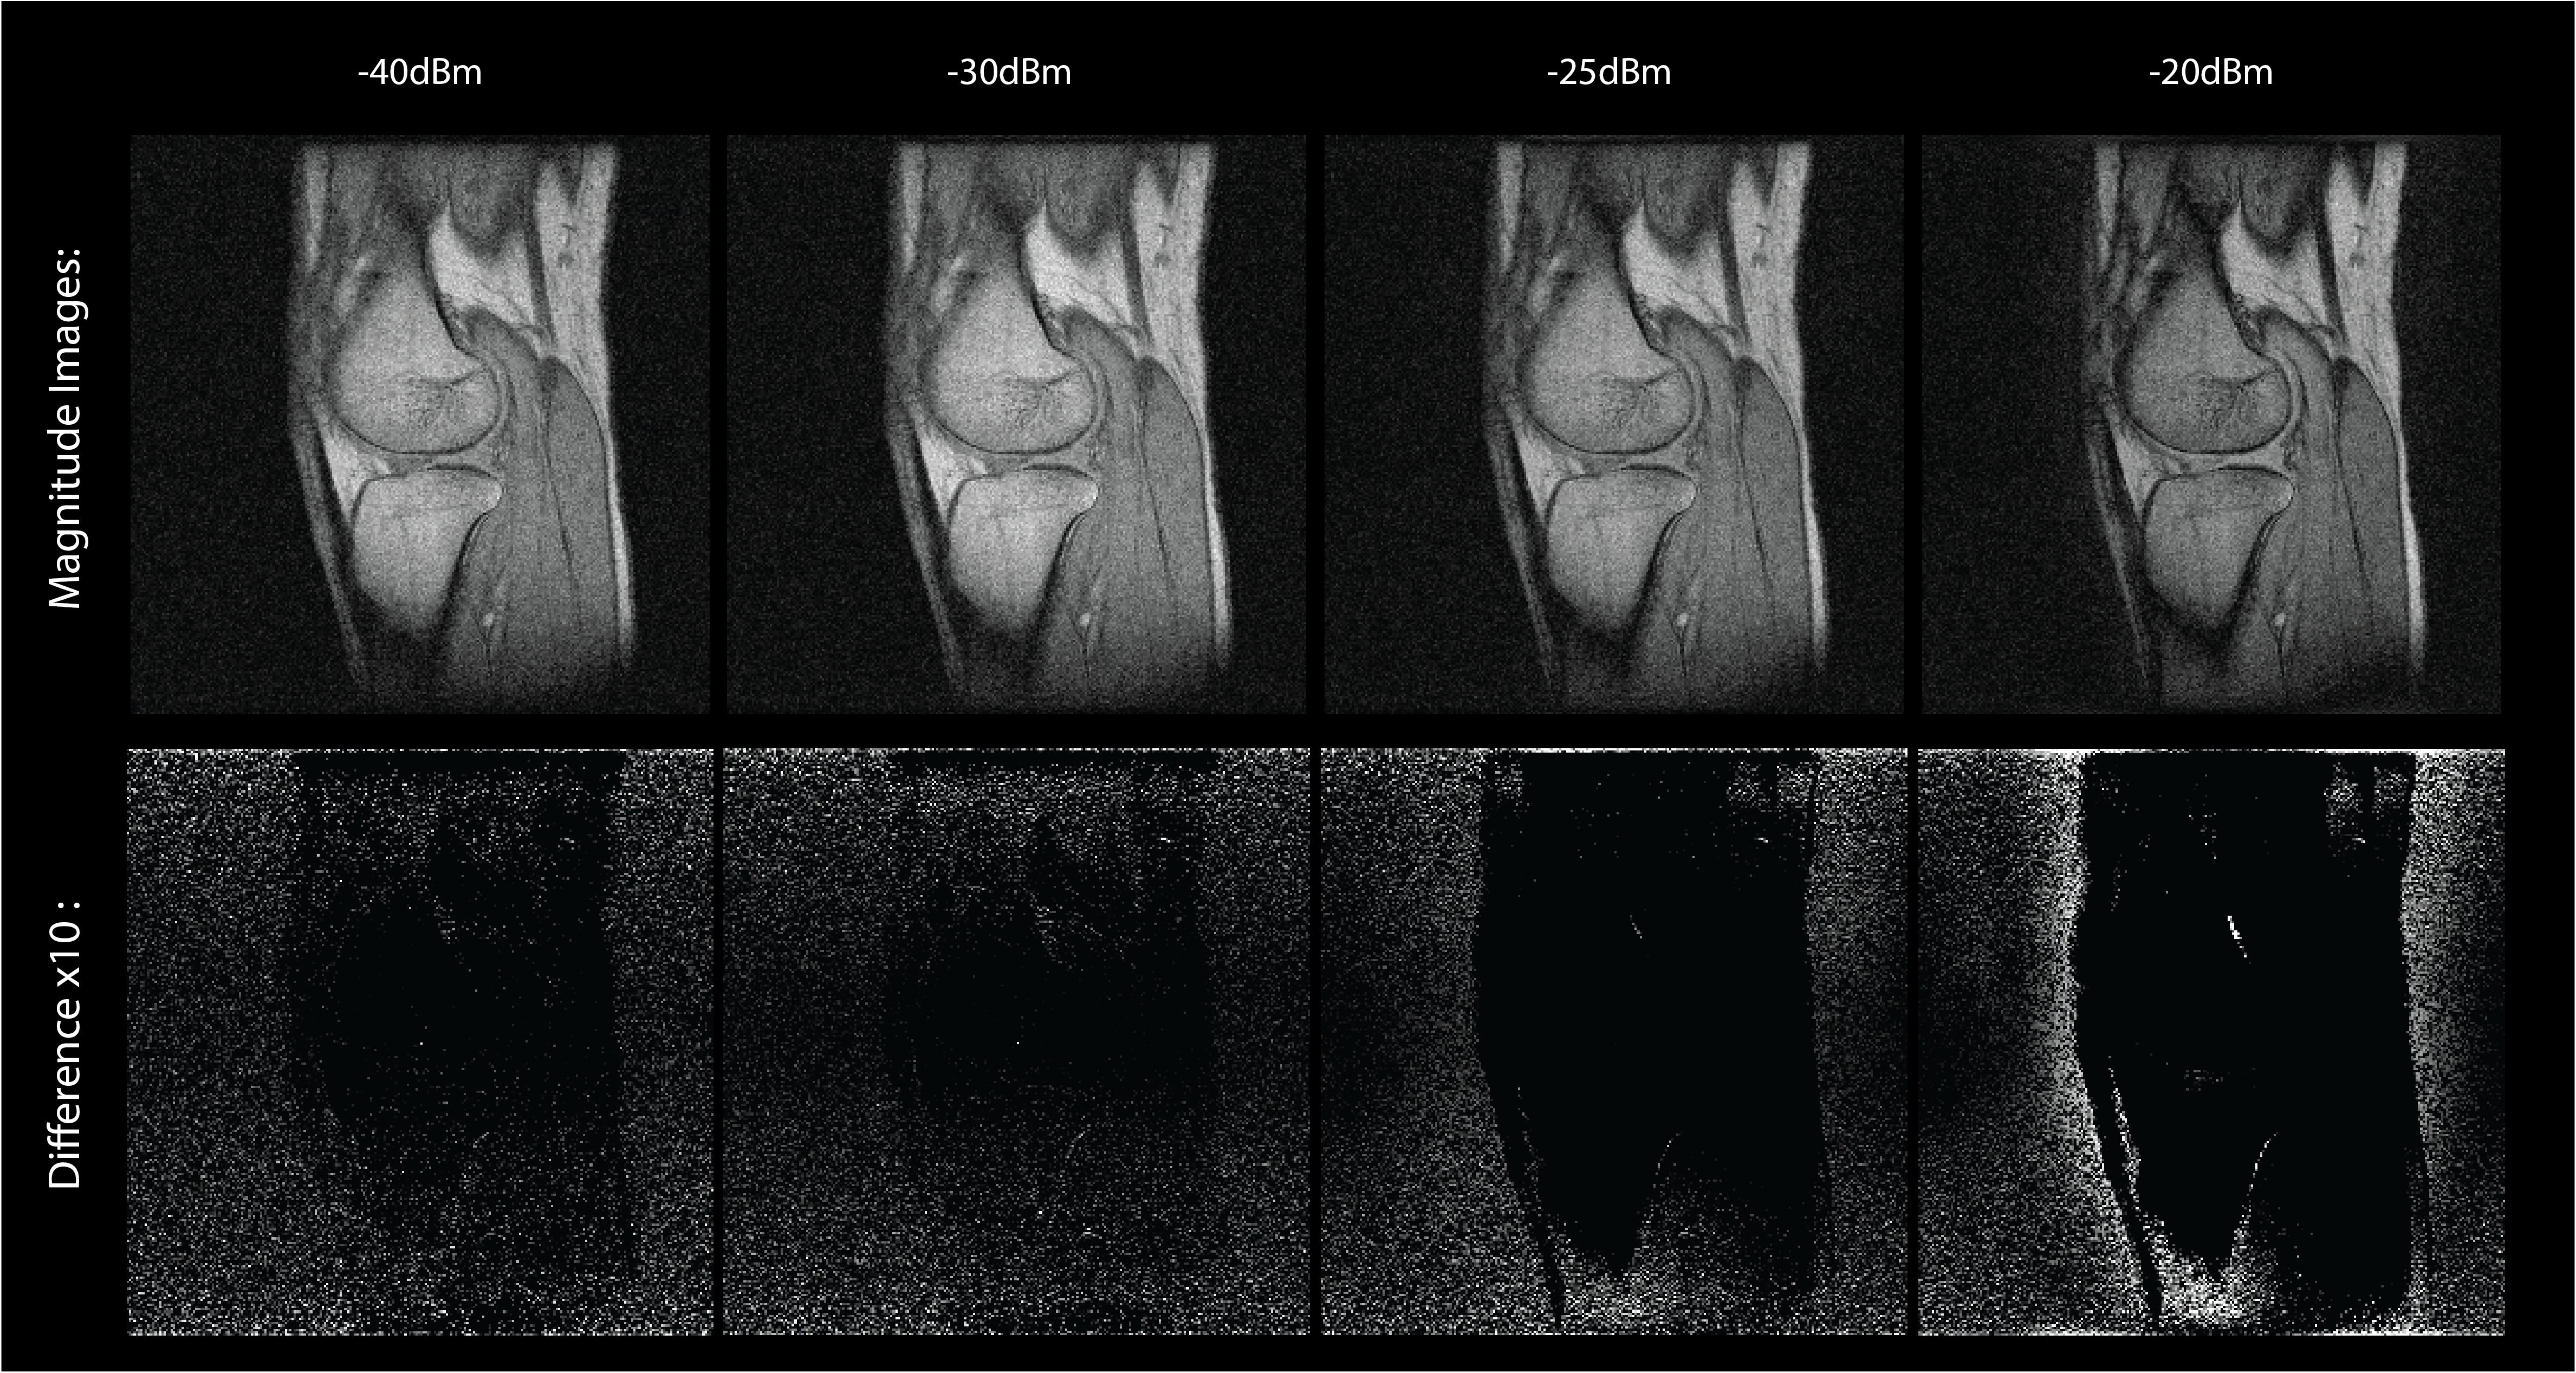
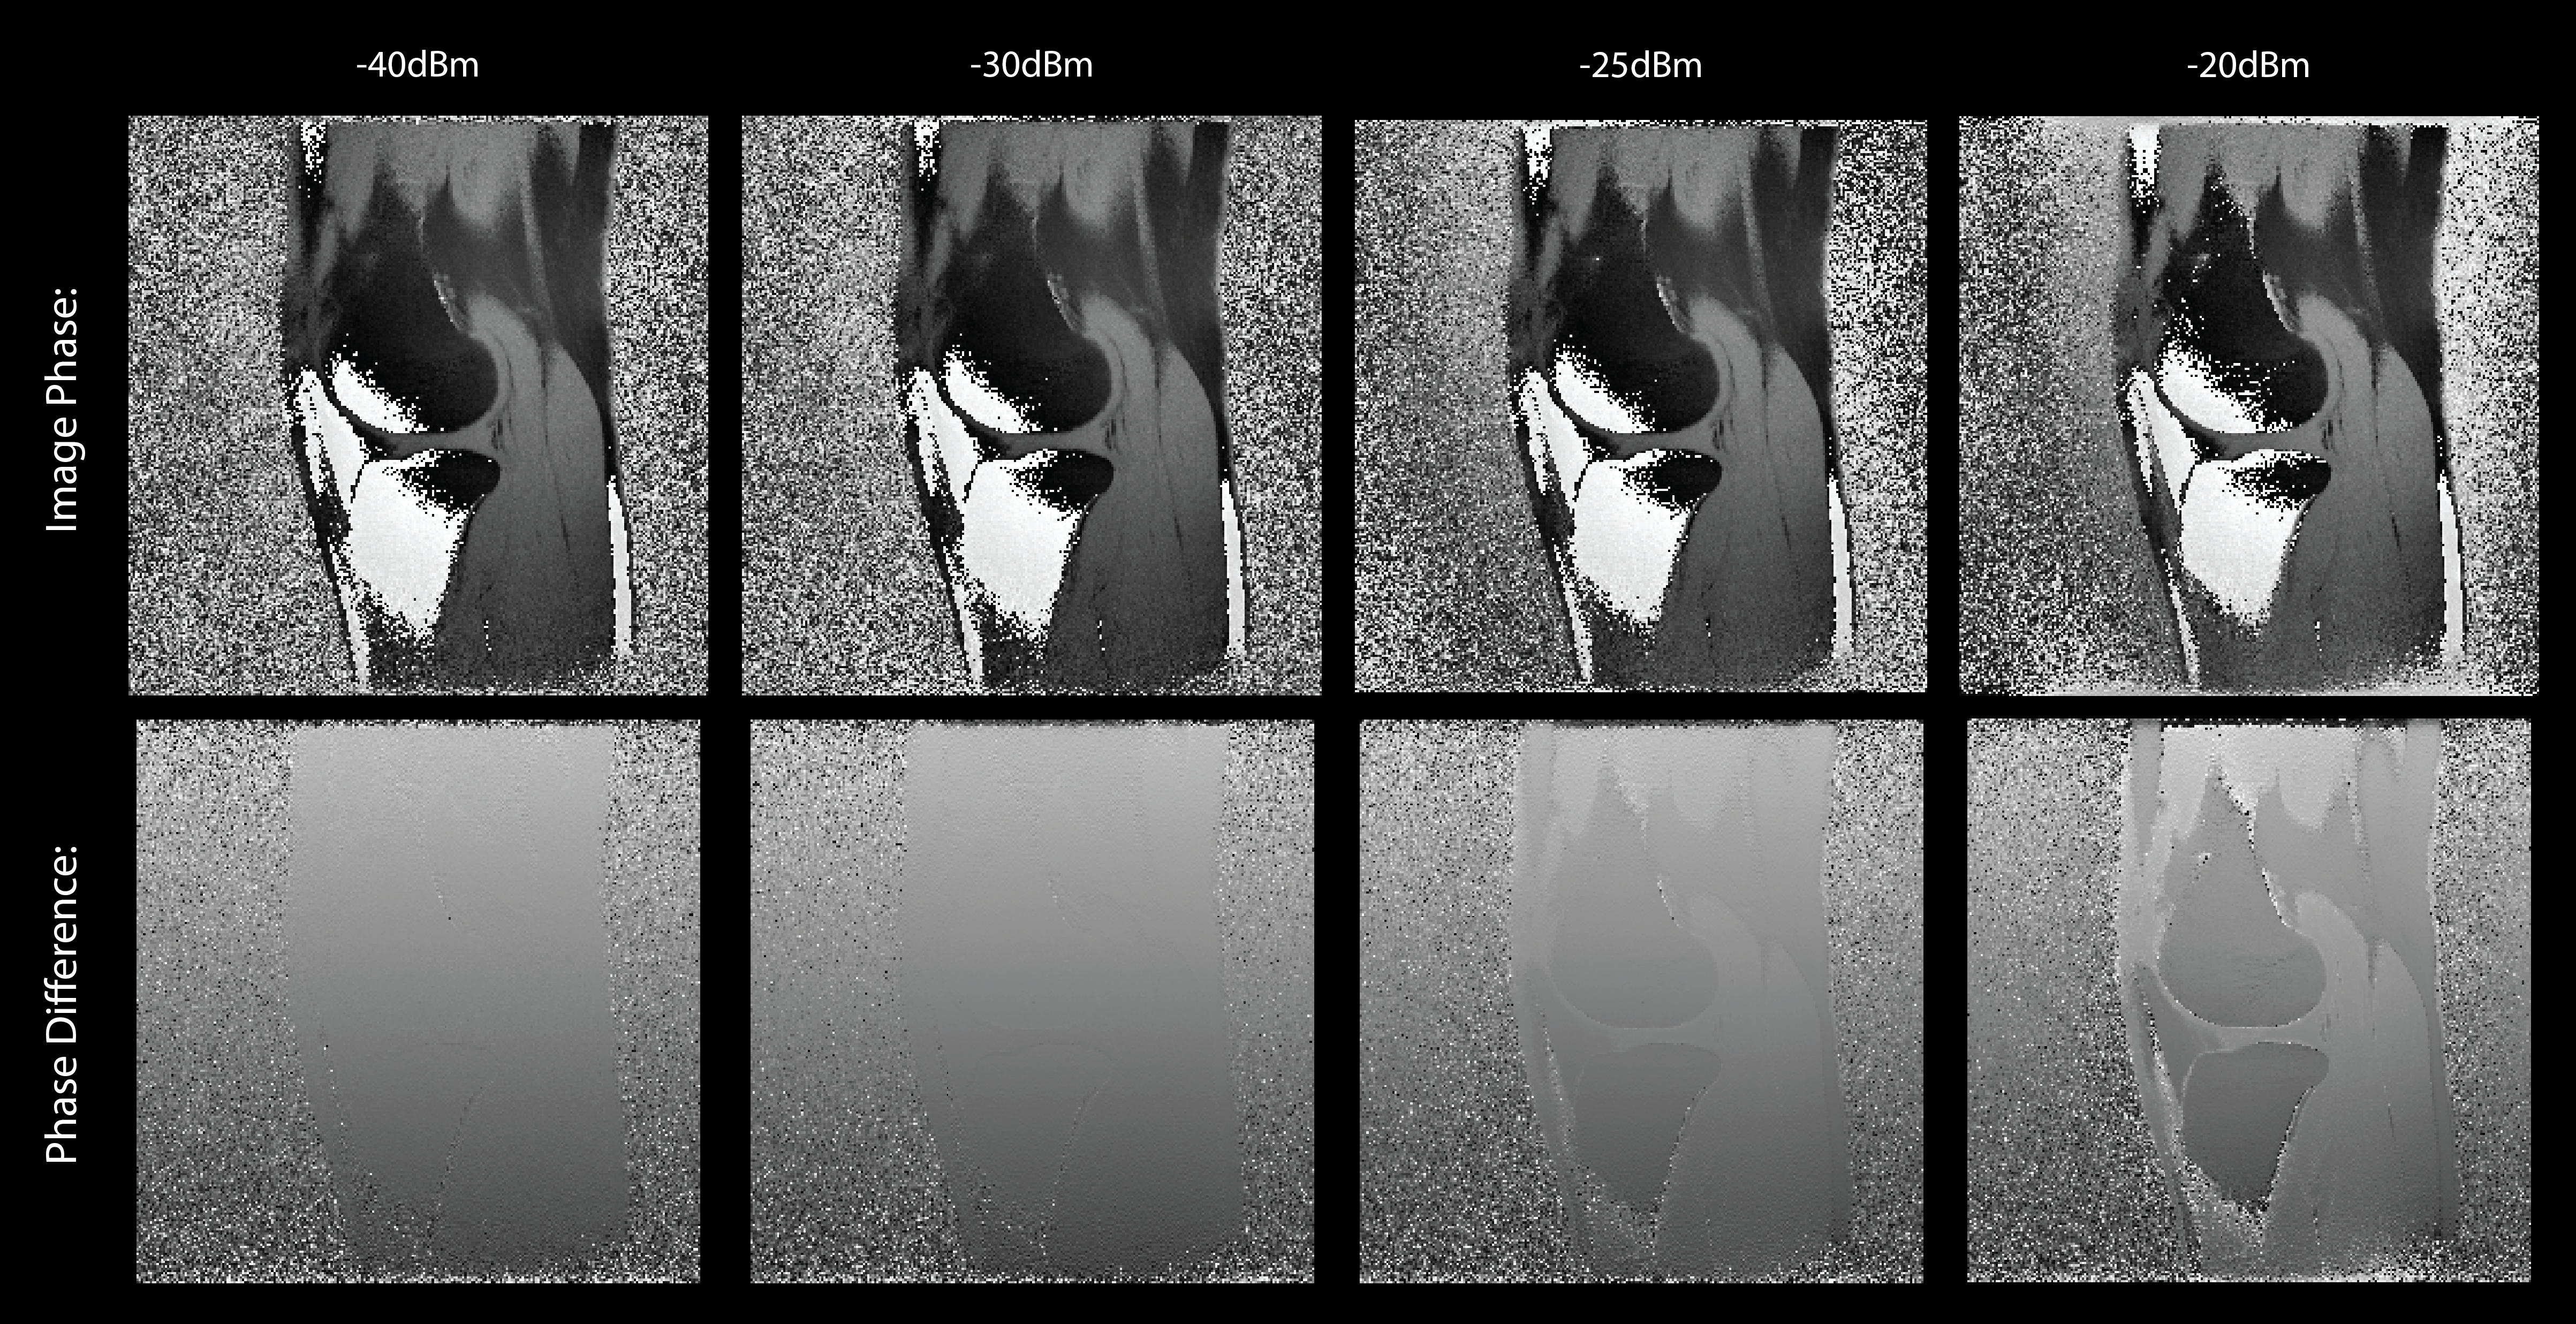
A benchtop test setup was constructed to evaluate the physical effects of device non-linearity on image quality. A pseudo coil signal was generated by proceeding line by line through a reference k-space dataset and quadrature modulating that complex baseband data to 64MHz on an Agilent 33600A Arbitrary Waveform Generator. The reference dataset was a 256x256 FSE knee image with bandwidth of 62.5kHz. Signal amplitude was normalized for the dataset, then scaled to achieve a desired peak output voltage. These signals were applied to the input of the pre-amp. The output of this pre-amp was then demodulated to 10.7MHz via a PE4151 Active Mixer with a LO at 53.3 MHz. The IF signal was bandpass filtered prior to sampling. Data was bandpass-sampled at 10 MS/s by a LT2387-18 ADC driven by the DC2622A driver board. This data was transferred on a line by line basis to a PC via a DC718C Data Acquisition board. A system level description of this system flow is shown in Fig. 2 with images of the benchtop setup shown in Fig. 3. Previous simulation indicated that distortion became evident at peak input powers near -25dBm [3]. Images were collected for peak powers of –40, -30, -25, and –20dBm. For a 50 Ohm system these peak input powers correspond to peak input voltages of 2.54, 7.07, 12.58, and 22.34 mVrms. For reference, a 50 Ohm system with a bandwidth of +/- 250kHz with an input dynamic range of 90dB would result in a peak input –27dBm, or ~10mVrms. In postprocessing, the low-IF data was phase compensated using a per-line calibration tone as reference, down-converted to baseband, down-sampled to match the original sampling rate, and magnitude compensated to offset the effects of the down-sampling anti-aliasing filter. The image was then normalized such that its noise region had a rms magnitude of one, facilitating comparison to the reference image.Results
Shown in Fig. 4 magnitude images display little distortion up to peak inputs of –25dBm, upon which there is a change in image contrast. This change in contrast is exacerbated at –20dBm peak input. Artifacts near the top of the image could be a result of either amplifier distortion or the anti-aliasing compensation mask. When examining the difference in phase to the reference dataset there is a clear difference in regions that align with areas of altered contrast in the magnitude images.Conclusions
A functioning 1.5T pre-amp has been assembled and demonstrated with gain of 17.25dB, noise figure of 0.55dB, and a power consumption of 5.7mW. Image artifacts were introduced near peak input powers of –25dBm likely resulting from input amplitude dependent amplitude distortion or input amplitude dependent phase distortion. This demonstrates the potential impact of low-power device non-linearity on image quality.Future Work
In the large channel count case, the demonstrated amplifier is sufficient because of smaller coil size and the resulting reduced dynamic range. If necessary, these distortions could be eliminated by either: 1) Increasing bias current or 2) Exploring post-processing techniques to identify system non-linearity and compensate for them.Acknowledgements
We would like to thank GE Healthcare for their research support. This project is supported by NIH grants R01EB019241 and U01EB029427References
[1] K. Byron, S. A. Winkler, F. Robb, S. Vasanawala, J. Pauly and G. Scott, "An MRI Compatible RF MEMs Controlled Wireless Power Transfer System," in IEEE Transactions on Microwave Theory and Techniques, vol. 67, no. 5, pp. 1717-1726, May 2019.
[2] D. I. Hoult and G. Kolansky, A Magnetic-Field-Tolerant Low-Noise SiGe Pre-amplifier and T/R Switch, Proc. Intl. Soc. Mag. Reson. Med. 18 (2010)
[3] C. Vassos, F.Robb, S.Vasanawala, J.Pauly and G.Scott, Harmonic Balance Modeling of MRI Preamp Impairments, Proc. Intl. Soc. Mag. Reson. Med. 28 (2020)
[4] Kang, S., Choi, B., Kim, B. (2003). Linearity analysis of CMOS for RF application IEEE Transactions on Microwave Theory and Techniques 51(3), 972-977.
[5] Roemer, P. B., Edelstein, W. A., Hayes, C. E., Souza, S. P. and Mueller, O. M. (1990), The NMR phased array. Magn Reson Med, 16: 192-225.
Figures