4271
Quantification of HD-EEG net attenuation on 18F-FDG static PET: a phantom and human brain study
Erica Silvestri1,2,3, Marco Castellaro1,4, Alessandra Zorz5, Andrea Bettinelli 1,5, Cristina Campi6, Marta Paiusco5, Diego Cecchin2,7, and Alessandra Bertoldo1,2
1Department of Information Engineering, University of Padova, Padova, Italy, 2Padova Neuroscience Center, University of Padova, Padova, Italy, 3Department of Neuroscience, University of Padova, Padova, Italy, 4Department of Neurosciences, Biomedicine and Movement Sciences, University of Verona, Verona, Italy, 5Department of Medical Physics, Veneto Institute of Oncology IOV - IRCCS, Padova, Italy, 6Department of Math, University of Padova, Padova, Italy, 7Department of Medicine, Unit of Nuclear Medicine, University of Padova, Padova, Italy
1Department of Information Engineering, University of Padova, Padova, Italy, 2Padova Neuroscience Center, University of Padova, Padova, Italy, 3Department of Neuroscience, University of Padova, Padova, Italy, 4Department of Neurosciences, Biomedicine and Movement Sciences, University of Verona, Verona, Italy, 5Department of Medical Physics, Veneto Institute of Oncology IOV - IRCCS, Padova, Italy, 6Department of Math, University of Padova, Padova, Italy, 7Department of Medicine, Unit of Nuclear Medicine, University of Padova, Padova, Italy
Synopsis
Simultaneous trimodal EEG-PET-MR imaging can be a tool to delve deeper in the healthy human brain functioning. One of the aspects scarcely investigated is the interplay between HD-EEG net and PET signal detection and reconstruction. In this work, we assess the impact of HD-EEG on both attenuation corrected (AC) and non-attenuation corrected (NAC) PET images. We found that HD-EEG net attenuates PET signal in NAC images in both phantom and human brain, respectively of 3.01%(±3.69%) and of 0.53%(±5.89%). AC images show an opposite behaviour: attenuation correction factor tends to be overestimated in CT- and UTE-derived UMAP obtained with HD-EEG net.
Introduction
Simultaneous trimodal EEG-PET-MRI imaging has become possible after the introduction of hybrid PET-MRI scanners. This multimodal imaging technique can be an useful tool to both delve deeper in the healthy human brain functioning [1] and study the effects of several pathologies [2],[3]. One of the aspects that has been scarcely investigated is that the introduction of a high-density EEG net (HD-EEG) into a PET/MRI system could alter the MR field homogeneity [4] and attenuate the PET signal, as reported for low-density EEG net [5],[6]. In this study, we used human and phantom data to quantify the impact of HD-EEG net on static 18F-FDG PET images.Methods
Imaging data were acquired on both phantom and human brain in two different configurations (Figure 1): with (wiNET) and without (woNET) the HD-EEG net (256 channels, MR-compatible HydroCel Geodesic Sensor Net from Electrical Geodesic, Inc.).Phantom data: a commercially available anatomical brain phantom with realistic brain contour (RSD striatal phantom, http://rsdphantoms.com/nuclear-medicine/striatal-phantoms-for-cardiac-spec-pet/) homogeneously filled in the non-striatal compartment with a 18F-FDG solution (49 MBq) was used. The phantom was scanned with a Philips Ingenuity TF PET/CT system. For each configuration, a high-resolution CT image (voxel size 1.17x1.17x0.64mm3) and a 20 minutes list mode acquisition was performed. PET images were reconstructed on the scanner using an iterative OP-OSEM algorithm, including scatter, decay and dead time correction (voxel size 2x2x2mm3). To evaluate the attenuation correction impact, wiNET and woNET images were reconstructed both including (AC) and excluding (NAC) this step. For each configuration, the CT-derived attenuation map (UMAP) relevant to that acquisition was used, i.e. the wiNET AC image was reconstructed employing a UMAP in which the HD-EEG wires and electrodes were present.
Human data: a 65 years old woman with suspected dementia (and no appreciable brain atrophy) underwent a simultaneous PET/MRI scan on a 3T Siemens Biograph mMR system. The patient was injected with 261 MBq of 18F-FDG and scanned in both configurations. For each configuration, the imaging protocol included a 10 minutes list mode PET acquisition, a T1w MPRAGE sequence (TR/TE 2400/3.24ms; TI 1000ms; 1x1x1mm3) and a UTE sequence (TR/TE1/TE2 4.64/0.07/2.46ms; 1.56x1.56x1.56mm3). As for the phantom, AC and NAC PET images were reconstructed on the scanner using the iterative OP-OSEM algorithm (voxel size 2.08x2.08x2.00mm3). The attenuation correction step was performed with the acquisition relevant UTE-derived UMAP.
The image pre-processing consisted of an affine registration between the wiNET and the woNET PET image. For both phantom and human data, the affine transformation was estimated on NAC images using ANTs [7], and applied to NAC and AC images, and to the employed UMAP respectively.
Phantom data has been considered as absolute counts, whereas regarding human data we computed the standard uptake volume ratio (SUVR), considering the brainstem as reference region and using the Hammersmith atlas [8] for segmentation purposes.
To quantify the impact of the HD-EEG, the relative difference map has been computed as the difference between the woNET and the wiNET images normalized by the woNET image. A brain mask was applied to the maps before computing statistics in both phantom and human brain.
Results
The distribution of percentage relative differences (Figure 2) resulted to be not gaussian (Lillie test, p<0.001): findings are reported in terms of median and mean absolute deviation.In NAC images, a positive relative difference between without and with EEG net, has been found in both phantom and human brain, respectively of 3.01% (±3.69%) and of 0.53% (±5.89%). In AC images, a negative relative difference has been found in both phantom and human brain, respectively of -3.10% (±4.59%) and -3.21% (±5.98%).
In Figure 3 are shown the coronal, sagittal and axial views of AC and NAC relative difference maps of the two datasets. By visual inspection, no clear spatial pattern has been evidenced.
Discussion and Conclusions
The small positive relative differences found in the NAC images demonstrate that, although with limited extent, the presence of the HD-EEG attenuates the PET signal with a lost in counts or SUVR relative to the phantom or brain alone, which is in line with previously findings obtained in human brain with low-density EEG nets [6] and in homogeneous phantom with HD-EEG [4]. On the contrary, the small negative differences in the AC images could be ascribed to a bias in both CT- and UTE-derived UMAP obtained when HD-EEG net is used. Indeed, as reported in [9],[10], the presence of metallic implants leads to an overestimation of counts in PET/CT imaging, whereas, in PET/MRI, the UTE-derived UMAP are sensible to field inhomogeneities potentially generated by wire bundles and electrodes. As shown in Figure 4, in human data we found an increase in the skull bone thickness in wiNET UMAP when compared with woNET UMAP.Trimodal imaging is a potential tool, however, when performing these studies, it is necessary to consider that PET signal is slightly attenuated by HD-EEG, and that in-scanner reconstruction of PET images in presence of HD-EEG could be affected by the alterations of the estimated attenuation map.
Acknowledgements
No acknowledgement found.References
- Shah NJ, Arrubla J, Rajkumar R, et al. Multimodal Fingerprints of Resting State Networks as assessed by Simultaneous Trimodal MR-PET-EEG Imaging. Sci Rep. 2017;7(1):1-13. doi:10.1038/s41598-017-05484-w
- Del Guerra A, Ahmad S, Avram M, et al. TRIMAGE: A dedicated trimodality (PET/MRI/EEG) imaging tool for schizophrenia. Eur Psychiatry. 2018; 50:7-20. doi:10.1016/j.eurpsy.2017.11.007
- Golkowski D, Merz K, Mlynarcik C, et al. Simultaneous EEG–PET–fMRI measurements in disorders of consciousness: an exploratory study on diagnosis and prognosis. J Neurol. 2017;264(9):1986-1995. doi:10.1007/s00415-017-8591-z
- Sander CY, Catana C, Zhu A, Poulsen C, Rosen BR, Bonmassar G. Invisible dense-array EEG net for simultaneous EEG-PET-MRI imaging. In: Proc. Intl. Soc. Mag. Reson. Med. Vol 22; 2014:6598.
- Lemmens C, Montandon ML, Nuyts J, Ratib O, Dupont P, Zaidi H. Impact of metal artefacts due to EEG electrodes in brain PET/CT imaging. Phys Med Biol. 2008;53(16):4417-4429. doi:10.1088/0031-9155/53/16/013
- Rajkumar R, Kops ER, Mauler J, et al. Simultaneous trimodal PET-MR-EEG imaging: Do EEG nets generate artefacts in PET images? PLoS One. 2017;12(9):1-16. doi:10.1371/journal.pone.0184743
- Avants BB, Epstein CL, Grossman M, Gee JC. Symmetric diffeomorphic image registration with cross-correlation: Evaluating automated labeling of elderly and neurodegenerative brain. Med Image Anal. 2008;12(1):26-41. doi:10.1016/j.media.2007.06.004
- Hammers A, Allom R, Koepp MJ, et al. Three-dimensional maximum probability atlas of the human brain, with particular reference to the temporal lobe. Hum Brain Mapp. 2003;19(4):224-247. doi:10.1002/hbm.10123
- Kamel EM, Burger C, Buck A, von Schulthess GK, Goerres GW. Impact of metallic dental implants on CT-based attenuation correction in a combined PET/CT scanner. Eur Radiol. 2003;13(4):724-728. doi:10.1007/s00330-002-1564-2
- Harnish R, Prevrhal S, Alavi A, Zaidi H, Lang TF. The effect of metal artefact reduction on CT-based attenuation correction for PET imaging in the vicinity of metallic hip implants: A phantom study. Ann Nucl Med. 2014;28(6):540-550. doi:10.1007/s12149-014-0844-7
Figures
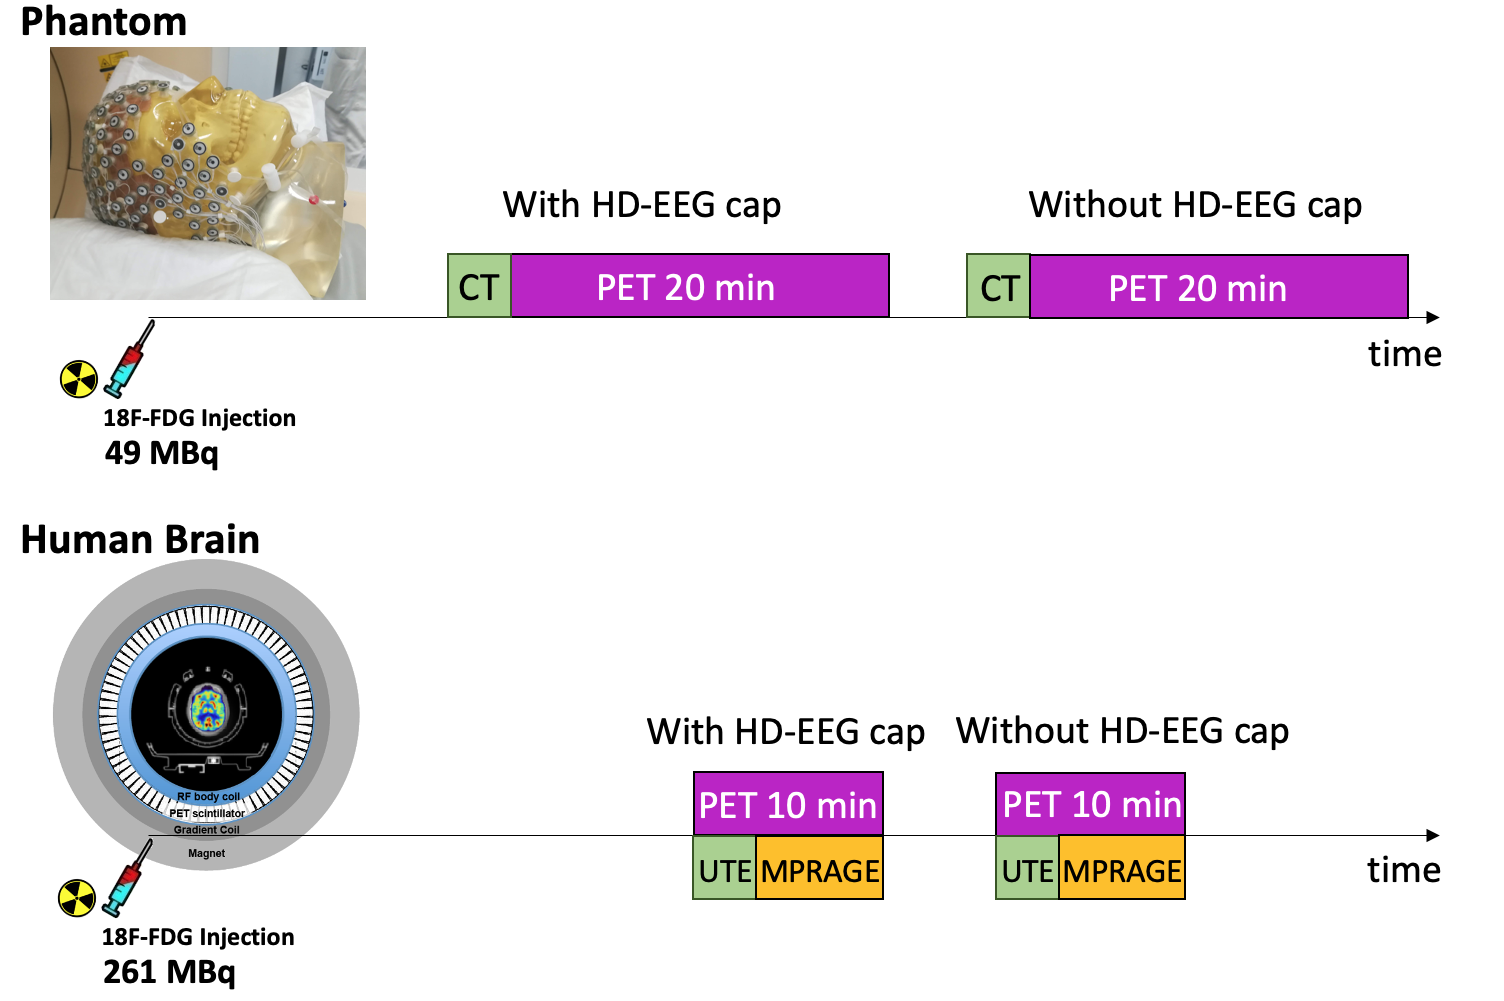
Figure 1: Schematic representation of the two acquisition protocols.
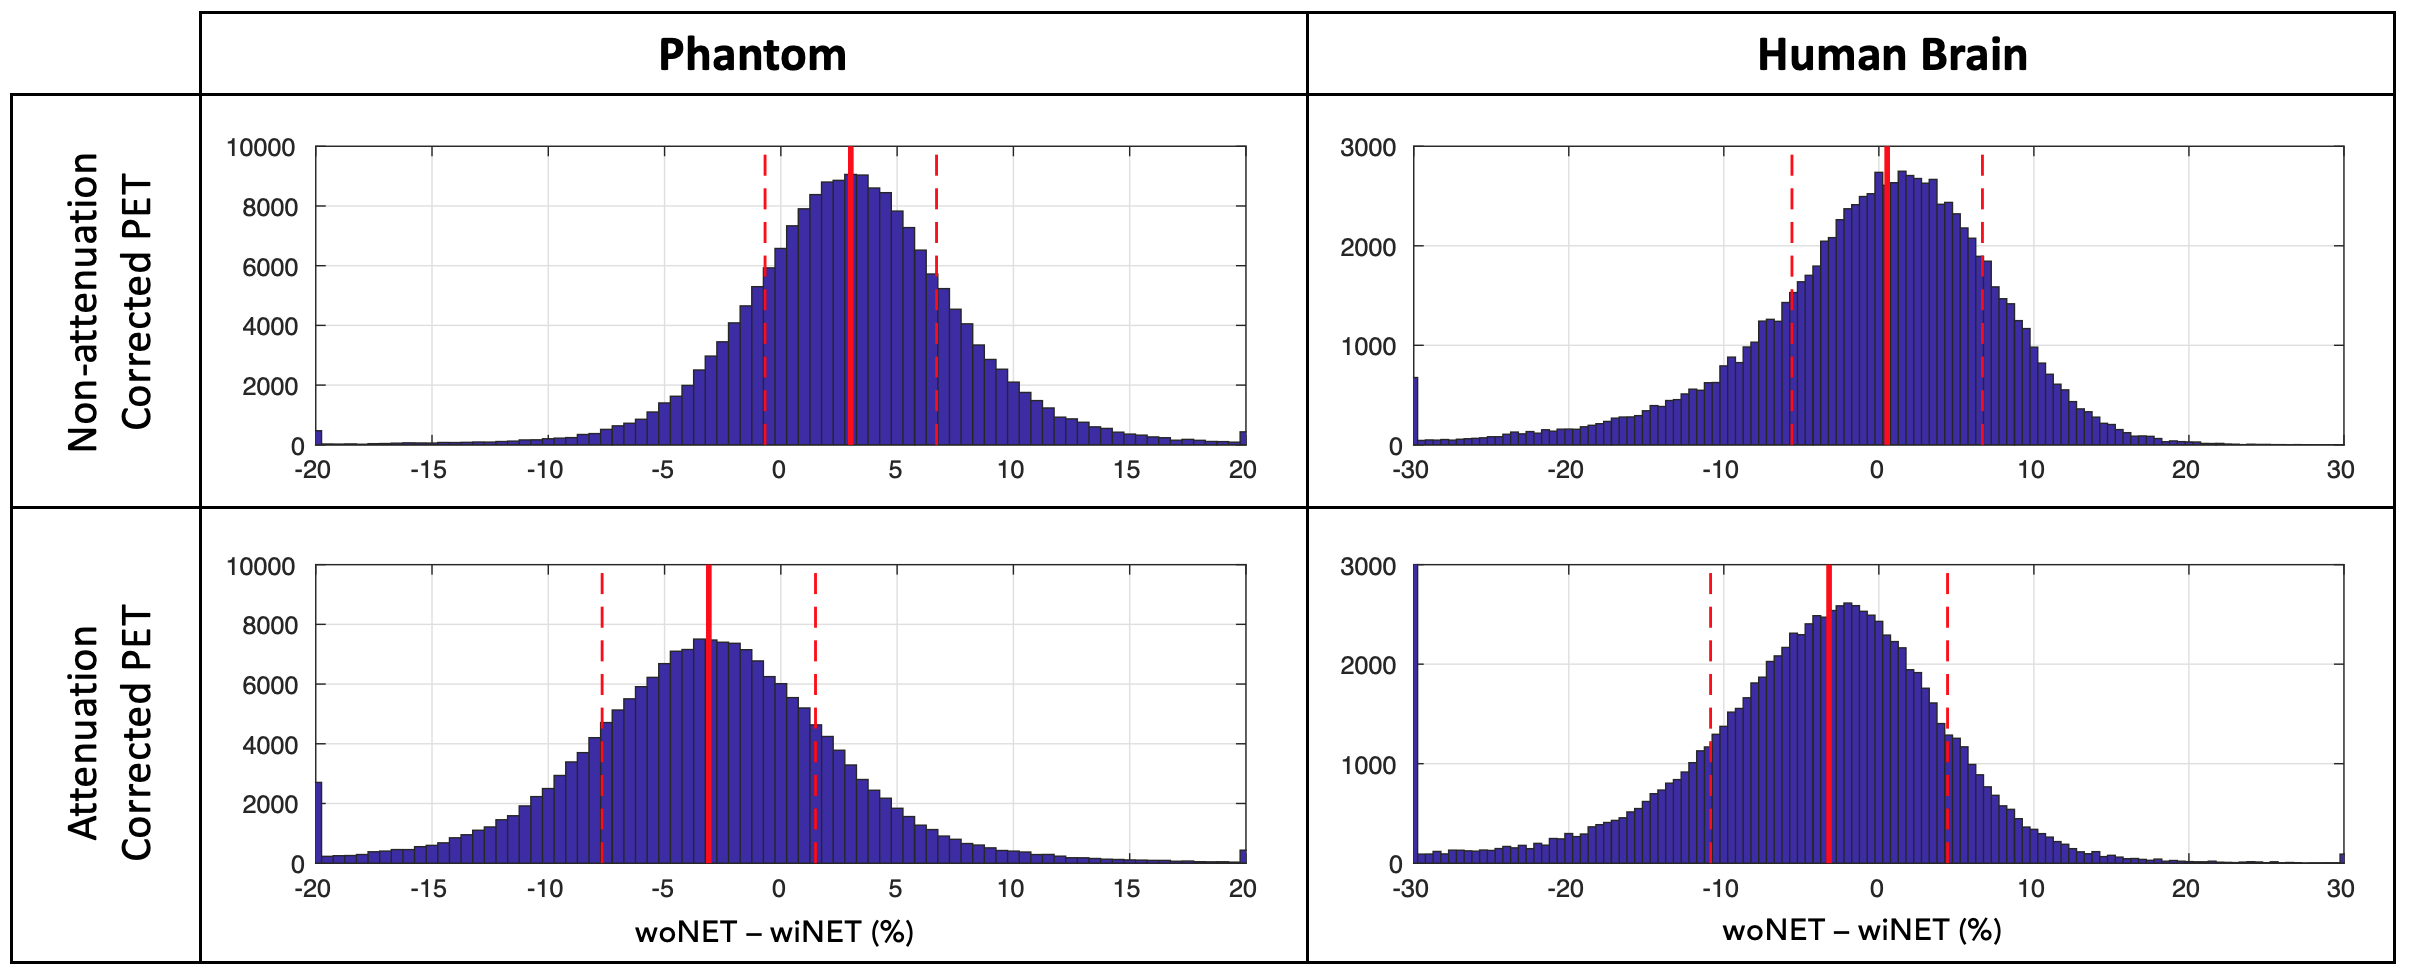
Figure 2: Histograms of relative % differences between PET images acquired with and without HD-EEG net in phantom and human data. The median value of each distribution is reported in red solid line, the mean absolute deviation from median value in dashed red line.
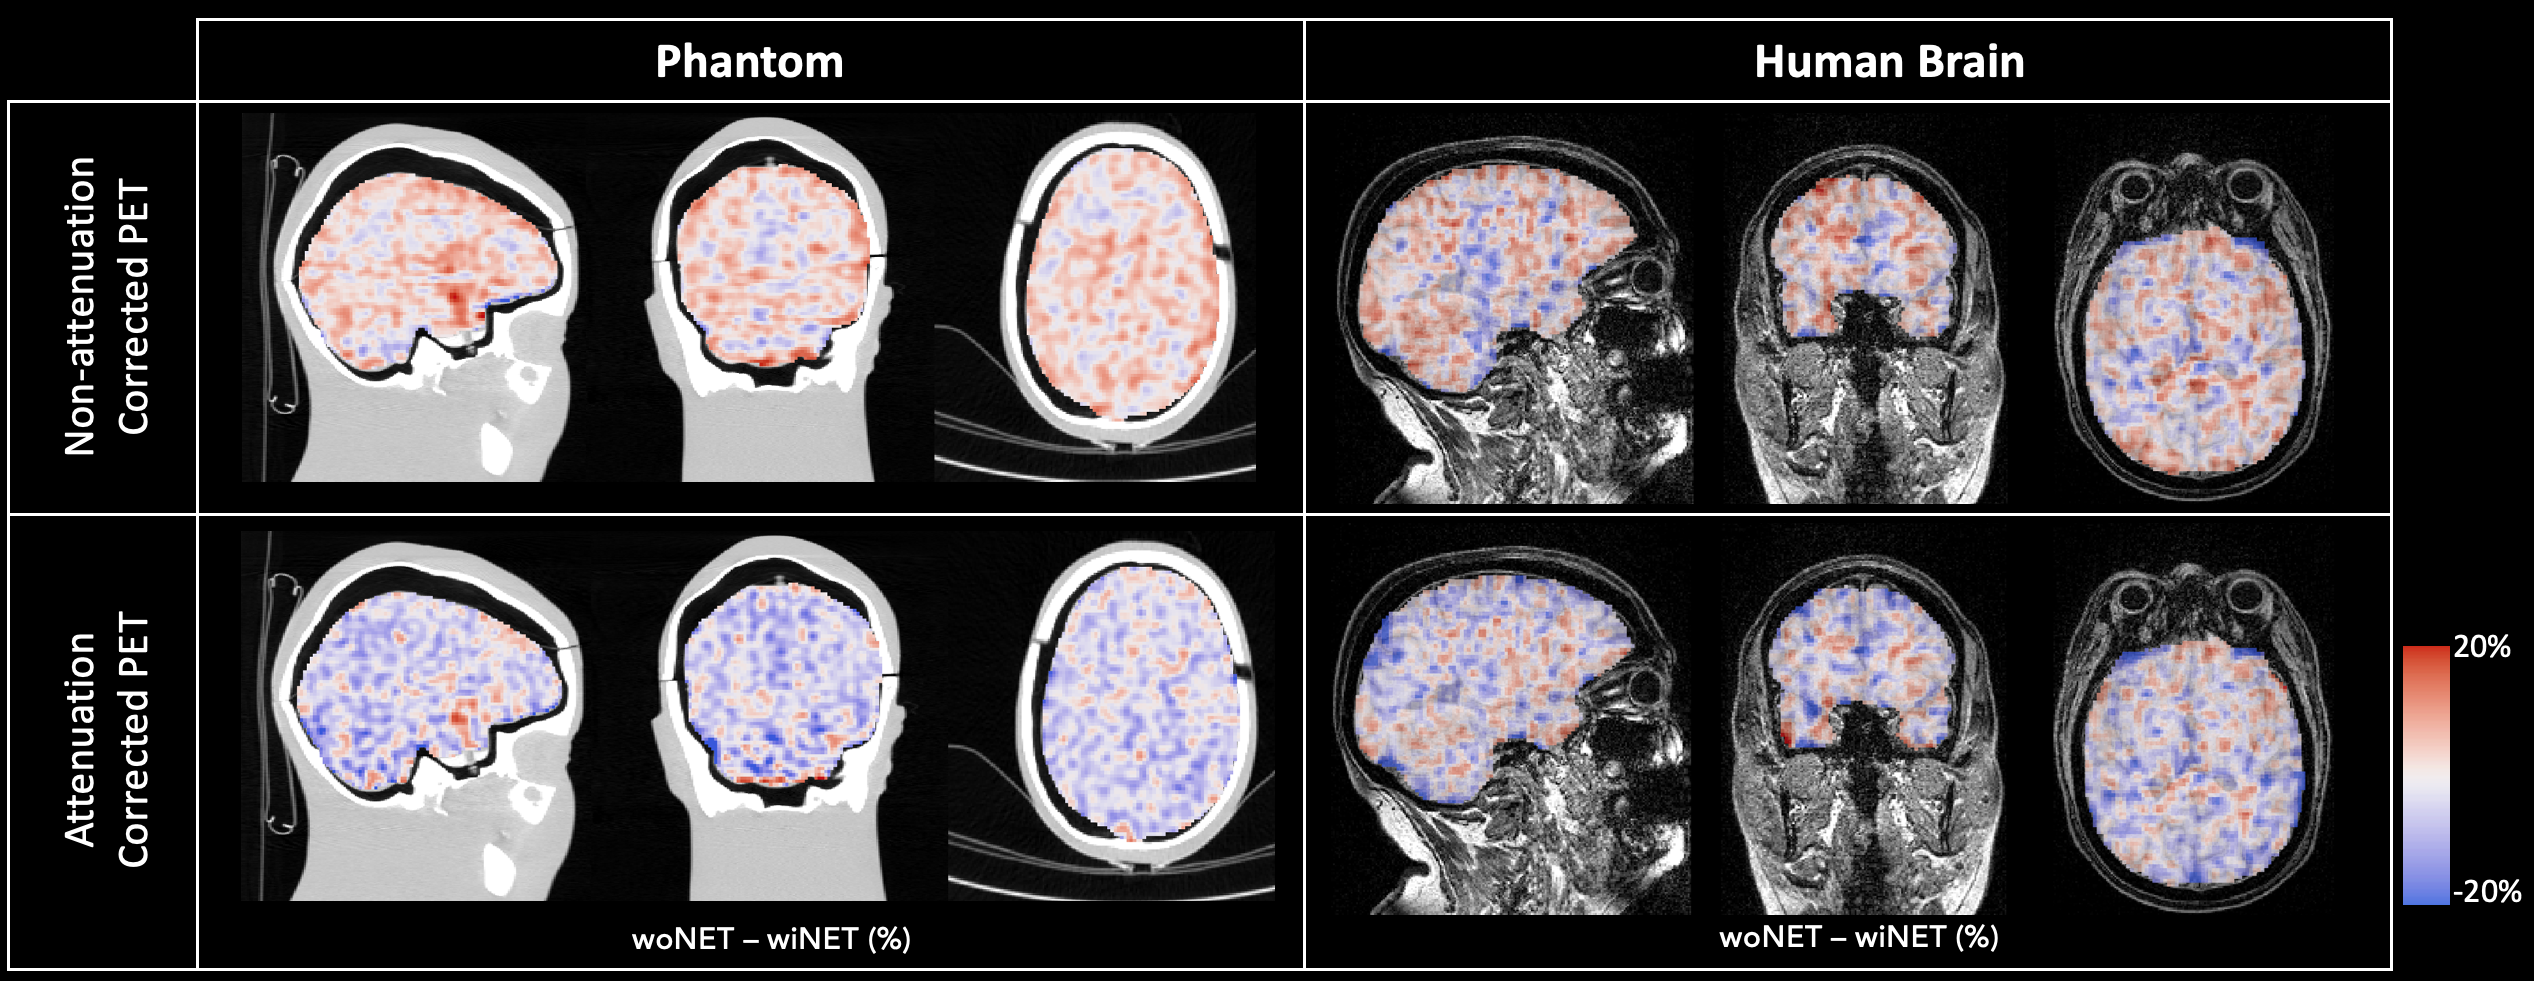
Figure 3: Spatial pattern of relative % differences between PET images acquired with and without HD-EEG net (blue-red scale) over-imposed on phantom CT image or human brain T1w MPRAGE image (grey scale).
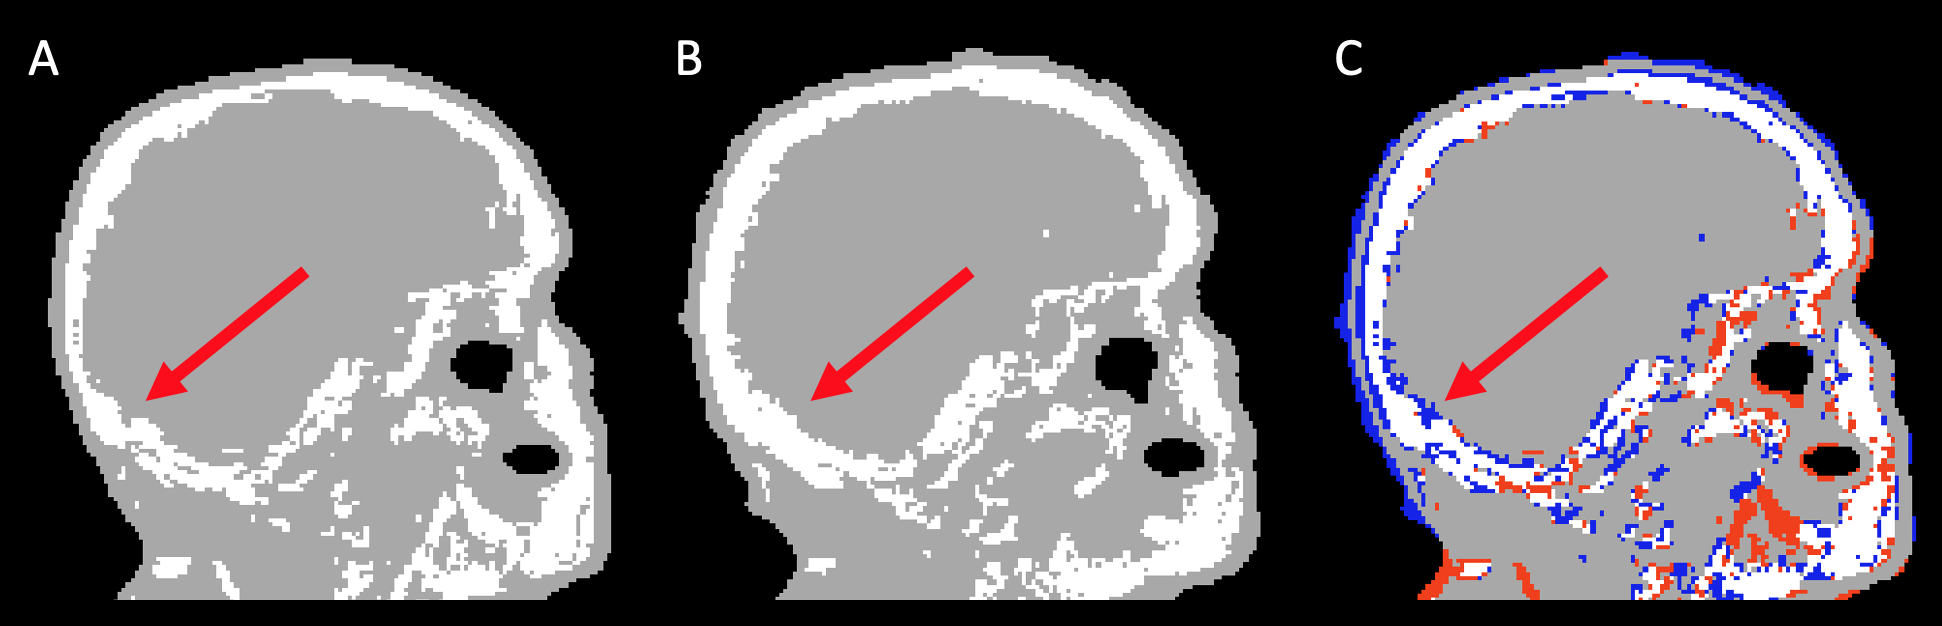
Figure 4: Human brain UTE-derived attenuation correction map (UMAP): without HD-EEG net (panel A), with HD-EEG net (panel B), and differences between without and with HD-EEG net over-imposed to without HD-EEG net UMAP (blue= negative values, red = positive values). Red arrows indicate the area where bone thickness differences are more evident.