4256
Diffusion changes in prostate cancer patients undergoing radiation treatment on an MR-Linac system: Preliminary findings1Odette Cancer Centre, Sunnybrook Research Institute, Toronto, ON, Canada, 2Medical Biophysics, University of Toronto, Toronto, ON, Canada, 3Department of Radiation Oncology, Sunnybrook Health Sciences Centre, Toronto, ON, Canada, 4Department of Radiation Oncology, University of Toronto, Toronto, ON, Canada
Synopsis
Eight prostate cancer patients undergoing radiation treatment were scanned on an MR-Linac with conventional ADC and high-b diffusion protocols at each of five treatment fractions. With the system’s weaker gradients and longer echo times, 6/8 patients had visible lesions at the maximum b-value of 2000 s/mm2. Fits to the VERDICT model demonstrated higher intracellular fraction in the lesion, inversely correlated with ADC. In three patients, ADC increased starting at the third treatment time point; a fourth patient exhibited a transient ADC increase. Future work will correlate these changes with biochemical recurrence to test their relevance as a biomarker.
INTRODUCTION
Approximately 35% of patients undergoing conventional radiation therapy (RT) for prostate cancer experience recurrence, as measured by rising prostate specific antigen (PSA) levels1. Early imaging biomarkers of response would be useful for monitoring treatment and escalating dose in non-responding patients, but studies are frequently limited to single time points post-therapy. The MR-Linac offers a unique opportunity to acquire imaging data throughout the course of RT. However, MR-Linac gradients are weaker than in a conventional MRI system, leading to longer echo times and reduced signal-to-noise ratio (SNR) in diffusion MRI. Here, we examine diffusion data from the MR-Linac in prostate cancer patients with a focus on two research questions:- Is a protocol incorporating high b-values (2000 s/mm2) feasible on the MR-Linac system?
- Are there significant changes in diffusion parameters from ADC, intravoxel incoherent motion (IVIM) and Vascular Extracellular and Restricted DIffusion for Cytometry in Tumours (VERDICT) models during treatment?
METHODS
PatientsTwelve patients with intermediate risk prostate cancer were scanned prior to stereotactic body RT to the prostate in 40 Gy in 5 fractions. Eight patients had an MR-visible dominant intraprostatic lesion (DIL); the remaining four patients were excluded from analysis. One patient had incomplete data for two treatment time points.
Data Acquisition
Scans were conducted on an Elekta MR-Linac (Philips 1.5 T magnet, 4-channel posterior + 4-channel anterior receive coils, Gmax=15 mT/m). Multi-slice diffusion with EPI readout and 12 b-values (0-1000 s/mm2, TE=87 ms, 3x3x5 mm3) was acquired for ADC and IVIM analysis. Additional scans for VERDICT analysis were: (i) a high-b scan (b=0, 1500, 2000 s/mm2; TE=104 ms) and (ii) five scans with varying diffusion times and TEs (b/TE=90/53, 500/75, 1500/99, 1500/110, 2000/107). Total diffusion scan time was 21 minutes.
Standard T2-weighted imaging (turbo spin echo, 0.5x0.5x3 mm3, TE = 110 ms, TR = 4.7 s) was performed for treatment planning.
Analysis
Motion was corrected using 3D non-rigid registration of the b=0 images2 (NiftyReg) and the resulting deformation field was applied to subsequent diffusion-weighted images. Treatment time points 2-5 were then registered to the first treatment time point.
Diffusion signals were normalized to the corresponding b=0 data to account for TE differences and fitted voxelwise using an iterative maximum likelihood procedure that accounts for Rician noise. The ADC was fitted with a monoexponential model to yield the ADC. For IVIM, a bi-exponential model3 fitted for the pseudodiffusion fraction (fp) and tissue diffusion coefficient (Dt) with pseudodiffusion coefficient fixed (Dp=30 μm2/ms) . For VERDICT modelling4,5, a pseudodiffusion compartment to represent the vascular space (fixed Dp=30 μm2/ms), a tortuosity model for the extracellular space and a spherical restriction for the intracellular space (fixed Dfree=2 μm2/ms) generated fit parameter values for the pseudodiffusion fraction (fp), intracellular fraction (fI) and radius of the restricted spheres (R).
Regions of interest (ROIs) were drawn on the b=1500 s/mm2 (TE=99 ms) image with reference to the T2 scan and ADC map. Parameter values within each ROI were compared with those from the scan preceding the first treatment using a two-tailed t-test. A p-value of 0.008 (0.05/6 parameter comparisons) was considered significant. Pearson’s correlation was used to examine the relationship between parameters.
RESULTS
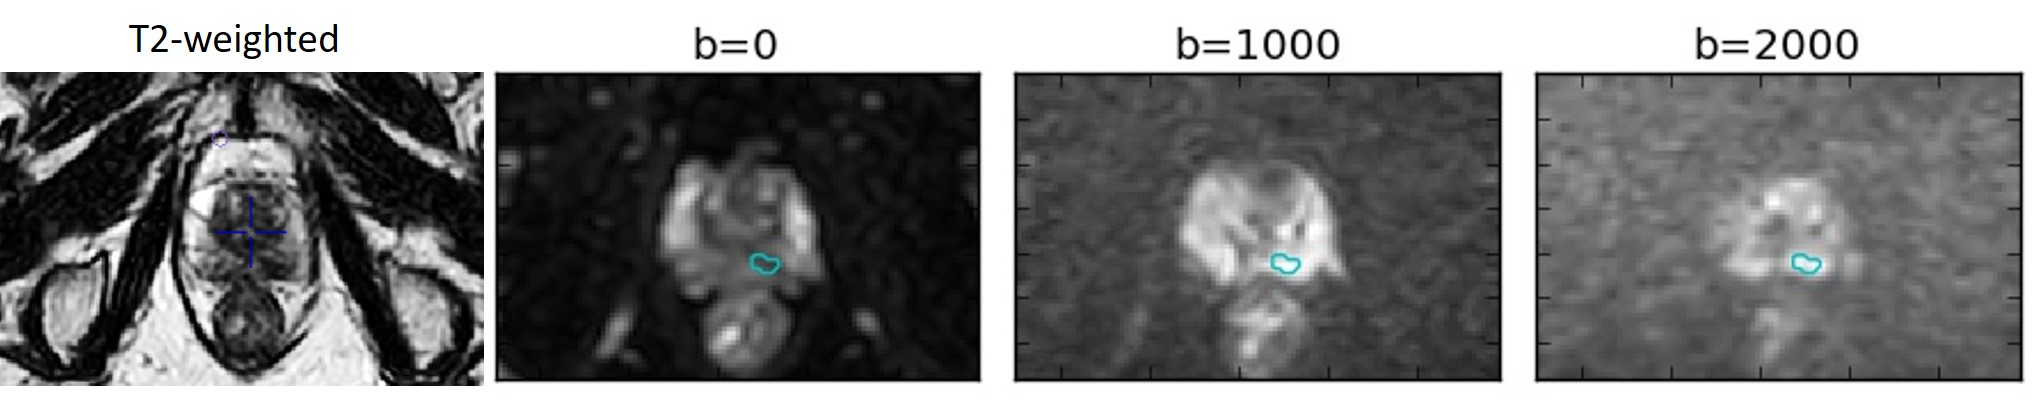
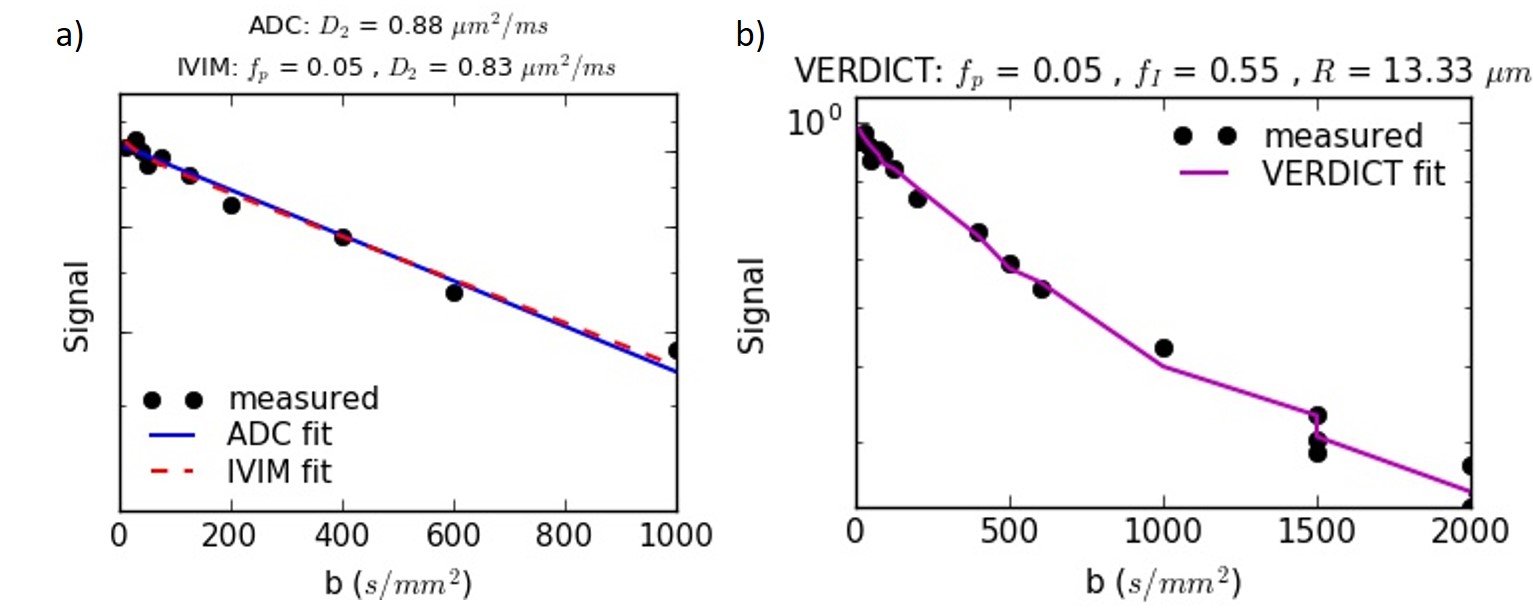
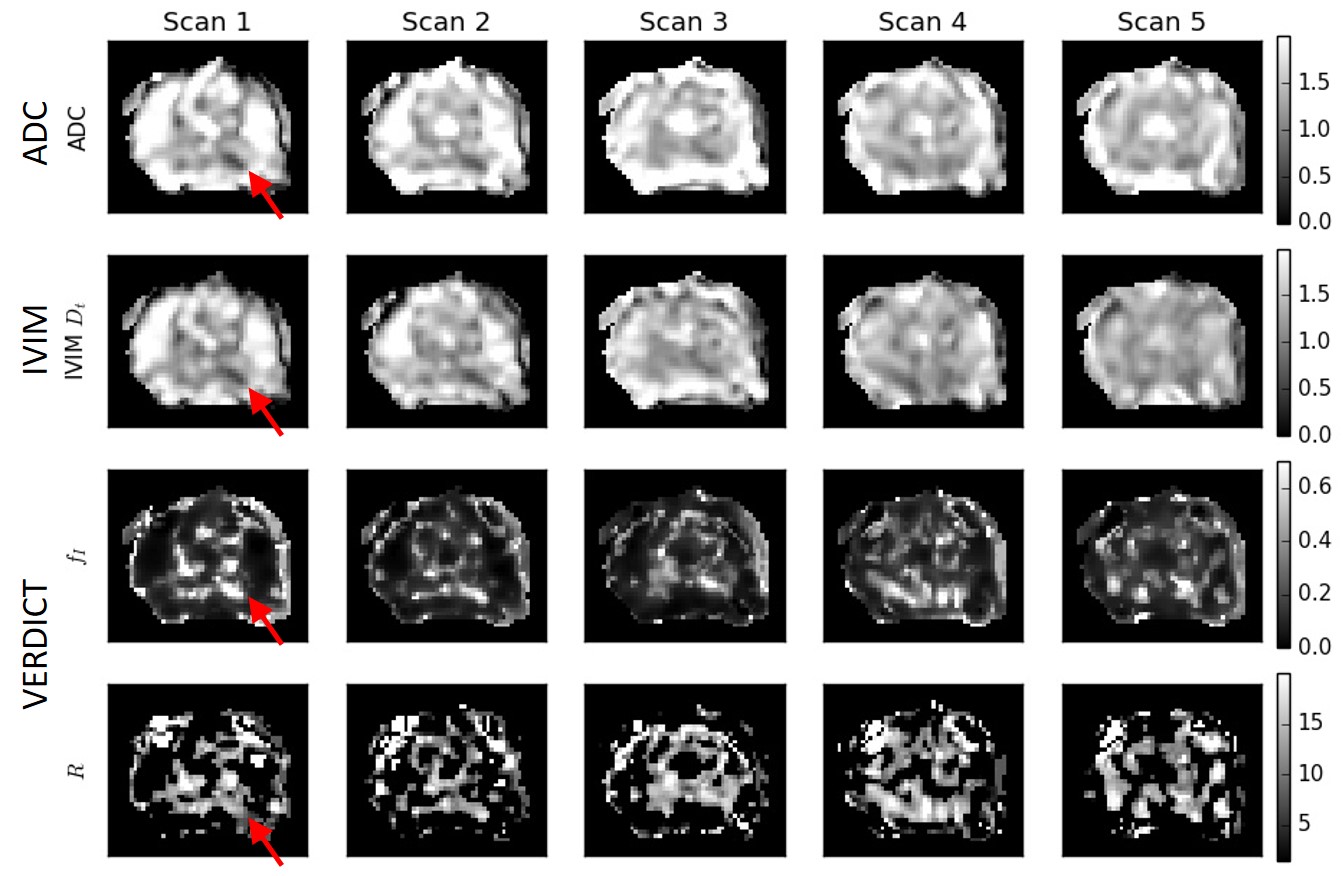
Example diffusion images are shown in Figure 1 and fits in Figure 2. The mean SNR in the ROI for b=2000 s/mm2 was 3.1 (range 1.9-4.9).Figure 3 shows parameter maps for one patient over the course of treatment.
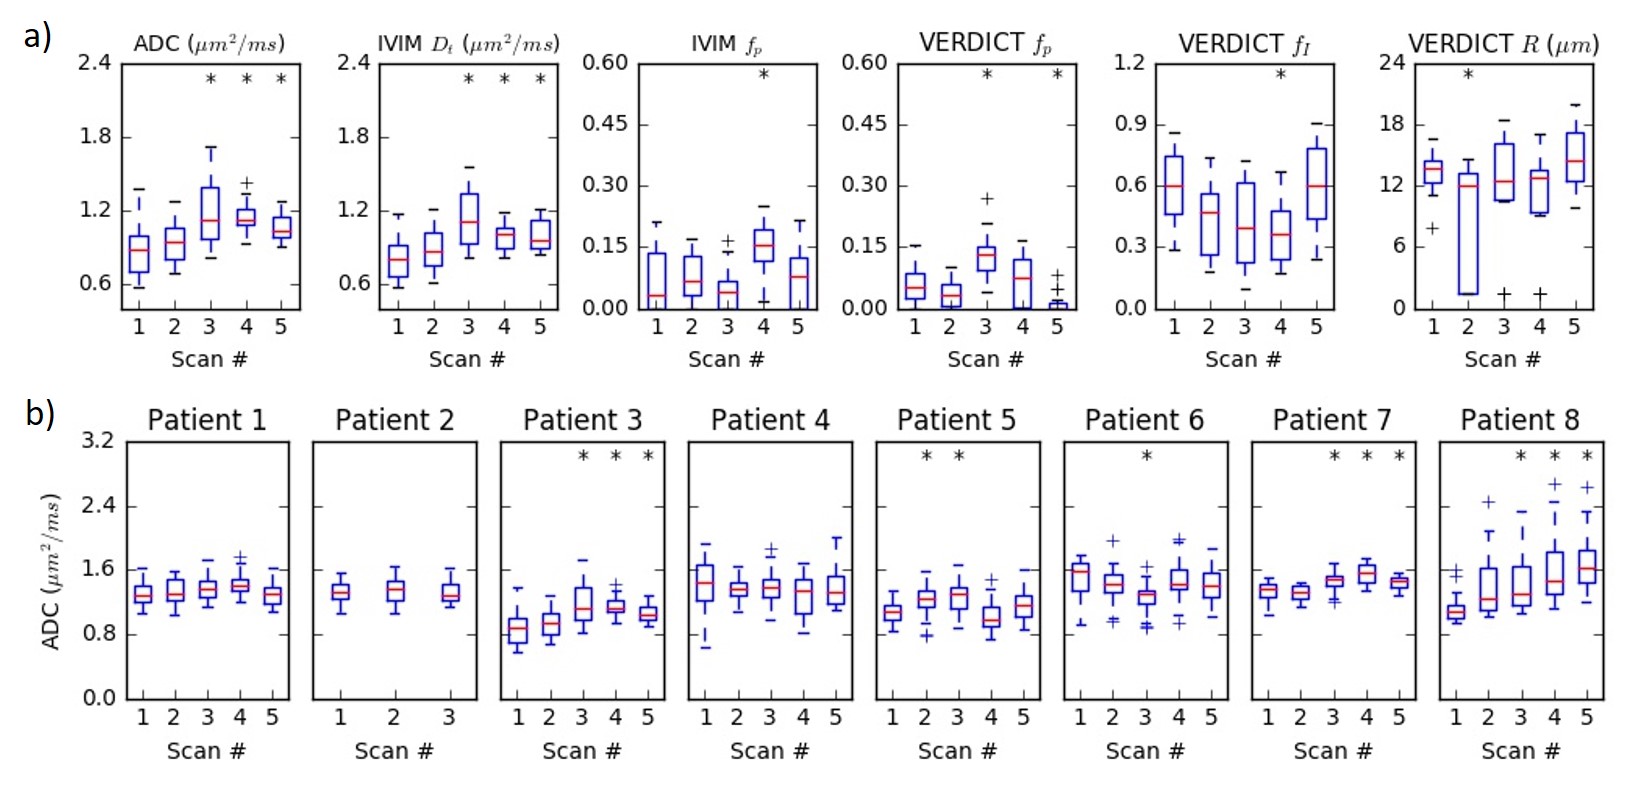
Figure 4a shows parameter changes in the ROI throughout treatment in one patient. The change in ADC throughout treatment for all eight patients is summarized in Figure 4b. Three patients demonstrated statistically significant increases in ADC as early as the third time point. The ADC increased in scans 2-3 in one additional patient before moving back toward baseline. The final four patients (including one with incomplete data) did not demonstrate any consistent change in ADC.
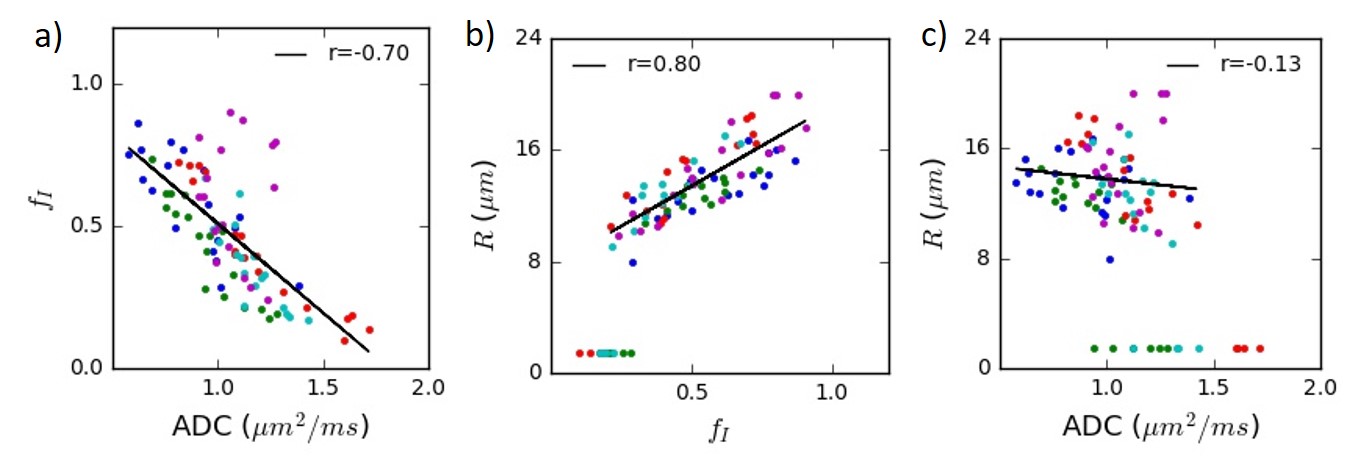
Figure 5 demonstrates the correlation between selected model parameters in a representative patient.
DISCUSSION AND CONCLUSIONS
The ADC and VERDICT fI values on the MR-Linac are similar to those from previous studies at 3 T6. This is a key finding given the weaker gradients on the MR-Linac, which necessitated longer echo times and a protocol limited to a maximum b-value of 2000 s/mm2 (compared to 3000 s/mm2 in the original VERDICT prostate protocol6). We varied TE in order to acquire b=1500 s/mm2 with different diffusion times and these demonstrated the expected variation for restricted diffusion (Figure 2b), assuming a monoexponential T2. The correlation between ADC and fI confirms previous findings5 and suggests that the intracellular fraction is a main contributor to ADC in prostate, which has potential as an indicator of cell death and early radiation response. The low correlation between ADC and radius R may indicate additional information at high b-values but the effects of noise on this parameter must be considered. The R parameter is difficult to determine at lower intracellular fractions, which may be more common when cell death is induced by treatment.Three patients demonstrated significant increases in ADC during the course of treatment. Future work will involve correlating clinical outcomes such as PSA response and subsequent biochemical recurrence with early changes in diffusion.
Acknowledgements
We would like to thank the MR-Linac radiation therapists assistance with scanning and Mikki Campbell for co-ordinating patient recruitment. CB’s work is supported in part by the Sunnybrook Foundation and protocol development was based on work conducted with funding from Prostate Cancer Canada.References
1. Viani GA, Stefano EJ, Afonso SL. Higher-Than-Conventional Radiation Doses in Localized Prostate Cancer Treatment: A Meta-analysis of Randomized, Controlled Trials. Int J Radiat Oncol Biol Phys. 2009;74(5):1405-1418.
2. Modat M, Ridgway GR, Taylor ZA, et al. Fast free-form deformation using graphics processing units. Comput Methods Programs Biomed. 2010;98(3):278-284.
3. Le Bihan D, Breton E, Lallemand D, Grenier P, Cabanis E, Laval-Jeantet M. MR imaging of intravoxel incoherent motions: application to diffusion and perfusion in neurologic disorders. Radiology. 1986;161(2):401-407.
4. Panagiotaki E, Schneider T, Siow B, Hall MG, Lythgoe MF, Alexander DC. Compartment models of the diffusion MR signal in brain white matter: a taxonomy and comparison. Neuroimage. 2012;59(3):2241-2254.
5. Bailey C, Bourne RM, Siow B, et al. VERDICT MRI validation in fresh and fixed prostate specimens using patient-specific moulds for histological and MR alignment. NMR Biomed. 2019;32(5).
6. Panagiotaki E, Chan RW, Dikaios N, et al. Microstructural Characterization of Normal and Malignant Human Prostate Tissue With Vascular , Extracellular , and Restricted Diffusion for Cytometry in Tumours Magnetic Resonance Imaging. Invest Radiol. 2015;50(4):218-227.
Figures