4252
Image quality comparisons of novel and commercial coil setups in MRI for head and neck radiotherapy simulation1Radiation Oncology, Brigham and Women’s Hospital, Dana-Farber Cancer Institute, Harvard Medical School, Boston, MA, United States, 2Division of Neuroradiology, Brigham and Women’s Hospital, Dana-Farber Cancer Institute, Harvard Medical School, Boston, MA, United States, 3Radiation Oncology, Brigham and Women’s Hospital, Dana-Farber Cancer Institute, Boston, MA, United States
Synopsis
Quality characteristics of healthy volunteer head images (SNR, CNR, artifact size) were compared between two flexible coil arrangements encompassing radiotherapy immobilization masks relative to a gold standard diagnostic Head/Neck20 coil that cannot accommodate the masks. The novel arrangement of two UltraFlexLarge18 coils provided higher SNR ratios and was more spacious than the commercially recommended arrangement of two FlexLarge4 coils. Artifact size and CNR ratios were similar for the two coil setups. Clinical application of the UltraFlexLarge18 coil arrangement would be advantageous for head and neck radiotherapy MRI simulations due to higher SNR and increased patient comfort.
Introduction
Imaging for radiotherapy treatment planning is performed in the treatment position to accurately localize tumor and organs at risk. Head and neck treatment planning would benefit from the superior soft tissue contrast provided by MRI, but standard MR receive coils cannot accommodate thermoplastic masks used for immobilization during irradiation. Flexible array coils can be arranged to encompass these immobilization devices; however, compromises in image quality compared to standard diagnostic coils should be minimized. The present healthy volunteer study compared a novel arrangement of two UltraFlexLarge18 (UFL18) coils against a commercially recommended (Qfix Insight) arrangement of two FlexLarge4 (FL4) coils relative to a diagnostic Head/Neck20 (HN20) coil for signal-to-noise ratio (SNR), contrast-to-noise ratio (CNR) and artifact size (AS).Methods
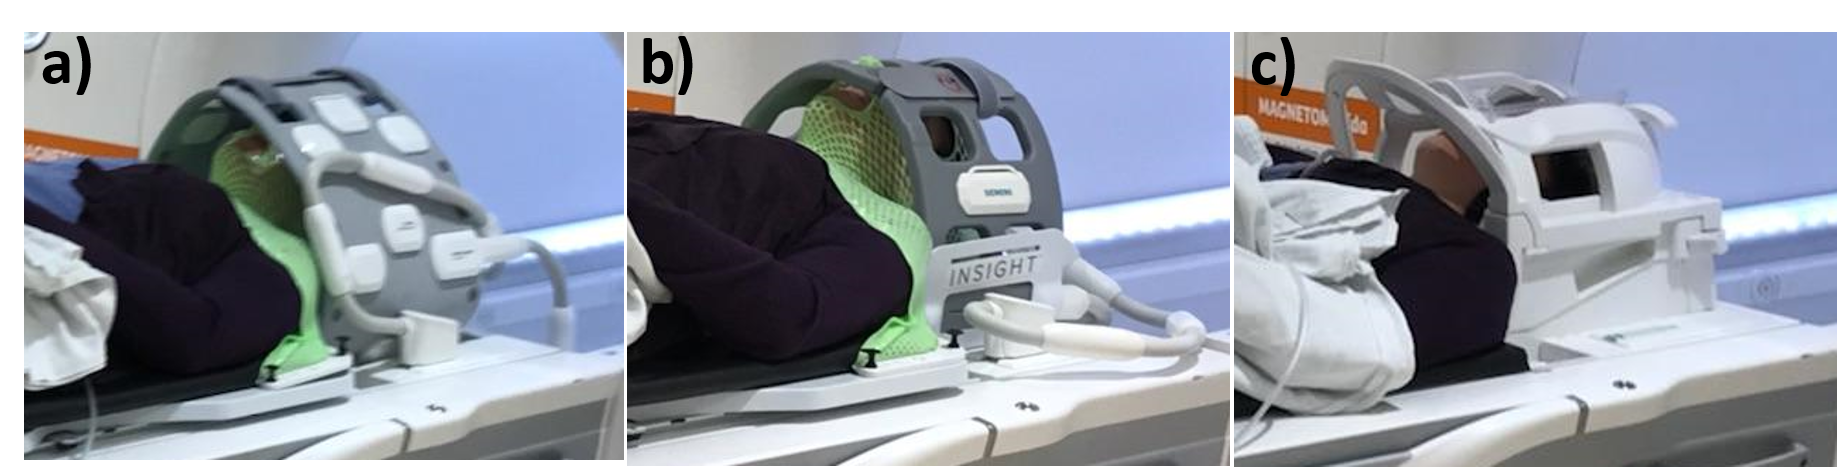
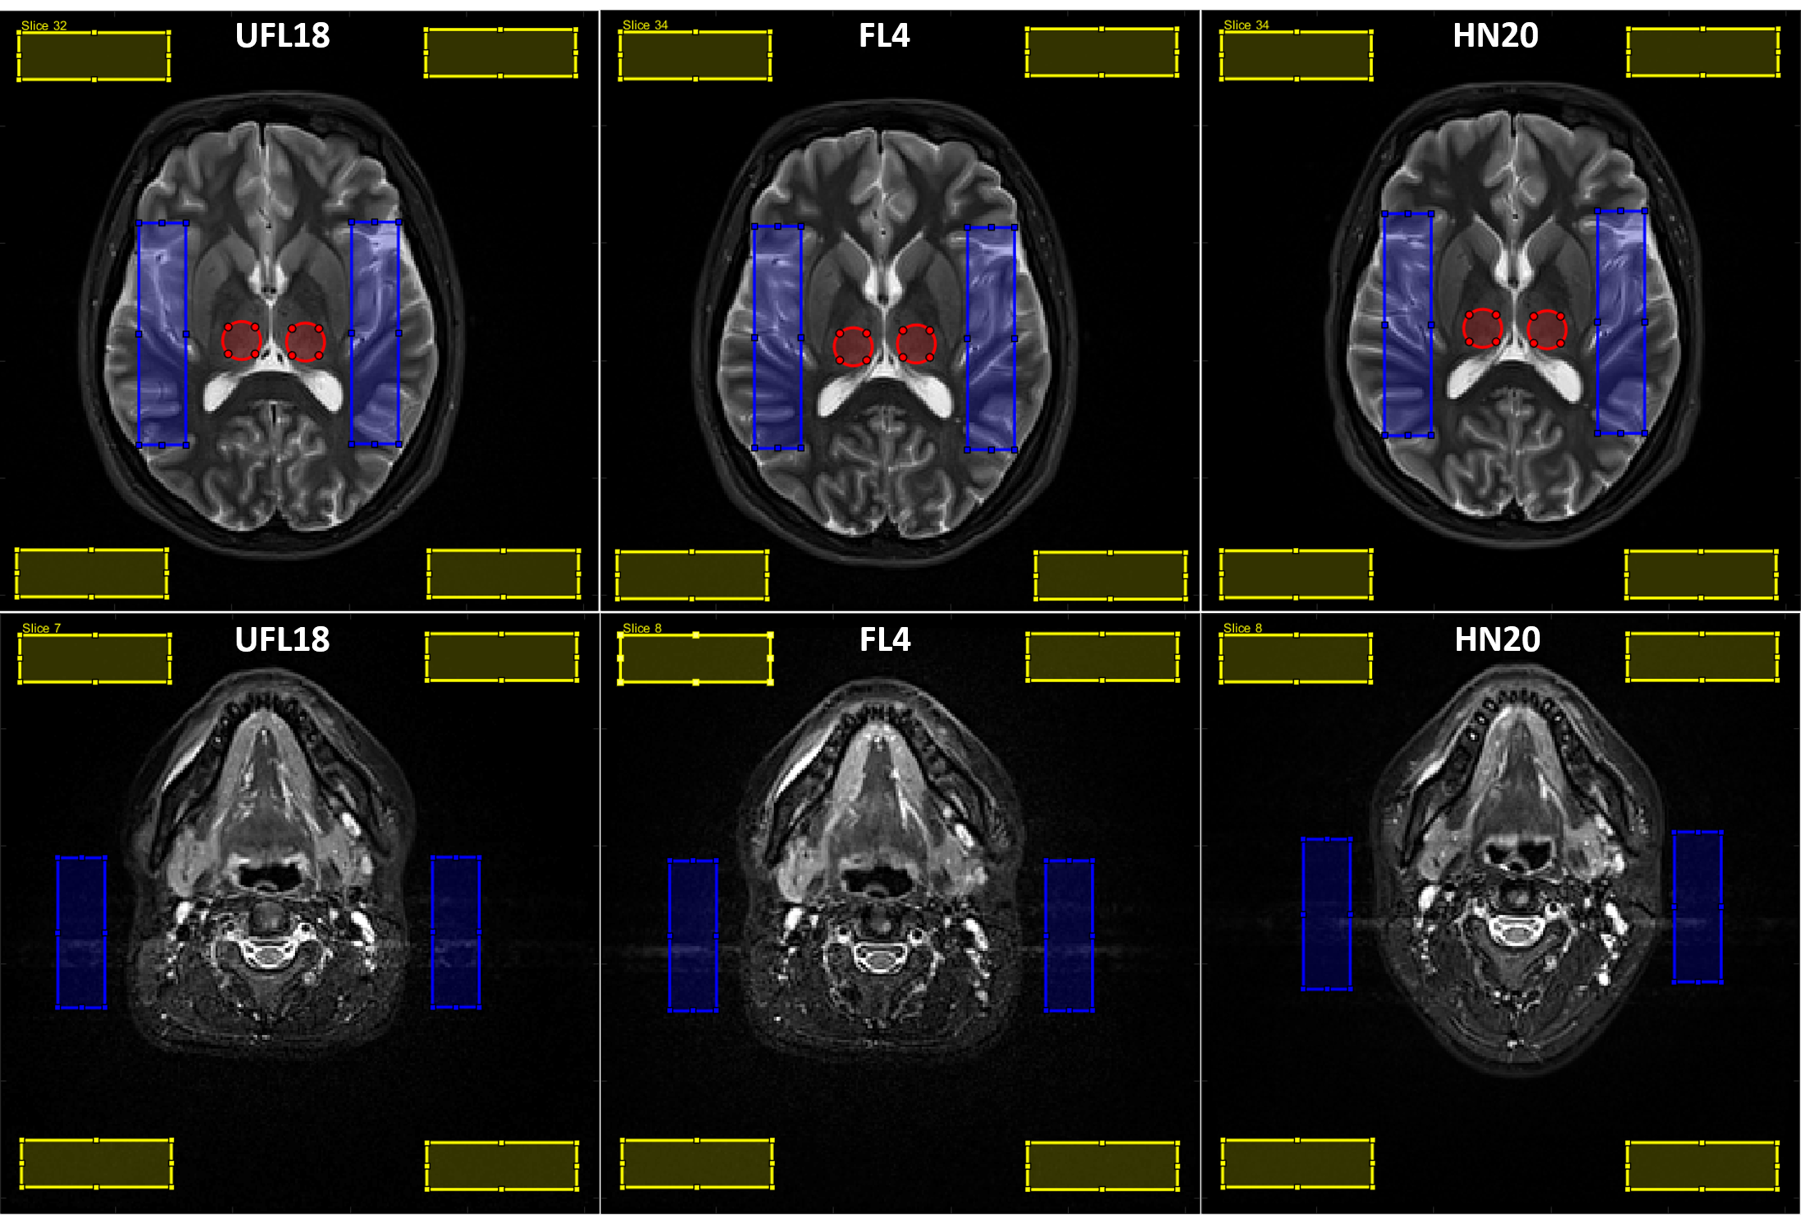
Three consented healthy volunteers (two females, one male) were imaged successively in the UFL18 and FL4 coil setups with immobilization mask and in the HN20 coil without a mask in a 3T Siemens Vida (Figure 1). Three axial clinical sequences (T1-weighted Turbo Spin Echo (TSE), T2-weighted SPectral Attenuated Inversion Recovery (SPAIR), Short-TI Inversion Recovery (STIR); TR/TE/TI: 669/9.7, 4970/108, 3000/65/220 ms; pixel size: 0.68x0.68, 0.83x0.83, 0.94x0.94 mm2) covering the head from the chin to the top of the brain using 50 4-mm thick slices were acquired for each coil setup.Applying custom MATLAB software on each data series, circular regions of interest (ROIs) were placed on a single slice for the tongue base, parotids, pterygoid muscles, brainstem and thalamus; rectangular ROIs were placed on the cerebellum and brain, and on background areas presenting flow or eye motion artifacts (one, four, and three slices at different levels, respectively). ROI size was equal between the matching slices of different sequences and coils for the same subject. Example ROIs are presented on Figure 2. The histogram spread of rectangular ROIs was calculated as a measure of contrast in these ROIs [1] and represented artifact size (AS) for the artifact ROIs. The mean signal of each circular or rectangular tissue ROI was extracted. Signal- and contrast-to-noise ratios (SNR, CNR) of tissue ROIs were computed using as noise estimate the average signal standard deviation from four background ROIs at the corners of selected slices. Ratios of SNR, CNR and AS parameters obtained with the UFL18 or FL4 arrangement relative to the HN20 coil (parameter_UFL18/parameter_HN20, parameter_FL4/parameter_HN20) were formed and compared using Wilcoxon rank-sum tests.
Results
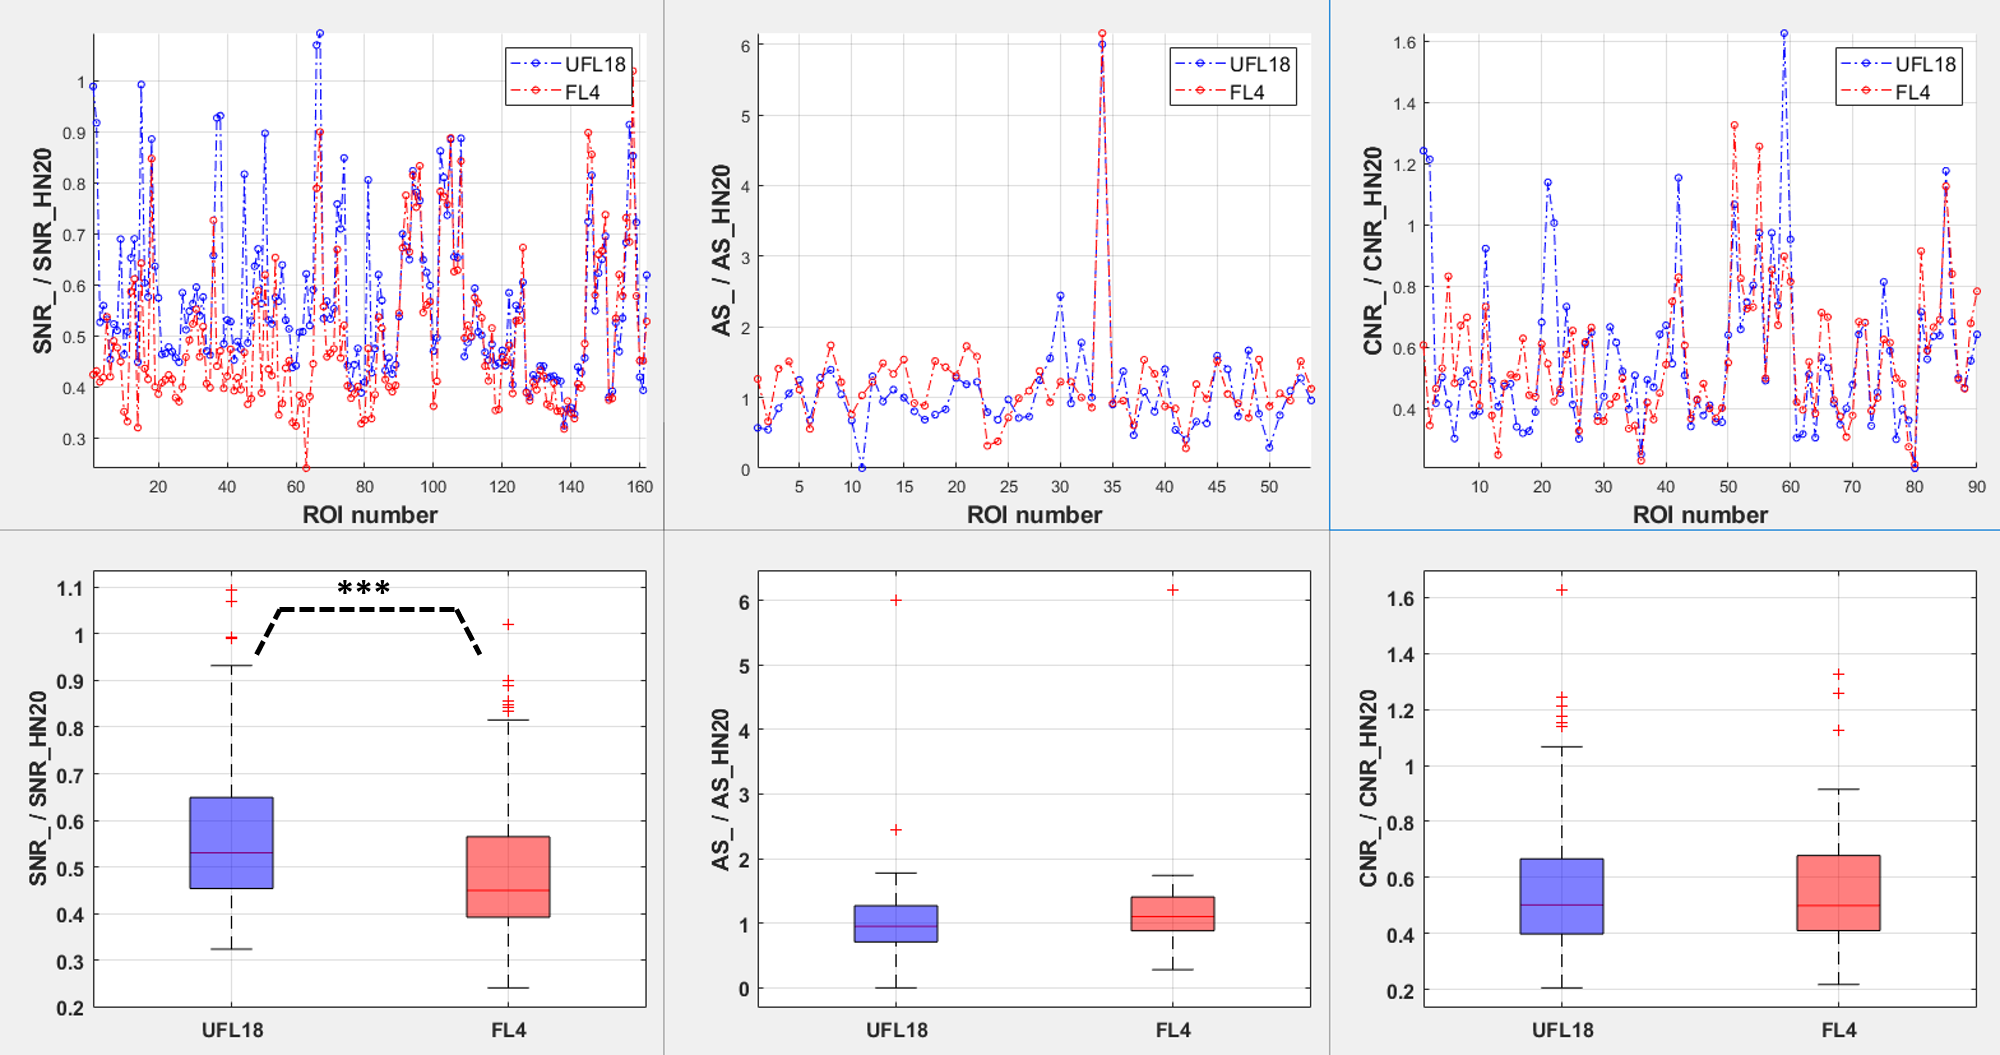
With the applied method AS was calculated for 6, SNR for 18, and CNR for 10 ROIs for each sequence and coil. A total of 54 AS, 162 SNR and 90 CNR data points were obtained for each coil over all three sequences and three volunteers. Consequently, an equal number of AS, SNR and CNR parameter ratios of UFL18 and FL4 relative to HN20 were produced. Graphs of the calculated parameter ratios over all ROIs and summary box-and-whisker plots are shown on Figure 3. Wilcoxon rank-sum tests indicated that SNR_UFL18/SNR_HN20 was significantly higher (Z=5.22, p=1.7E-7) than SNR_FL4/SNR_HN20, while AS_UFL18/AS_HN20 and AS_FL4/AS_HN20 as well as CNR_UFL18/CNR_HN20 and CNR_FL4/CNR_HN20 ratios had equal medians (Z=-1.87, p=0.06 and Z=-0.22, p=0.82, respectively).Discussion
This work compared a new UFL18 coil arrangement to a commercially recommended FL4 coil arrangement using radiotherapy immobilization equipment and clinical sequences covering the whole head. Multiple ROIs on different slices allowed for thorough image quality assessments at different areas inside the coils and provided a sufficient number of data points for statistical analysis. As mean signal and contrast varies for different ROIs and imaging sequences, the assessed image quality characteristics were not compared directly between the two coil setups but relative to a diagnostic HN20 coil considered as gold standard. A newly developed MATLAB code allowed for expedited and equitable data processing.The combination of two phased array coils with 18 elements each demonstrated a significantly higher SNR ratio than the combination of phased array coils having 4 elements. These results agree with expectations since SNR theoretically increases with the square root of coil element number [2], although gains are less high in practice depending on geometrical and noise factors [3]. Application of the UFL18 coil arrangement in MRI head and neck radiotherapy treatment planning would allow for improved tumor and organ at risk delineation thanks to higher SNR. Moreover, artifact size ratio was overall smaller for UFL18, albeit not statistically significant. Statistical tests revealed no significant CNR ratio differences between the assessed coil setups.
In addition, the combination of the longer UFL18 coils provided more room to better accommodate heads of larger size and volunteers reported that it felt more comfortable and less claustrophobic than the tighter FL4 coil setup.
Conclusion
The new UFL18 arrangement was more spacious and yielded higher SNR relative to a diagnostic head/neck coil than a commercially recommended FL4 coil arrangement, suggesting that its clinical application would be advantageous for head and neck radiotherapy MRI simulations.Acknowledgements
Kayes Techonology Grant 2019References
1. Tripathi AK, Mukhopadhyay S, Dhara AK. Performance Metrics for Image Contrast. Proceedings of the 2011 International Conference on Image Information Processing (ICIIP 2011).
2. Wright SM, Wald LL. Theory and application of array coils in MR spectroscopy. NMR Biomed. 1997;10(8):394-410.
3. Fleischer CC, Zhong X, Mao H. Effects of proximity and noise level of phased array coil elements on overall signal-to-noise in parallel MR spectroscopy. Magn Reson Imaging. 2018;47:125-130.
Figures