4250
Towards higher accuracy mapping of MRI to electron density using a 3D deep CNN for MRI-only radiotherapy treatment planning1Department of Radiation Oncology, University of California, San Francisco, San Francisco, CA, United States, 2Department of Radiology, University of California, San Francisco, San Francisco, CA, United States, 3Department of Physics, University of California, Berkeley, Berkeley, CA, United States, 4Department of Radiation Oncology, Harvard Medical School, Boston, MA, United States
Synopsis
We implemented a novel approach of using MRI to synthesize CT datasets acquired at MV photon energies for more accurate electron density mapping in radiotherapy treatment planning. We used a 3D deep convolutional neural network and demonstrated clinical proof-of-concept by evaluating the dosimetric impact of using synthetic datasets in a test radiotherapy treatment plan. The proposed method produced mean MAE of 72.8±17.3 HU and SSIM of 0.82 in the test dataset. The dose distributions computed on the test case produced 100% gamma passing rate (computed at 3%/3mm) indicating that synthetic MV images may be used for clinical treatment planning.
Introduction
There has been a substantial increase in the use of MRI in radiotherapy due to the superior soft tissue contrast provided relative to CT, and a MR-only workflow would streamline clinical efficiency and remove CT-to-MR registration errors1. A critical step in radiotherapy dose calculation relies on obtaining accurate patient-specific maps of electron density information, which is typically derived from the Hounsfield Units (HUs) of CT scans acquired at 120kVp (kVCT). Therefore, in the roadmap to developing a MR-only workflow, many groups have investigated the derivation of synthetic kVCT (skVCT) scans from MRI using machine learning-based approaches. While kVCT scans provide acceptable electron density maps for photon-based radiotherapy, images acquired directly from the treatment beam at MV energies (MVCT) provide more accurate electron density information essential for dose calculation2. Photon interactions with matter are a function of elemental composition and x-ray energy. In the kV range photons interact mainly through the photoelectric effect, which does not depend directly on electron density, while in the MV range the dominant mode is Compton Scattering, which does. In this work, we implement a novel approach of synthesizing MVCT (sMVCT) datasets to map HU directly to electron density from MRI using a 3D deep convolutional neural network (DCNN). We demonstrate clinical proof-of-concept by evaluating the dosimetric impact of using a synthetic dataset in a test radiotherapy treatment plan. The approach proposed in this work offers a superior solution for MRI-only treatment planning: the MRI can be utilized for anatomical delineation while the sMVCT generated from the MRI can be utilized for electron density mapping.Methods
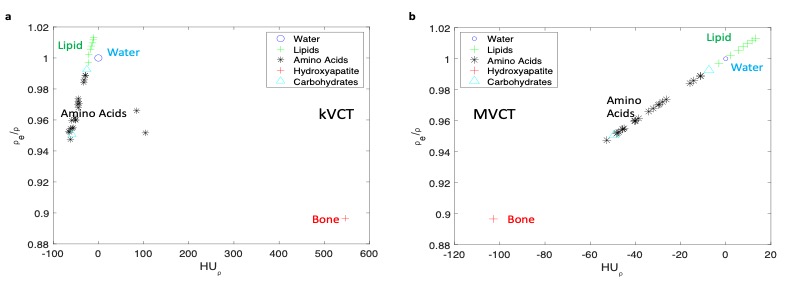
First, to motivate the improved accuracy of mapping HU to electron density using MV versus kV energies, mass attenuation coefficients provided in the NIST XCOM database3 were used to calculate theoretical HU values for several biological molecules. Theoretical mass density-normalized HU values were plotted against corresponding theoretical mass density-normalized electron density to demonstrate non-one-to-one and one-to-one relationships for kV and MV energies, respectively. Second, 3.5MV CT scans acquired on an Accuray TomoHD system and T1-weighted MRIs for 120 head and neck cancer patients treated at our institution were acquired retrospectively (IRB 14-15452). Datasets were rigidly co-registered and resampled to a 512x512 matrix. MVCTs were masked to match the MRI field-of-view and MRI intensity values for each scan were normalized to standardize datasets acquired on different scanners. A deep neural network based on a fully-convolutional 3D residual U-net architecture was implemented to develop a mapping of MRI intensity value to MVCT HU. Input to the model were volumetric patches (64x64x32) generated from 100 paired MRI and MVCT datasets. The U-net was initialized with random parameters and trained for 80 epochs using the Adam optimizer (initial learning rate 10-5) on an objective that minimizes the mean absolute error (MAE) between the measured 3D MVCT map and MRI-derived sMVCT map. The accuracy of the model was evaluated on 20 withheld test exams never seen by the algorithm. The generated sMVCTs were compared to their respective actual MVCTs using MAE (mean and standard deviation) and structural similarity index (SSIM). Third, to demonstrate clinical proof-of-concept of utilizing the sMVCT images, an intensity-modulated photon radiotherapy plan was generated on a MVCT, then calculated with fixed plan parameters onto the corresponding sMVCT. Dose distributions were compared using dose volume histograms (DVHs) and gamma analysis computed using standard quality assurance criteria of 3%/3mm agreement at 10% local dose threshold.Results
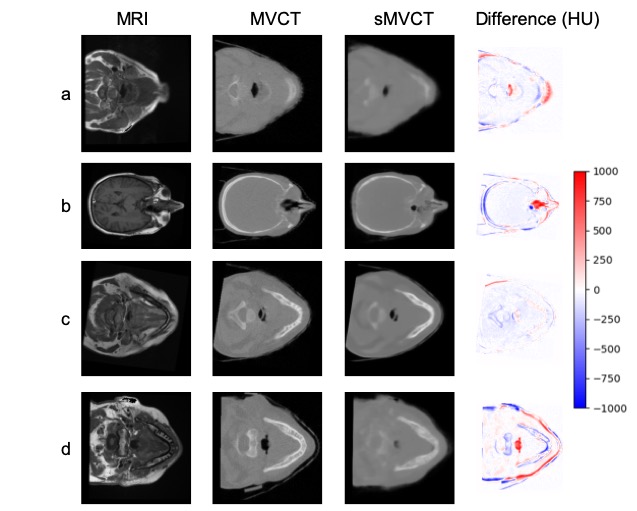
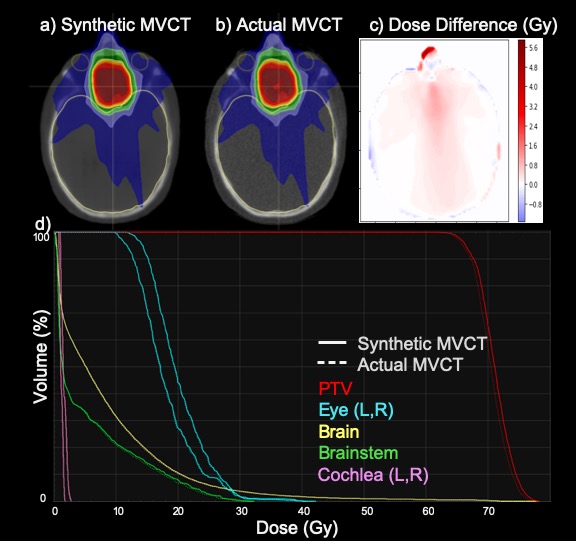
Figure 1 demonstrates the degenerate relationship between HU and electron density for CT scans acquired at kV energies (1a) versus the one-to-one relationship for those acquired at MV energies (1b) for several biologically relevant molecules. Figure 2 shows cross-sectional views of four test datasets with corresponding MRI, MVCT, sMVCT produced by the 3D DCNN model, and HU difference maps between sMVCT and MVCT images. In certain cases, sMVCTs deviated from MVCTs when there were changes in sinus filling (2b), differences in external contours due to variability in patient positioning (2d), or when immobilization devices were used (2a-d). Accurately defining bone is an ongoing challenge when using MRI for creating synthetic CTs. Overall, the proposed method produced mean MAE of 48.6±16.7 and 72.8±17.3 HU and SSIM of 0.89 and 0.82 in training and test datasets, respectively. Figure 3 shows a comparison of a radiotherapy treatment plan calculated on the sMVCT (3a) and MVCT (3b) with the corresponding difference in dose distributions (3c). DVHs for both plans are displayed for the planning treatment volume (PTV) and nearby organs at risk (3d), with all histograms in close agreement between sMVCT and MVCT datasets. The gamma passing rate between dose distributions computed at 3%/3mm was 100%.Conclusion
Results demonstrate that MVCT can provide a one-to-one relationship between HU and relative electron density, and is conceivably more accurate than its kV counterpart. Furthermore, synthetic MVCT datasets can be generated from T1-weighted MRI using a 3D DCNN. Dose calculation on a sample sMVCT resulted in a distribution that agreed with the actual MVCT to within 100% when analyzed using 3%/3mm gamma criteria. In addition to photon-based radiotherapy, this approach is promising for proton-based radiotherapy, in which accurate electron density is even more critical.Acknowledgements
No acknowledgement found.References
1. Owrangi AM, Greer PB, Glide-Hurst CK. MRI-only treatment planning: benefits and challenges. Phys Med Biol. 2018;63(5):05TR01.
2. Ainsley CG, Yeager CM. Practical considerations in the calibration of CT scanners for proton therapy. J Appl Clin Med Phys. 2014;15(3):4721.
3. M.J. Berger JHH, S.M. Seltzer, J. Chang, J.S. Coursey, R. Sukumar, D.S. Zucker, and K. Olsen. XCOM: Photon Cross Sections Database. NIST, PML, Radiation Physics Division. 2010.
Figures